
|
|||||
|
 | |
| |
| |
| |
| |
| |
|
Gene: TMEM53 |
Gene summary for TMEM53 |
| Gene information | Species | Human | Gene symbol | TMEM53 | Gene ID | 79639 |
| Gene name | transmembrane protein 53 | |
| Gene Alias | NET4 | |
| Cytomap | 1p34.1 | |
| Gene Type | protein-coding | GO ID | GO:0005575 | UniProtAcc | Q6P2H8 |
Top |
Malignant transformation analysis |
| Identification of the aberrant gene expression in precancerous and cancerous lesions by comparing the gene expression of stem-like cells in diseased tissues with normal stem cells |
| Entrez ID | Symbol | Replicates | Species | Organ | Tissue | Adj P-value | Log2FC | Malignancy |
| 79639 | TMEM53 | LZE20T | Human | Esophagus | ESCC | 1.38e-05 | 1.83e-01 | 0.0662 |
| 79639 | TMEM53 | LZE24T | Human | Esophagus | ESCC | 6.27e-05 | 1.29e-01 | 0.0596 |
| 79639 | TMEM53 | P2T-E | Human | Esophagus | ESCC | 4.41e-07 | 1.50e-01 | 0.1177 |
| 79639 | TMEM53 | P4T-E | Human | Esophagus | ESCC | 1.12e-07 | 2.40e-01 | 0.1323 |
| 79639 | TMEM53 | P5T-E | Human | Esophagus | ESCC | 1.88e-04 | 1.23e-01 | 0.1327 |
| 79639 | TMEM53 | P8T-E | Human | Esophagus | ESCC | 9.02e-11 | 1.95e-01 | 0.0889 |
| 79639 | TMEM53 | P9T-E | Human | Esophagus | ESCC | 1.75e-02 | 1.15e-01 | 0.1131 |
| 79639 | TMEM53 | P10T-E | Human | Esophagus | ESCC | 7.31e-14 | 2.77e-01 | 0.116 |
| 79639 | TMEM53 | P11T-E | Human | Esophagus | ESCC | 1.89e-04 | 2.23e-01 | 0.1426 |
| 79639 | TMEM53 | P12T-E | Human | Esophagus | ESCC | 3.50e-02 | 9.65e-02 | 0.1122 |
| 79639 | TMEM53 | P15T-E | Human | Esophagus | ESCC | 2.58e-09 | 1.95e-01 | 0.1149 |
| 79639 | TMEM53 | P21T-E | Human | Esophagus | ESCC | 2.56e-16 | 2.70e-01 | 0.1617 |
| 79639 | TMEM53 | P22T-E | Human | Esophagus | ESCC | 7.90e-03 | 7.98e-02 | 0.1236 |
| 79639 | TMEM53 | P23T-E | Human | Esophagus | ESCC | 7.38e-21 | 4.89e-01 | 0.108 |
| 79639 | TMEM53 | P26T-E | Human | Esophagus | ESCC | 1.88e-04 | 1.34e-01 | 0.1276 |
| 79639 | TMEM53 | P27T-E | Human | Esophagus | ESCC | 7.98e-13 | 2.01e-01 | 0.1055 |
| 79639 | TMEM53 | P28T-E | Human | Esophagus | ESCC | 8.40e-04 | 8.22e-02 | 0.1149 |
| 79639 | TMEM53 | P30T-E | Human | Esophagus | ESCC | 3.33e-07 | 2.28e-01 | 0.137 |
| 79639 | TMEM53 | P31T-E | Human | Esophagus | ESCC | 1.30e-15 | 2.32e-01 | 0.1251 |
| 79639 | TMEM53 | P32T-E | Human | Esophagus | ESCC | 9.02e-11 | 1.93e-01 | 0.1666 |
| Page: 1 2 3 4 |
| Tissue | Expression Dynamics | Abbreviation |
| Esophagus |  | ESCC: Esophageal squamous cell carcinoma |
| HGIN: High-grade intraepithelial neoplasias | ||
| LGIN: Low-grade intraepithelial neoplasias | ||
| Liver | 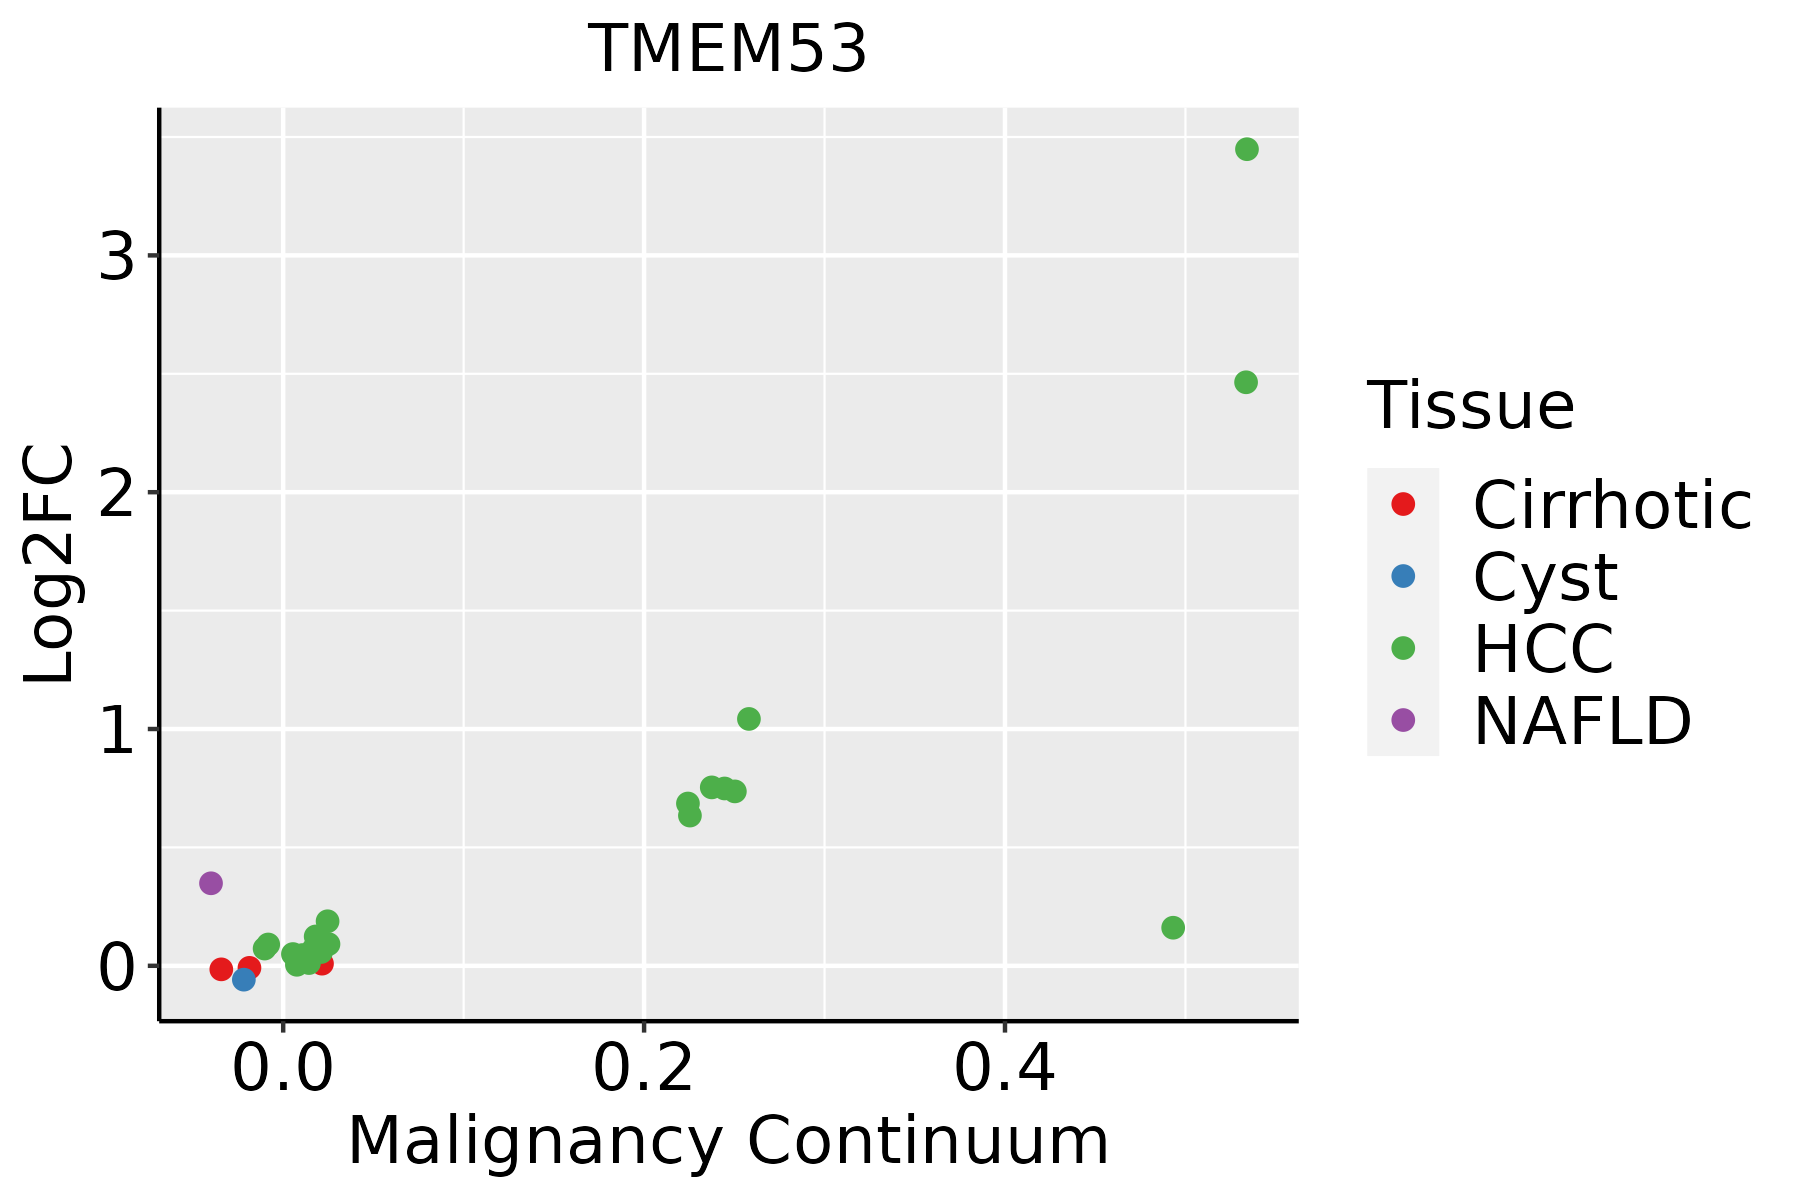 | HCC: Hepatocellular carcinoma |
| NAFLD: Non-alcoholic fatty liver disease | ||
| Oral Cavity | 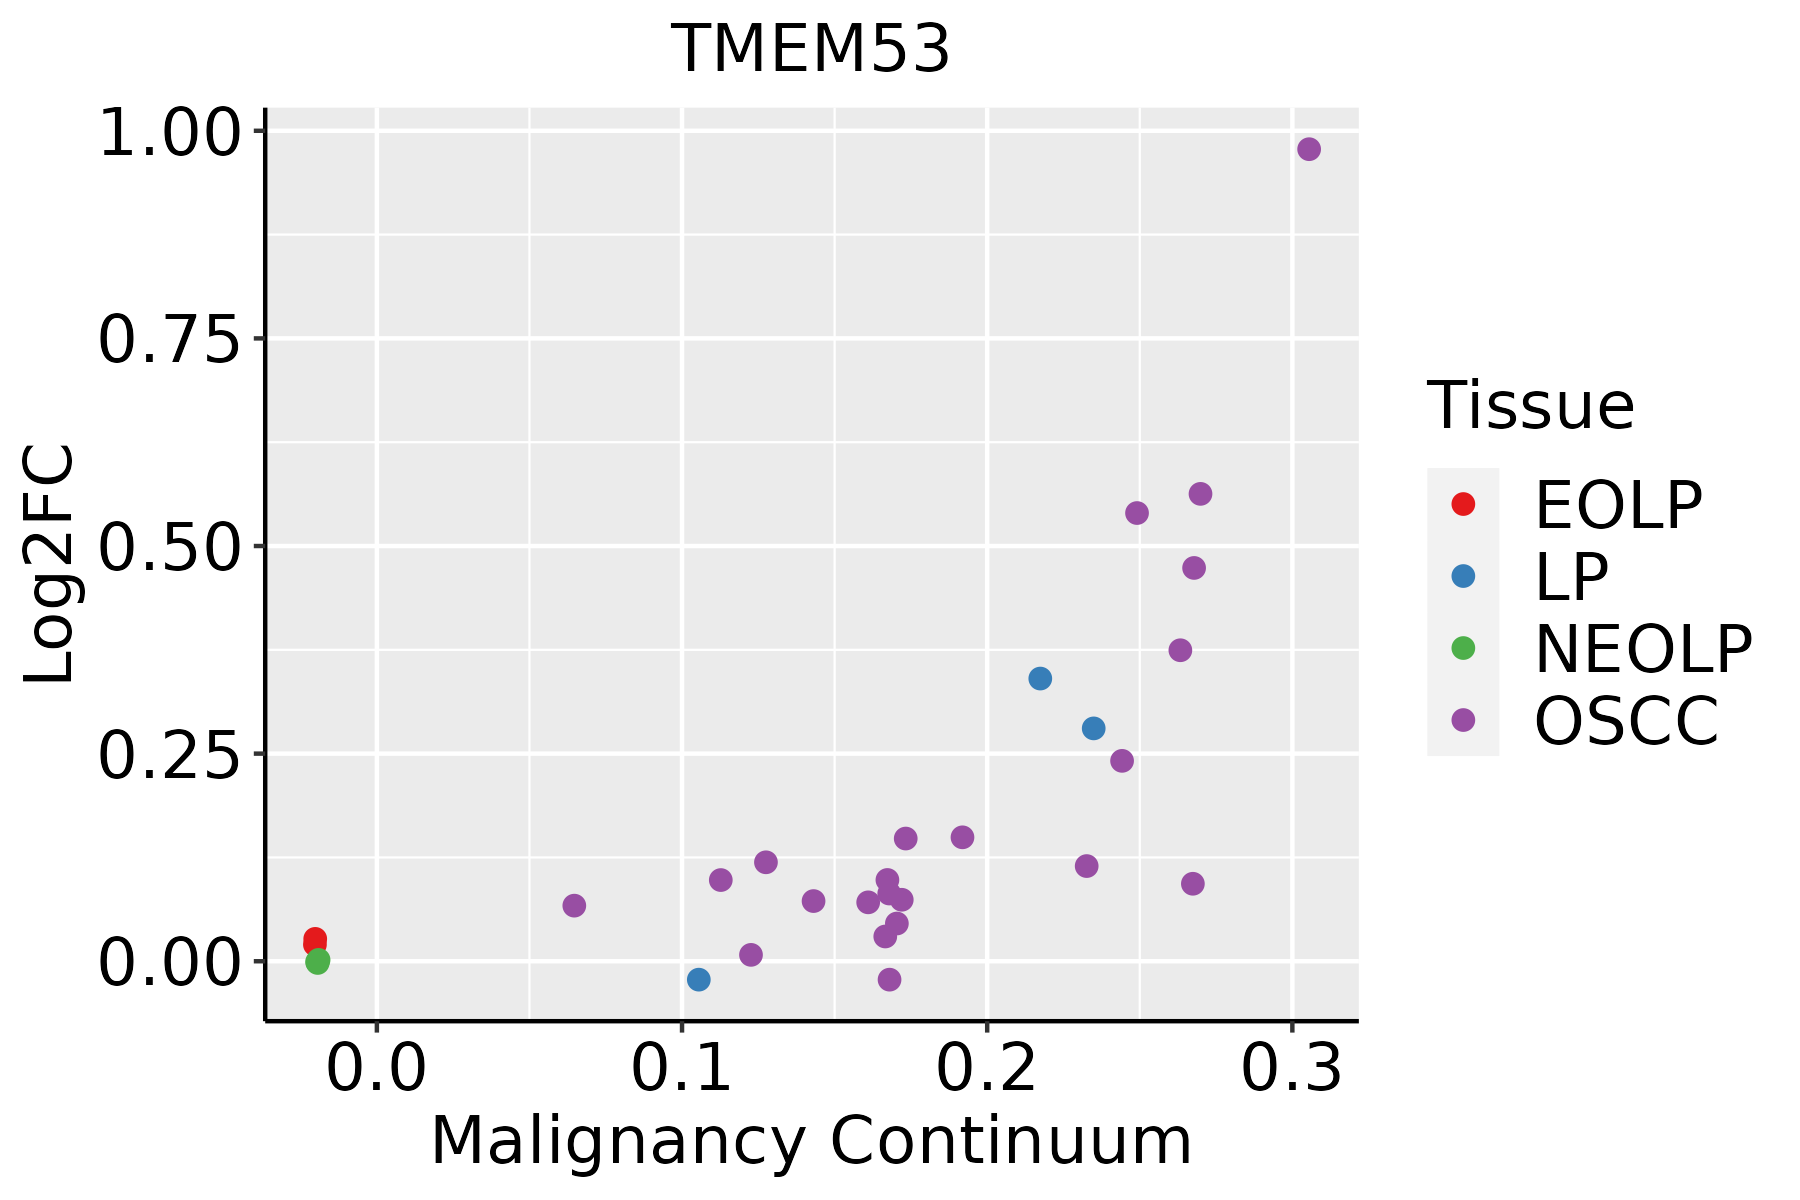 | EOLP: Erosive Oral lichen planus |
| LP: leukoplakia | ||
| NEOLP: Non-erosive oral lichen planus | ||
| OSCC: Oral squamous cell carcinoma |
| ∗log2FC in expression of this searched gene in stem-like cells from each diseased tissue sample relative to stem-like cells in normal samples in each tissue plotted against the malignancy continuum. Samples are colored based on if they are from different disease stage. |
Top |
Malignant transformation related pathway analysis |
| Find out the enriched GO biological processes and KEGG pathways involved in transition from healthy to precancer to cancer |
| Tissue | Disease Stage | Enriched GO biological Processes |
| Colorectum | AD |  |
| Colorectum | SER |  |
| Colorectum | MSS |  |
| Colorectum | MSI-H |  |
| Colorectum | FAP |  |
| ∗Top 15 enriched GO BP terms are showed in the bar plot of each disease state in each tissue. Each row represents a significant GO biological process which is colored according to the -log10(p.adjust). |
| Page: 1 2 3 4 5 6 7 8 9 |
| GO ID | Tissue | Disease Stage | Description | Gene Ratio | Bg Ratio | pvalue | p.adjust | Count |
| Page: 1 |
| Pathway ID | Tissue | Disease Stage | Description | Gene Ratio | Bg Ratio | pvalue | p.adjust | qvalue | Count |
| Page: 1 |
Top |
Cell-cell communication analysis |
| Identification of potential cell-cell interactions between two cell types and their ligand-receptor pairs for different disease states |
| Ligand | Receptor | LRpair | Pathway | Tissue | Disease Stage |
| Page: 1 |
Top |
Single-cell gene regulatory network inference analysis |
| Find out the significant the regulons (TFs) and the target genes of each regulon across cell types for different disease states |
| TF | Cell Type | Tissue | Disease Stage | Target Gene | RSS | Regulon Activity |
| ∗The dot plots of a searched regulon are shown for all cell subpopulations in each disease state of each tissue based on the regulon specific score inferred using pySCENIC and by calculating the average expression. |
| Page: 1 |
Top |
Somatic mutation of malignant transformation related genes |
| Annotation of somatic variants for genes involved in malignant transformation |
| Hugo Symbol | Variant Class | Variant Classification | dbSNP RS | HGVSc | HGVSp | HGVSp Short | SWISSPROT | BIOTYPE | SIFT | PolyPhen | Tumor Sample Barcode | Tissue | Histology | Sex | Age | Stage | Therapy Types | Drugs | Outcome |
| TMEM53 | SNV | Missense_Mutation | novel | c.313G>C | p.Glu105Gln | p.E105Q | Q6P2H8 | protein_coding | tolerated(0.38) | benign(0.342) | TCGA-BH-A1ET-01 | Breast | breast invasive carcinoma | Female | <65 | I/II | Unknown | Unknown | SD |
| TMEM53 | SNV | Missense_Mutation | rs769914658 | c.742N>A | p.Val248Met | p.V248M | Q6P2H8 | protein_coding | tolerated(0.12) | probably_damaging(0.931) | TCGA-C8-A12X-01 | Breast | breast invasive carcinoma | Female | <65 | I/II | Unknown | Unknown | SD |
| TMEM53 | SNV | Missense_Mutation | c.30N>G | p.Ile10Met | p.I10M | Q6P2H8 | protein_coding | deleterious(0) | possibly_damaging(0.65) | TCGA-D8-A1JA-01 | Breast | breast invasive carcinoma | Female | <65 | III/IV | Chemotherapy | adriamycin | PD | |
| TMEM53 | SNV | Missense_Mutation | rs765679820 | c.712N>T | p.Arg238Cys | p.R238C | Q6P2H8 | protein_coding | deleterious(0.02) | benign(0.007) | TCGA-5M-AAT6-01 | Colorectum | colon adenocarcinoma | Female | <65 | III/IV | Unknown | Unknown | PD |
| TMEM53 | SNV | Missense_Mutation | novel | c.433N>A | p.Ala145Thr | p.A145T | Q6P2H8 | protein_coding | deleterious(0.03) | benign(0.234) | TCGA-A5-A0G2-01 | Endometrium | uterine corpus endometrioid carcinoma | Female | <65 | III/IV | Unknown | Unknown | SD |
| TMEM53 | SNV | Missense_Mutation | novel | c.479N>T | p.Ala160Val | p.A160V | Q6P2H8 | protein_coding | tolerated(0.71) | benign(0.014) | TCGA-AP-A05O-01 | Endometrium | uterine corpus endometrioid carcinoma | Female | >=65 | I/II | Chemotherapy | carboplatin | PD |
| TMEM53 | SNV | Missense_Mutation | rs541061866 | c.661N>A | p.Glu221Lys | p.E221K | Q6P2H8 | protein_coding | tolerated(0.92) | benign(0.007) | TCGA-AP-A0LM-01 | Endometrium | uterine corpus endometrioid carcinoma | Female | <65 | III/IV | Chemotherapy | cisplatin | SD |
| TMEM53 | SNV | Missense_Mutation | novel | c.193N>A | p.Val65Ile | p.V65I | Q6P2H8 | protein_coding | deleterious(0.05) | probably_damaging(0.954) | TCGA-AP-A1DV-01 | Endometrium | uterine corpus endometrioid carcinoma | Female | <65 | I/II | Unknown | Unknown | SD |
| TMEM53 | SNV | Missense_Mutation | novel | c.491G>A | p.Arg164His | p.R164H | Q6P2H8 | protein_coding | tolerated(0.29) | benign(0.001) | TCGA-AP-A1E0-01 | Endometrium | uterine corpus endometrioid carcinoma | Female | <65 | III/IV | Chemotherapy | paclitaxel | SD |
| TMEM53 | SNV | Missense_Mutation | rs572228119 | c.689N>A | p.Arg230His | p.R230H | Q6P2H8 | protein_coding | tolerated(0.69) | benign(0.017) | TCGA-AX-A0J1-01 | Endometrium | uterine corpus endometrioid carcinoma | Female | >=65 | I/II | Unknown | Unknown | SD |
| Page: 1 2 3 |
Top |
Related drugs of malignant transformation related genes |
| Identification of chemicals and drugs interact with genes involved in malignant transfromation |
| (DGIdb 4.0) |
| Entrez ID | Symbol | Category | Interaction Types | Drug Claim Name | Drug Name | PMIDs |
| Page: 1 |

Copyright 2023-Present -The University of Texas Health Science Center at Houston |