
|
|||||
|
 | |
| |
| |
| |
| |
| |
|
Gene: TMEM50B |
Gene summary for TMEM50B |
| Gene information | Species | Human | Gene symbol | TMEM50B | Gene ID | 757 |
| Gene name | transmembrane protein 50B | |
| Gene Alias | C21orf4 | |
| Cytomap | 21q22.11 | |
| Gene Type | protein-coding | GO ID | GO:0006810 | UniProtAcc | P56557 |
Top |
Malignant transformation analysis |
| Identification of the aberrant gene expression in precancerous and cancerous lesions by comparing the gene expression of stem-like cells in diseased tissues with normal stem cells |
| Entrez ID | Symbol | Replicates | Species | Organ | Tissue | Adj P-value | Log2FC | Malignancy |
| 757 | TMEM50B | LZE2T | Human | Esophagus | ESCC | 1.29e-02 | 5.98e-01 | 0.082 |
| 757 | TMEM50B | LZE4T | Human | Esophagus | ESCC | 6.14e-09 | 2.41e-01 | 0.0811 |
| 757 | TMEM50B | LZE7T | Human | Esophagus | ESCC | 7.73e-05 | 4.94e-01 | 0.0667 |
| 757 | TMEM50B | LZE8T | Human | Esophagus | ESCC | 8.48e-07 | 3.50e-01 | 0.067 |
| 757 | TMEM50B | LZE22T | Human | Esophagus | ESCC | 2.37e-02 | 4.91e-01 | 0.068 |
| 757 | TMEM50B | LZE24T | Human | Esophagus | ESCC | 1.61e-33 | 1.16e+00 | 0.0596 |
| 757 | TMEM50B | LZE6T | Human | Esophagus | ESCC | 1.61e-03 | 1.87e-01 | 0.0845 |
| 757 | TMEM50B | P1T-E | Human | Esophagus | ESCC | 8.03e-03 | 2.60e-01 | 0.0875 |
| 757 | TMEM50B | P2T-E | Human | Esophagus | ESCC | 1.32e-31 | 5.09e-01 | 0.1177 |
| 757 | TMEM50B | P4T-E | Human | Esophagus | ESCC | 1.89e-34 | 9.09e-01 | 0.1323 |
| 757 | TMEM50B | P5T-E | Human | Esophagus | ESCC | 1.85e-12 | 2.45e-01 | 0.1327 |
| 757 | TMEM50B | P8T-E | Human | Esophagus | ESCC | 2.27e-18 | 3.34e-01 | 0.0889 |
| 757 | TMEM50B | P9T-E | Human | Esophagus | ESCC | 1.68e-14 | 2.97e-01 | 0.1131 |
| 757 | TMEM50B | P10T-E | Human | Esophagus | ESCC | 8.72e-29 | 6.63e-01 | 0.116 |
| 757 | TMEM50B | P11T-E | Human | Esophagus | ESCC | 1.16e-23 | 7.54e-01 | 0.1426 |
| 757 | TMEM50B | P12T-E | Human | Esophagus | ESCC | 4.25e-46 | 8.22e-01 | 0.1122 |
| 757 | TMEM50B | P15T-E | Human | Esophagus | ESCC | 3.66e-12 | 2.81e-01 | 0.1149 |
| 757 | TMEM50B | P16T-E | Human | Esophagus | ESCC | 9.05e-28 | 5.93e-01 | 0.1153 |
| 757 | TMEM50B | P17T-E | Human | Esophagus | ESCC | 1.21e-06 | 5.76e-01 | 0.1278 |
| 757 | TMEM50B | P19T-E | Human | Esophagus | ESCC | 1.33e-13 | 7.39e-01 | 0.1662 |
| Page: 1 2 3 4 5 6 |
| Tissue | Expression Dynamics | Abbreviation |
| Esophagus |  | ESCC: Esophageal squamous cell carcinoma |
| HGIN: High-grade intraepithelial neoplasias | ||
| LGIN: Low-grade intraepithelial neoplasias | ||
| Liver |  | HCC: Hepatocellular carcinoma |
| NAFLD: Non-alcoholic fatty liver disease | ||
| Oral Cavity | 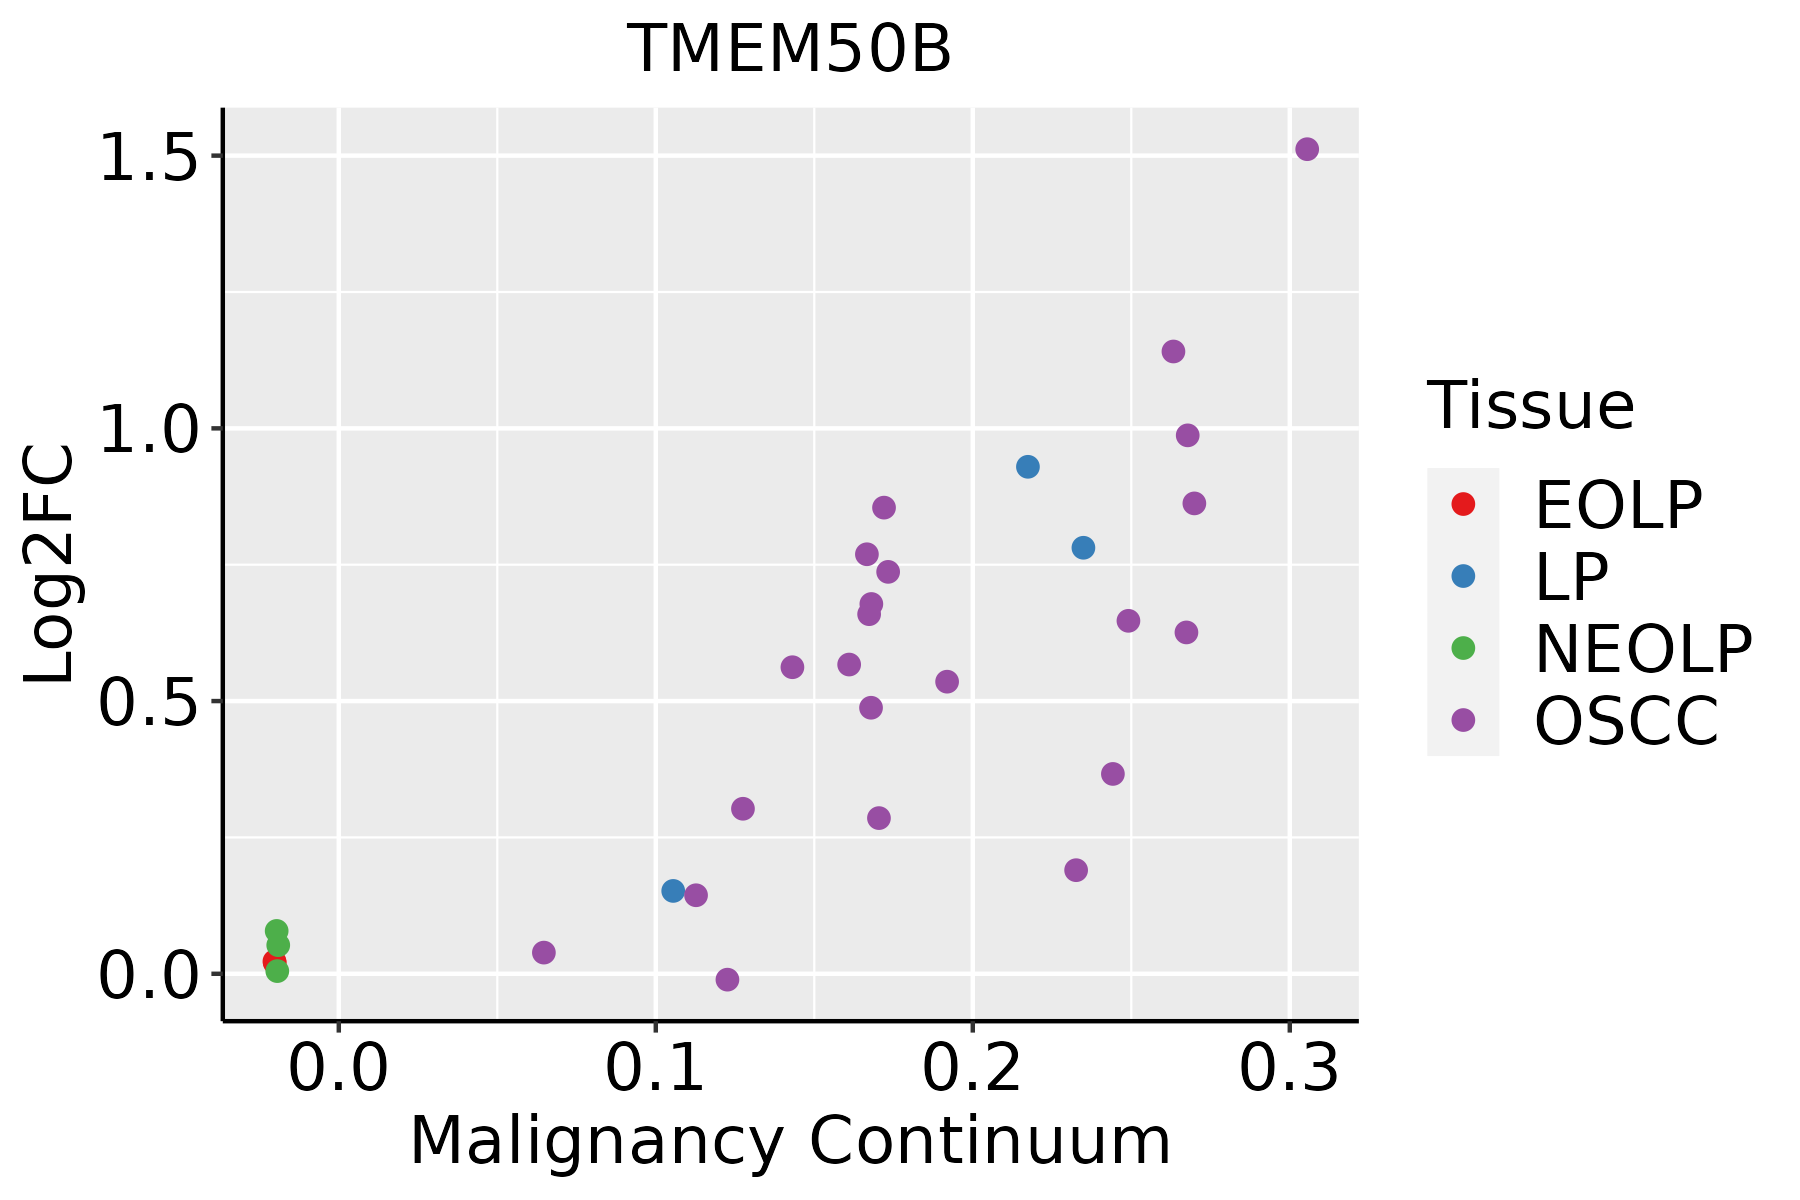 | EOLP: Erosive Oral lichen planus |
| LP: leukoplakia | ||
| NEOLP: Non-erosive oral lichen planus | ||
| OSCC: Oral squamous cell carcinoma | ||
| Thyroid | 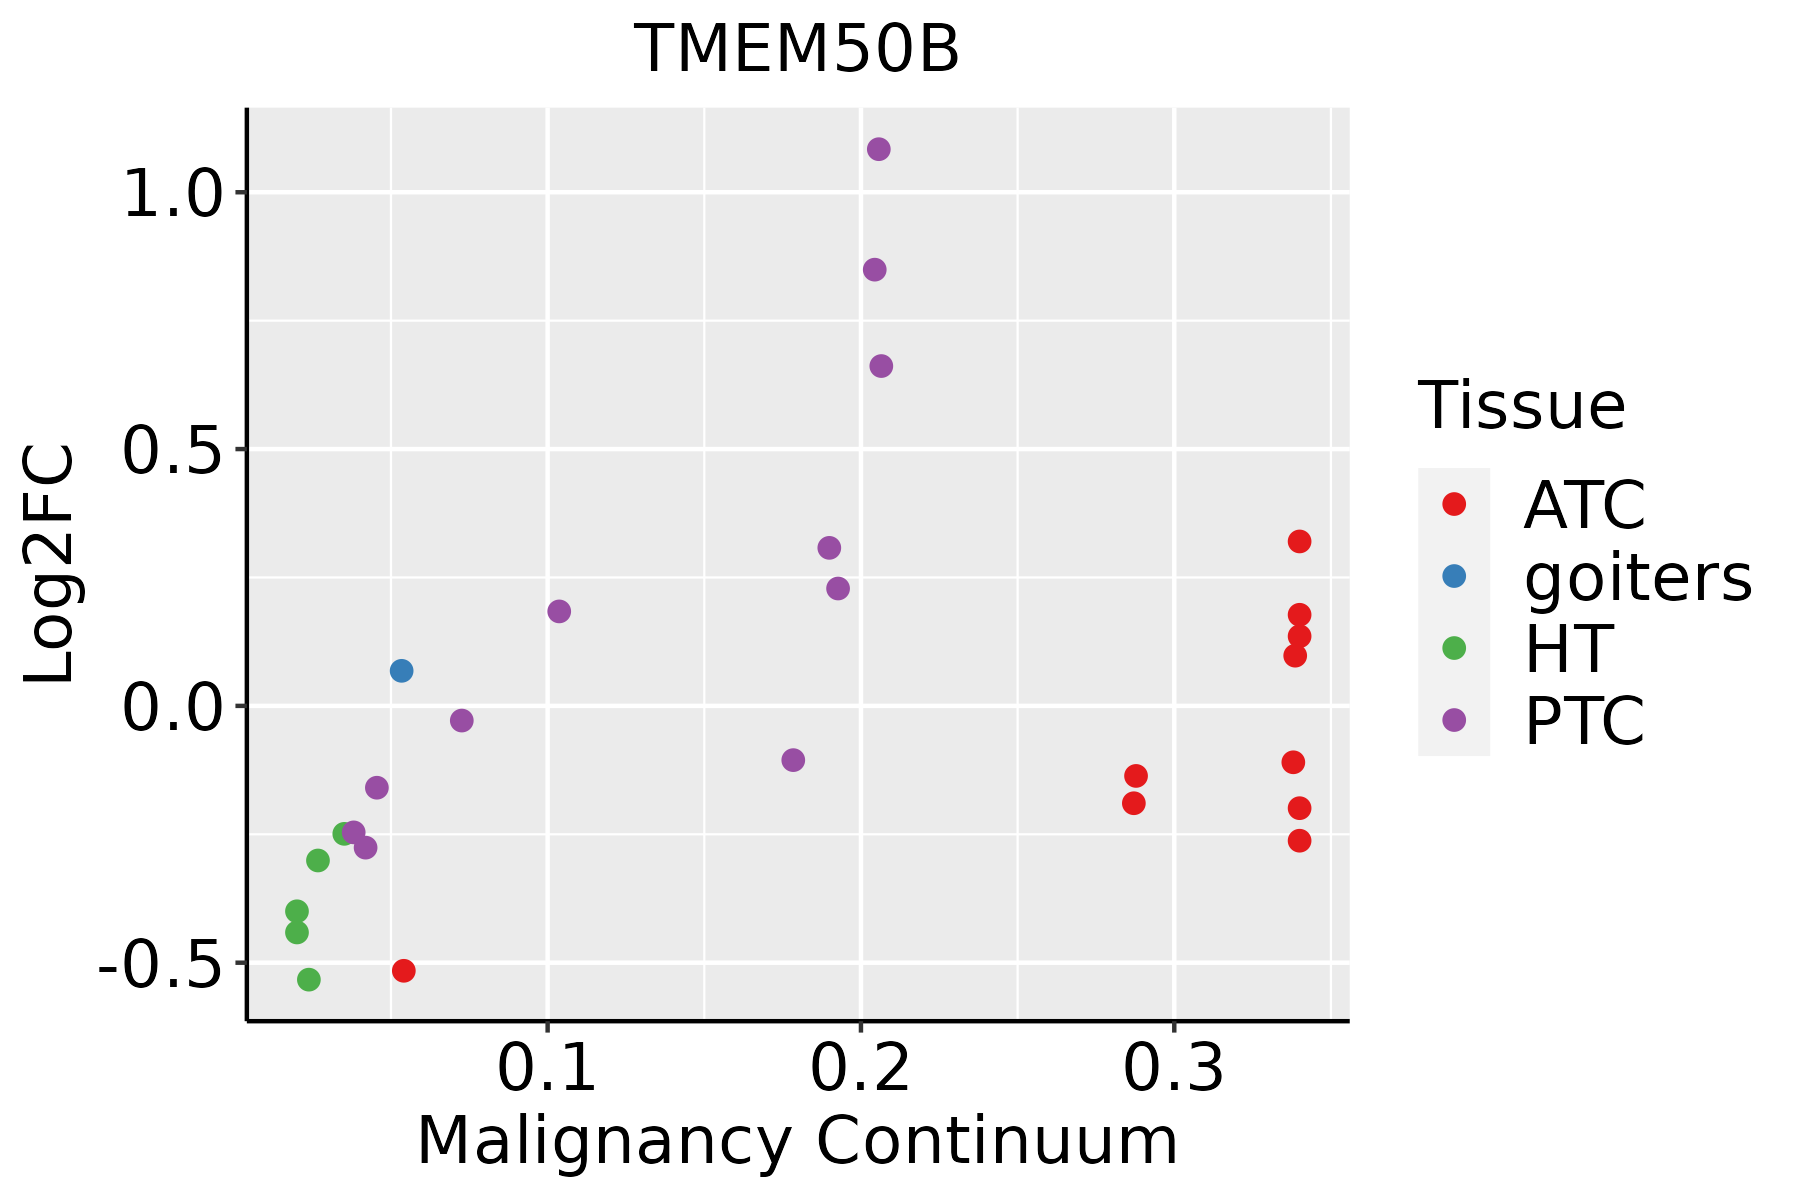 | ATC: Anaplastic thyroid cancer |
| HT: Hashimoto's thyroiditis | ||
| PTC: Papillary thyroid cancer |
| ∗log2FC in expression of this searched gene in stem-like cells from each diseased tissue sample relative to stem-like cells in normal samples in each tissue plotted against the malignancy continuum. Samples are colored based on if they are from different disease stage. |
Top |
Malignant transformation related pathway analysis |
| Find out the enriched GO biological processes and KEGG pathways involved in transition from healthy to precancer to cancer |
| Tissue | Disease Stage | Enriched GO biological Processes |
| Colorectum | AD |  |
| Colorectum | SER |  |
| Colorectum | MSS |  |
| Colorectum | MSI-H |  |
| Colorectum | FAP |  |
| ∗Top 15 enriched GO BP terms are showed in the bar plot of each disease state in each tissue. Each row represents a significant GO biological process which is colored according to the -log10(p.adjust). |
| Page: 1 2 3 4 5 6 7 8 9 |
| GO ID | Tissue | Disease Stage | Description | Gene Ratio | Bg Ratio | pvalue | p.adjust | Count |
| GO:001619715 | Esophagus | ESCC | endosomal transport | 168/8552 | 230/18723 | 2.28e-17 | 1.93e-15 | 168 |
| GO:000703417 | Esophagus | ESCC | vacuolar transport | 119/8552 | 157/18723 | 1.16e-14 | 6.30e-13 | 119 |
| GO:007198514 | Esophagus | ESCC | multivesicular body sorting pathway | 34/8552 | 37/18723 | 3.49e-09 | 7.39e-08 | 34 |
| GO:003250915 | Esophagus | ESCC | endosome transport via multivesicular body sorting pathway | 29/8552 | 31/18723 | 1.92e-08 | 3.72e-07 | 29 |
| GO:00453245 | Esophagus | ESCC | late endosome to vacuole transport | 23/8552 | 25/18723 | 1.39e-06 | 1.69e-05 | 23 |
| GO:00325113 | Esophagus | ESCC | late endosome to vacuole transport via multivesicular body sorting pathway | 16/8552 | 17/18723 | 3.46e-05 | 2.82e-04 | 16 |
| GO:000703411 | Liver | Cirrhotic | vacuolar transport | 75/4634 | 157/18723 | 3.13e-10 | 1.53e-08 | 75 |
| GO:00325093 | Liver | Cirrhotic | endosome transport via multivesicular body sorting pathway | 24/4634 | 31/18723 | 1.06e-09 | 4.76e-08 | 24 |
| GO:00719853 | Liver | Cirrhotic | multivesicular body sorting pathway | 25/4634 | 37/18723 | 4.79e-08 | 1.52e-06 | 25 |
| GO:001619711 | Liver | Cirrhotic | endosomal transport | 93/4634 | 230/18723 | 1.01e-07 | 2.93e-06 | 93 |
| GO:00453242 | Liver | Cirrhotic | late endosome to vacuole transport | 18/4634 | 25/18723 | 8.88e-07 | 1.84e-05 | 18 |
| GO:0032511 | Liver | Cirrhotic | late endosome to vacuole transport via multivesicular body sorting pathway | 12/4634 | 17/18723 | 8.92e-05 | 9.59e-04 | 12 |
| GO:001619721 | Liver | HCC | endosomal transport | 154/7958 | 230/18723 | 4.74e-14 | 2.95e-12 | 154 |
| GO:000703421 | Liver | HCC | vacuolar transport | 108/7958 | 157/18723 | 2.22e-11 | 8.69e-10 | 108 |
| GO:003250911 | Liver | HCC | endosome transport via multivesicular body sorting pathway | 28/7958 | 31/18723 | 3.56e-08 | 7.87e-07 | 28 |
| GO:007198511 | Liver | HCC | multivesicular body sorting pathway | 32/7958 | 37/18723 | 3.85e-08 | 8.35e-07 | 32 |
| GO:004532411 | Liver | HCC | late endosome to vacuole transport | 21/7958 | 25/18723 | 2.47e-05 | 2.58e-04 | 21 |
| GO:00325111 | Liver | HCC | late endosome to vacuole transport via multivesicular body sorting pathway | 15/7958 | 17/18723 | 1.31e-04 | 1.07e-03 | 15 |
| GO:00161979 | Oral cavity | OSCC | endosomal transport | 141/7305 | 230/18723 | 5.40e-12 | 2.06e-10 | 141 |
| GO:000703410 | Oral cavity | OSCC | vacuolar transport | 103/7305 | 157/18723 | 1.25e-11 | 4.44e-10 | 103 |
| Page: 1 2 3 |
| Pathway ID | Tissue | Disease Stage | Description | Gene Ratio | Bg Ratio | pvalue | p.adjust | qvalue | Count |
| Page: 1 |
Top |
Cell-cell communication analysis |
| Identification of potential cell-cell interactions between two cell types and their ligand-receptor pairs for different disease states |
| Ligand | Receptor | LRpair | Pathway | Tissue | Disease Stage |
| Page: 1 |
Top |
Single-cell gene regulatory network inference analysis |
| Find out the significant the regulons (TFs) and the target genes of each regulon across cell types for different disease states |
| TF | Cell Type | Tissue | Disease Stage | Target Gene | RSS | Regulon Activity |
| ∗The dot plots of a searched regulon are shown for all cell subpopulations in each disease state of each tissue based on the regulon specific score inferred using pySCENIC and by calculating the average expression. |
| Page: 1 |
Top |
Somatic mutation of malignant transformation related genes |
| Annotation of somatic variants for genes involved in malignant transformation |
| Hugo Symbol | Variant Class | Variant Classification | dbSNP RS | HGVSc | HGVSp | HGVSp Short | SWISSPROT | BIOTYPE | SIFT | PolyPhen | Tumor Sample Barcode | Tissue | Histology | Sex | Age | Stage | Therapy Types | Drugs | Outcome |
| TMEM50B | SNV | Missense_Mutation | rs771687407 | c.88N>A | p.Ala30Thr | p.A30T | P56557 | protein_coding | deleterious(0) | probably_damaging(0.957) | TCGA-2W-A8YY-01 | Cervix | cervical & endocervical cancer | Female | <65 | I/II | Chemotherapy | cisplatin | CR |
| TMEM50B | SNV | Missense_Mutation | novel | c.367N>G | p.Thr123Ala | p.T123A | P56557 | protein_coding | tolerated(0.81) | benign(0.003) | TCGA-AZ-4315-01 | Colorectum | colon adenocarcinoma | Male | <65 | I/II | Unknown | Unknown | SD |
| TMEM50B | insertion | Frame_Shift_Ins | novel | c.105dupT | p.Thr36TyrfsTer8 | p.T36Yfs*8 | P56557 | protein_coding | TCGA-A6-6781-01 | Colorectum | colon adenocarcinoma | Male | <65 | III/IV | Chemotherapy | oxaliplatin | SD | ||
| TMEM50B | SNV | Missense_Mutation | novel | c.287G>A | p.Arg96Gln | p.R96Q | P56557 | protein_coding | deleterious(0.01) | possibly_damaging(0.595) | TCGA-A5-A1OF-01 | Endometrium | uterine corpus endometrioid carcinoma | Female | <65 | I/II | Unknown | Unknown | SD |
| TMEM50B | SNV | Missense_Mutation | novel | c.100N>G | p.Phe34Val | p.F34V | P56557 | protein_coding | deleterious(0.03) | probably_damaging(0.996) | TCGA-AJ-A3OK-01 | Endometrium | uterine corpus endometrioid carcinoma | Female | >=65 | I/II | Chemotherapy | carboplatin | CR |
| TMEM50B | SNV | Missense_Mutation | c.207C>A | p.Phe69Leu | p.F69L | P56557 | protein_coding | tolerated(0.94) | benign(0.023) | TCGA-AP-A0LM-01 | Endometrium | uterine corpus endometrioid carcinoma | Female | <65 | III/IV | Chemotherapy | cisplatin | SD | |
| TMEM50B | SNV | Missense_Mutation | c.374A>G | p.Asn125Ser | p.N125S | P56557 | protein_coding | tolerated(0.55) | benign(0) | TCGA-BS-A0UF-01 | Endometrium | uterine corpus endometrioid carcinoma | Female | >=65 | I/II | Unknown | Unknown | SD | |
| TMEM50B | insertion | Frame_Shift_Ins | novel | c.408_409insT | p.Gln137SerfsTer8 | p.Q137Sfs*8 | P56557 | protein_coding | TCGA-AP-A051-01 | Endometrium | uterine corpus endometrioid carcinoma | Female | >=65 | I/II | Unknown | Unknown | SD | ||
| TMEM50B | deletion | Frame_Shift_Del | novel | c.1delN | p.Met1? | p.M1? | P56557 | protein_coding | TCGA-B5-A1MX-01 | Endometrium | uterine corpus endometrioid carcinoma | Female | <65 | I/II | Hormone Therapy | megace | SD | ||
| TMEM50B | SNV | Missense_Mutation | novel | c.211A>T | p.Met71Leu | p.M71L | P56557 | protein_coding | deleterious(0.04) | benign(0.268) | TCGA-J2-A4AD-01 | Lung | lung adenocarcinoma | Female | <65 | I/II | Unknown | Unknown | PD |
| Page: 1 2 |
Top |
Related drugs of malignant transformation related genes |
| Identification of chemicals and drugs interact with genes involved in malignant transfromation |
| (DGIdb 4.0) |
| Entrez ID | Symbol | Category | Interaction Types | Drug Claim Name | Drug Name | PMIDs |
| Page: 1 |

Copyright 2023-Present -The University of Texas Health Science Center at Houston |