
|
|||||
|
 | |
| |
| |
| |
| |
| |
|
Gene: TMEM50A |
Gene summary for TMEM50A |
| Gene information | Species | Human | Gene symbol | TMEM50A | Gene ID | 23585 |
| Gene name | transmembrane protein 50A | |
| Gene Alias | IFNRC | |
| Cytomap | 1p36.11 | |
| Gene Type | protein-coding | GO ID | GO:0006810 | UniProtAcc | O95807 |
Top |
Malignant transformation analysis |
| Identification of the aberrant gene expression in precancerous and cancerous lesions by comparing the gene expression of stem-like cells in diseased tissues with normal stem cells |
| Entrez ID | Symbol | Replicates | Species | Organ | Tissue | Adj P-value | Log2FC | Malignancy |
| 23585 | TMEM50A | GSM4909285 | Human | Breast | IDC | 2.50e-02 | -6.77e-02 | 0.21 |
| 23585 | TMEM50A | GSM4909286 | Human | Breast | IDC | 5.27e-10 | -2.48e-01 | 0.1081 |
| 23585 | TMEM50A | GSM4909288 | Human | Breast | IDC | 1.18e-02 | -2.95e-01 | 0.0988 |
| 23585 | TMEM50A | GSM4909293 | Human | Breast | IDC | 8.20e-07 | -1.70e-01 | 0.1581 |
| 23585 | TMEM50A | GSM4909294 | Human | Breast | IDC | 1.94e-11 | -3.87e-01 | 0.2022 |
| 23585 | TMEM50A | GSM4909296 | Human | Breast | IDC | 5.02e-16 | -2.97e-01 | 0.1524 |
| 23585 | TMEM50A | GSM4909297 | Human | Breast | IDC | 1.37e-18 | -2.92e-01 | 0.1517 |
| 23585 | TMEM50A | GSM4909298 | Human | Breast | IDC | 2.86e-07 | -2.29e-01 | 0.1551 |
| 23585 | TMEM50A | GSM4909301 | Human | Breast | IDC | 2.37e-06 | -2.00e-01 | 0.1577 |
| 23585 | TMEM50A | GSM4909302 | Human | Breast | IDC | 1.40e-08 | -3.41e-01 | 0.1545 |
| 23585 | TMEM50A | GSM4909304 | Human | Breast | IDC | 4.55e-02 | -1.48e-01 | 0.1636 |
| 23585 | TMEM50A | GSM4909309 | Human | Breast | IDC | 3.88e-04 | -1.64e-01 | 0.0483 |
| 23585 | TMEM50A | GSM4909311 | Human | Breast | IDC | 1.91e-44 | -5.58e-01 | 0.1534 |
| 23585 | TMEM50A | GSM4909312 | Human | Breast | IDC | 3.11e-22 | -3.86e-01 | 0.1552 |
| 23585 | TMEM50A | GSM4909313 | Human | Breast | IDC | 1.28e-06 | -1.82e-01 | 0.0391 |
| 23585 | TMEM50A | GSM4909316 | Human | Breast | IDC | 1.64e-04 | -4.04e-01 | 0.21 |
| 23585 | TMEM50A | GSM4909318 | Human | Breast | IDC | 4.79e-03 | -5.07e-01 | 0.2031 |
| 23585 | TMEM50A | GSM4909319 | Human | Breast | IDC | 1.26e-61 | -5.89e-01 | 0.1563 |
| 23585 | TMEM50A | GSM4909320 | Human | Breast | IDC | 1.50e-07 | -3.53e-01 | 0.1575 |
| 23585 | TMEM50A | GSM4909321 | Human | Breast | IDC | 8.78e-17 | -2.16e-01 | 0.1559 |
| Page: 1 2 3 4 5 6 7 8 9 10 11 |
| Tissue | Expression Dynamics | Abbreviation |
| Breast | 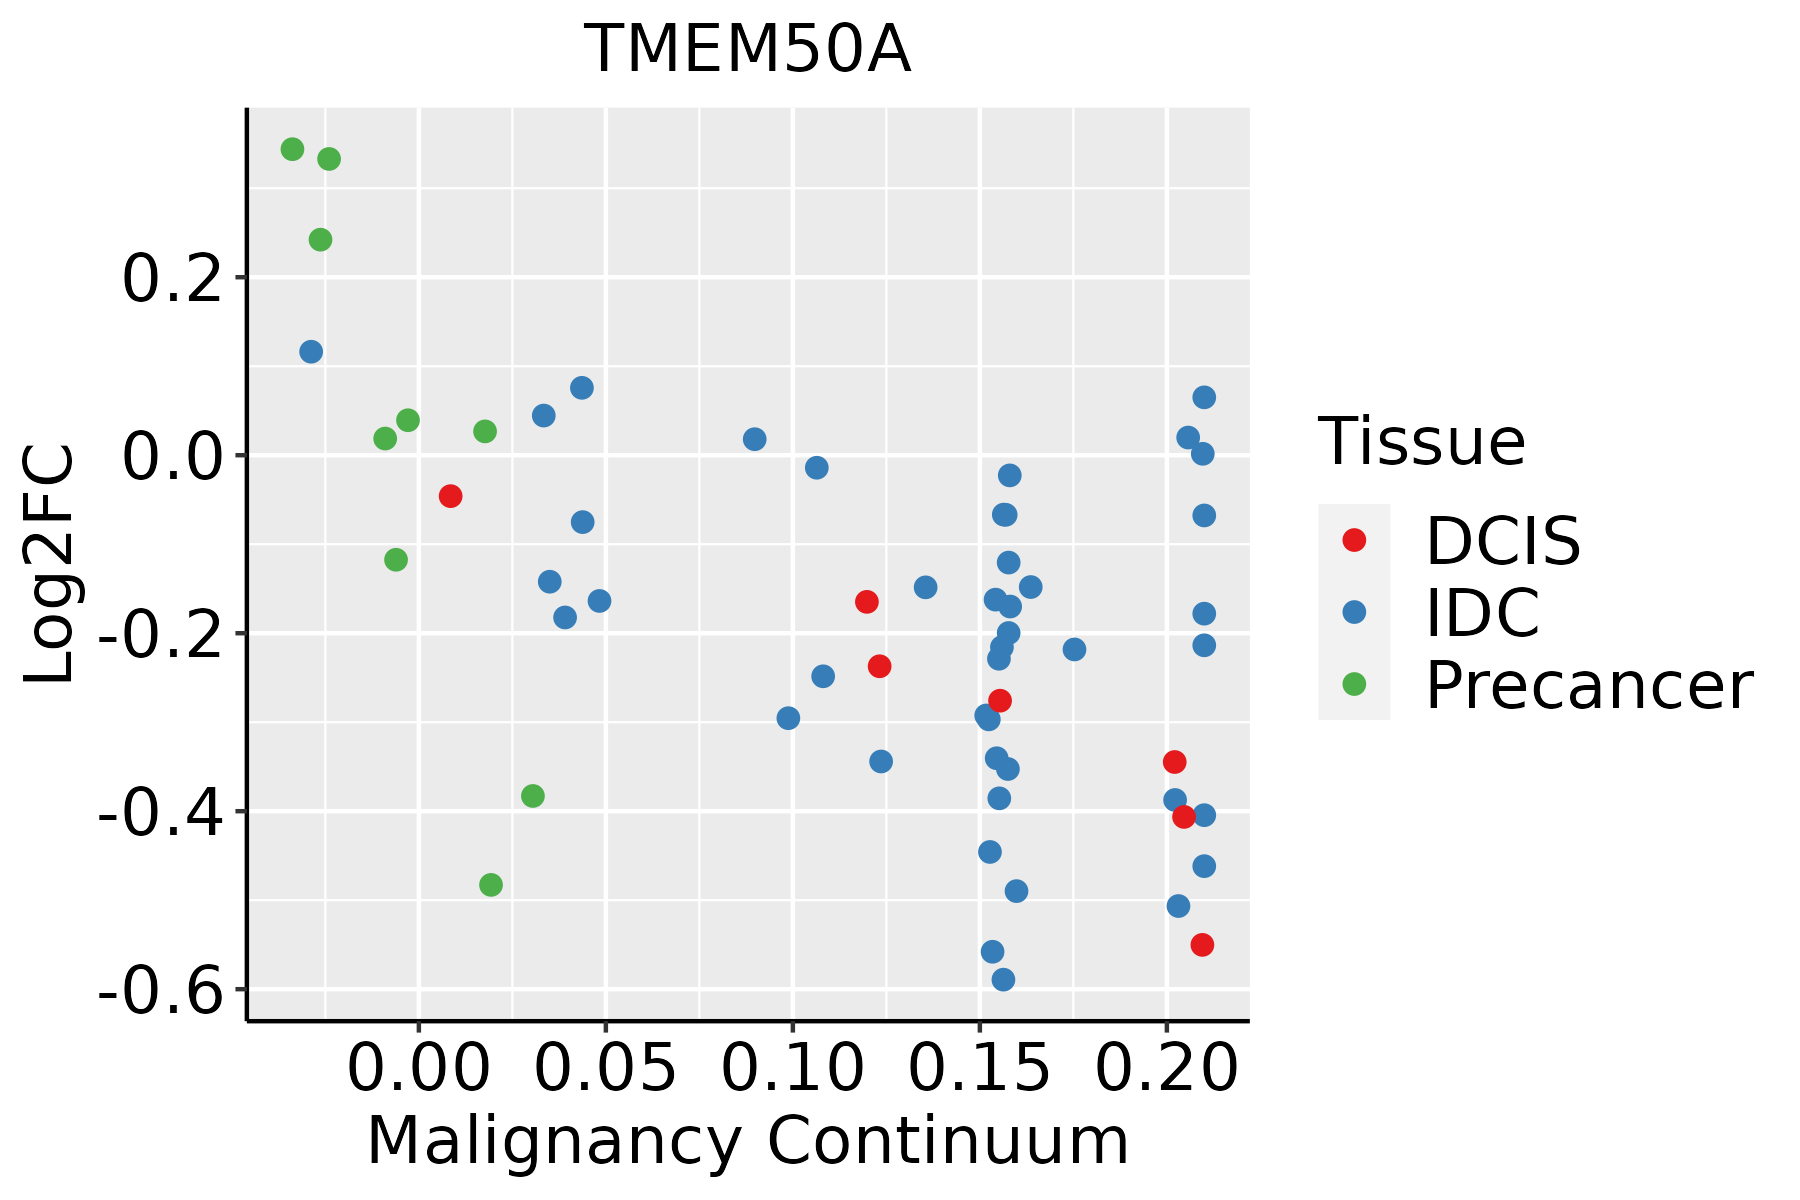 | IDC: Invasive ductal carcinoma |
| DCIS: Ductal carcinoma in situ | ||
| Precancer(BRCA1-mut): Precancerous lesion from BRCA1 mutation carriers | ||
| Cervix | 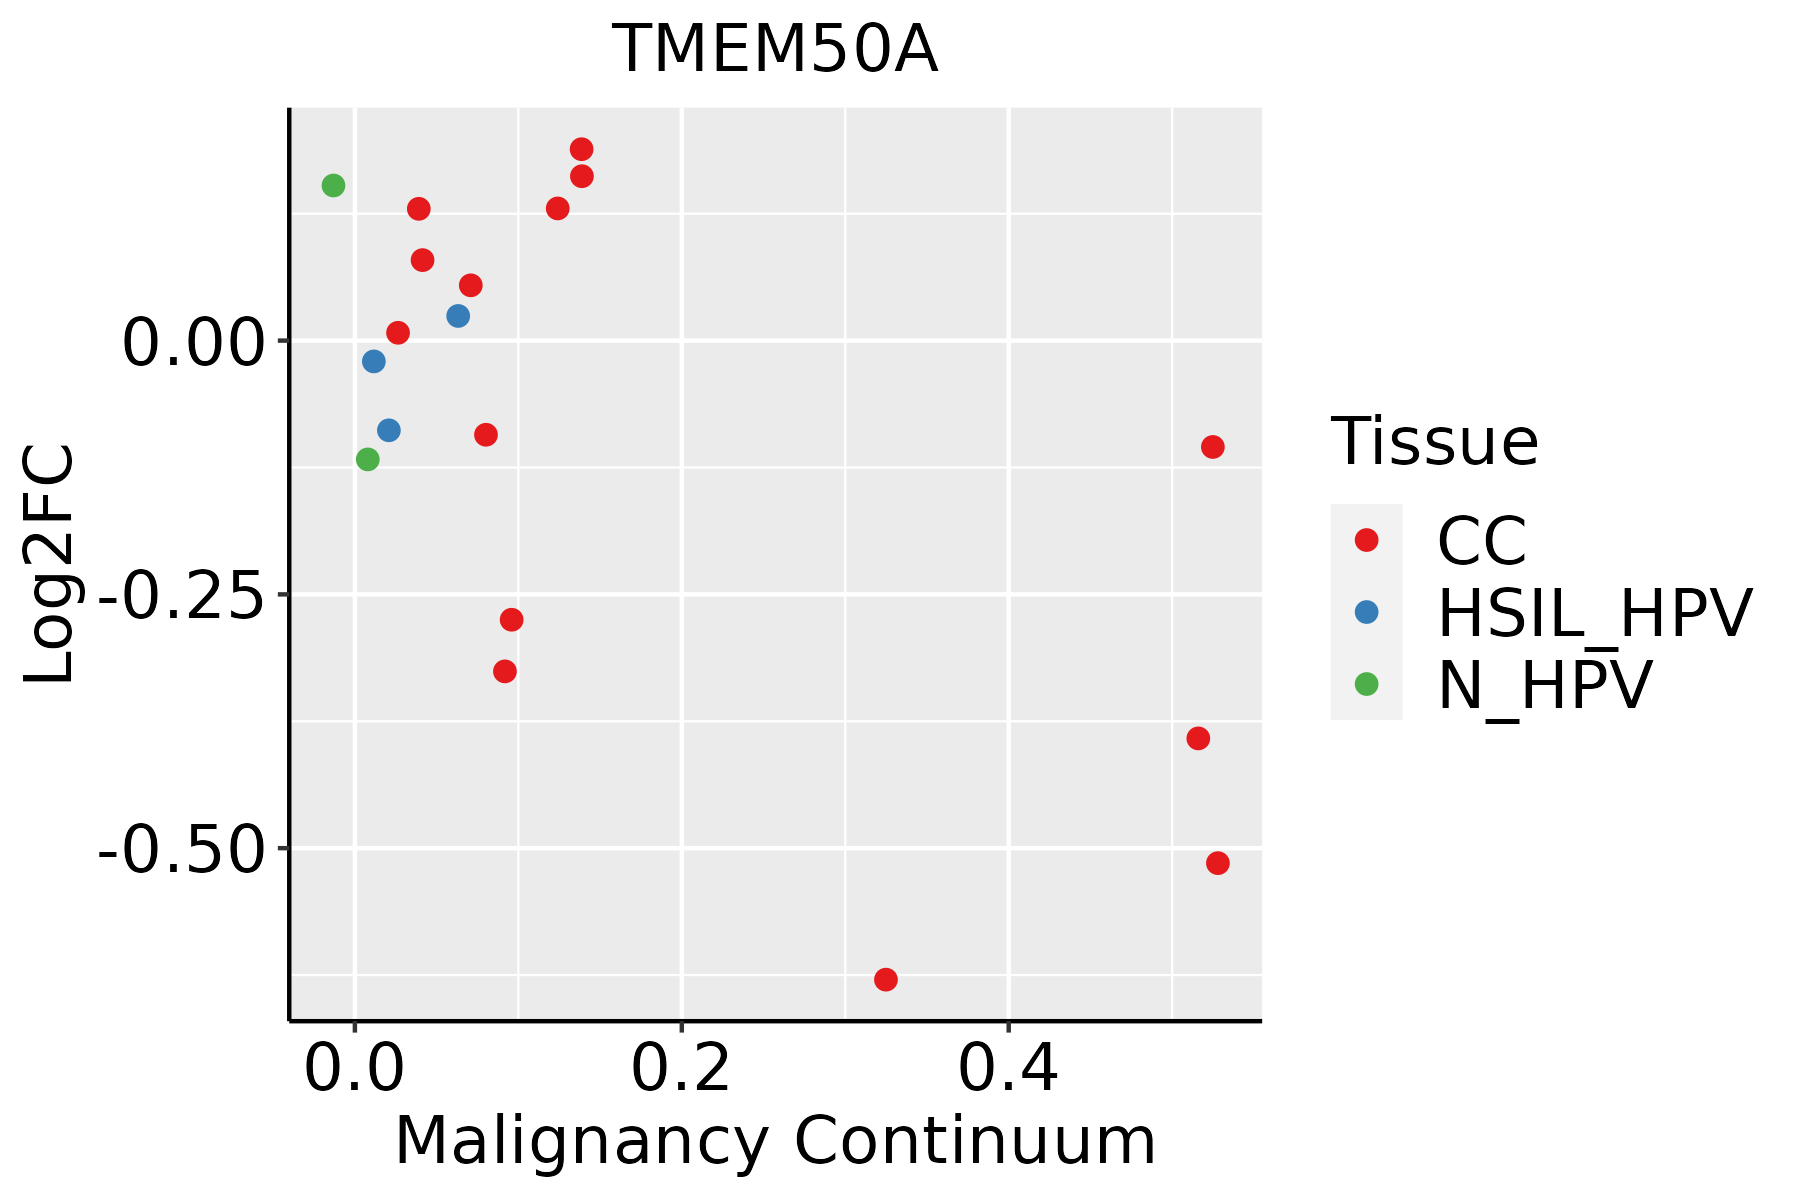 | CC: Cervix cancer |
| HSIL_HPV: HPV-infected high-grade squamous intraepithelial lesions | ||
| N_HPV: HPV-infected normal cervix | ||
| Endometrium | 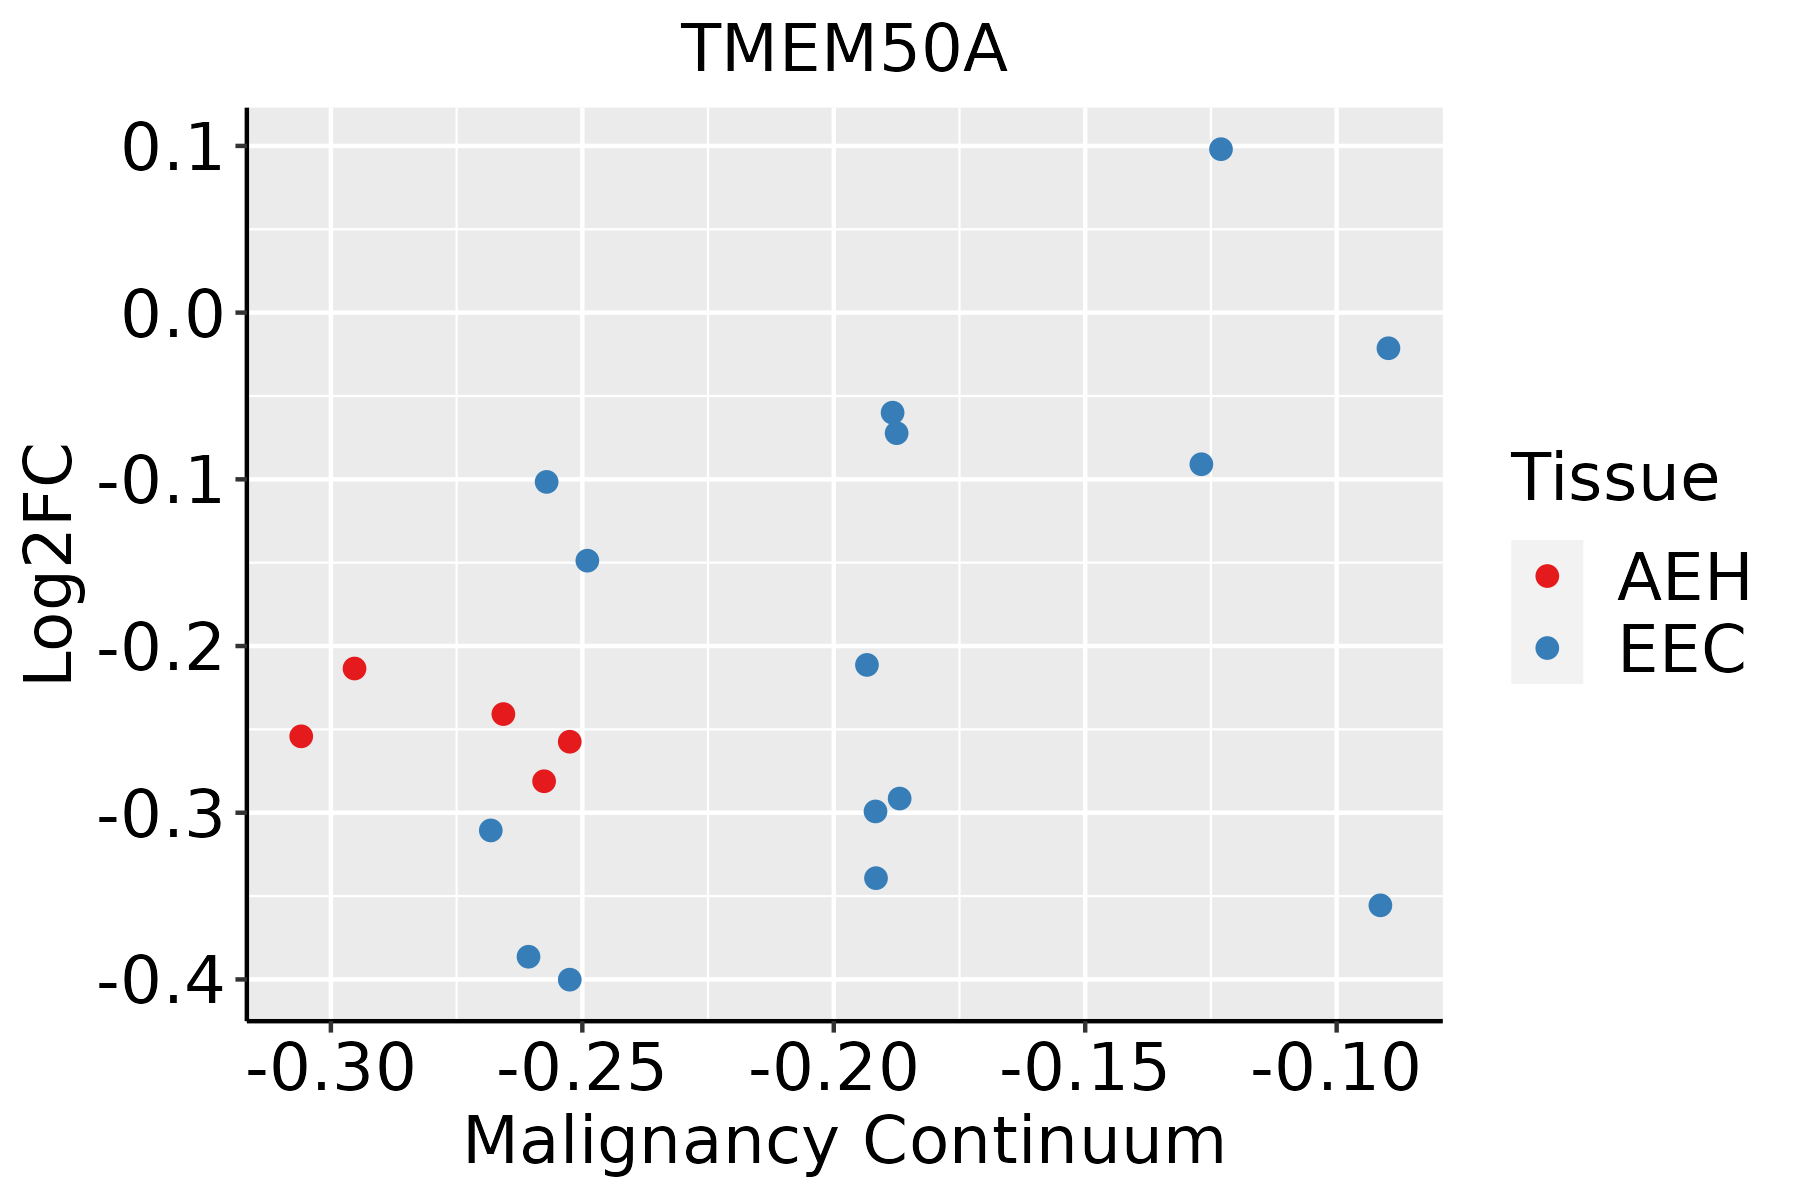 | AEH: Atypical endometrial hyperplasia |
| EEC: Endometrioid Cancer | ||
| Esophagus | 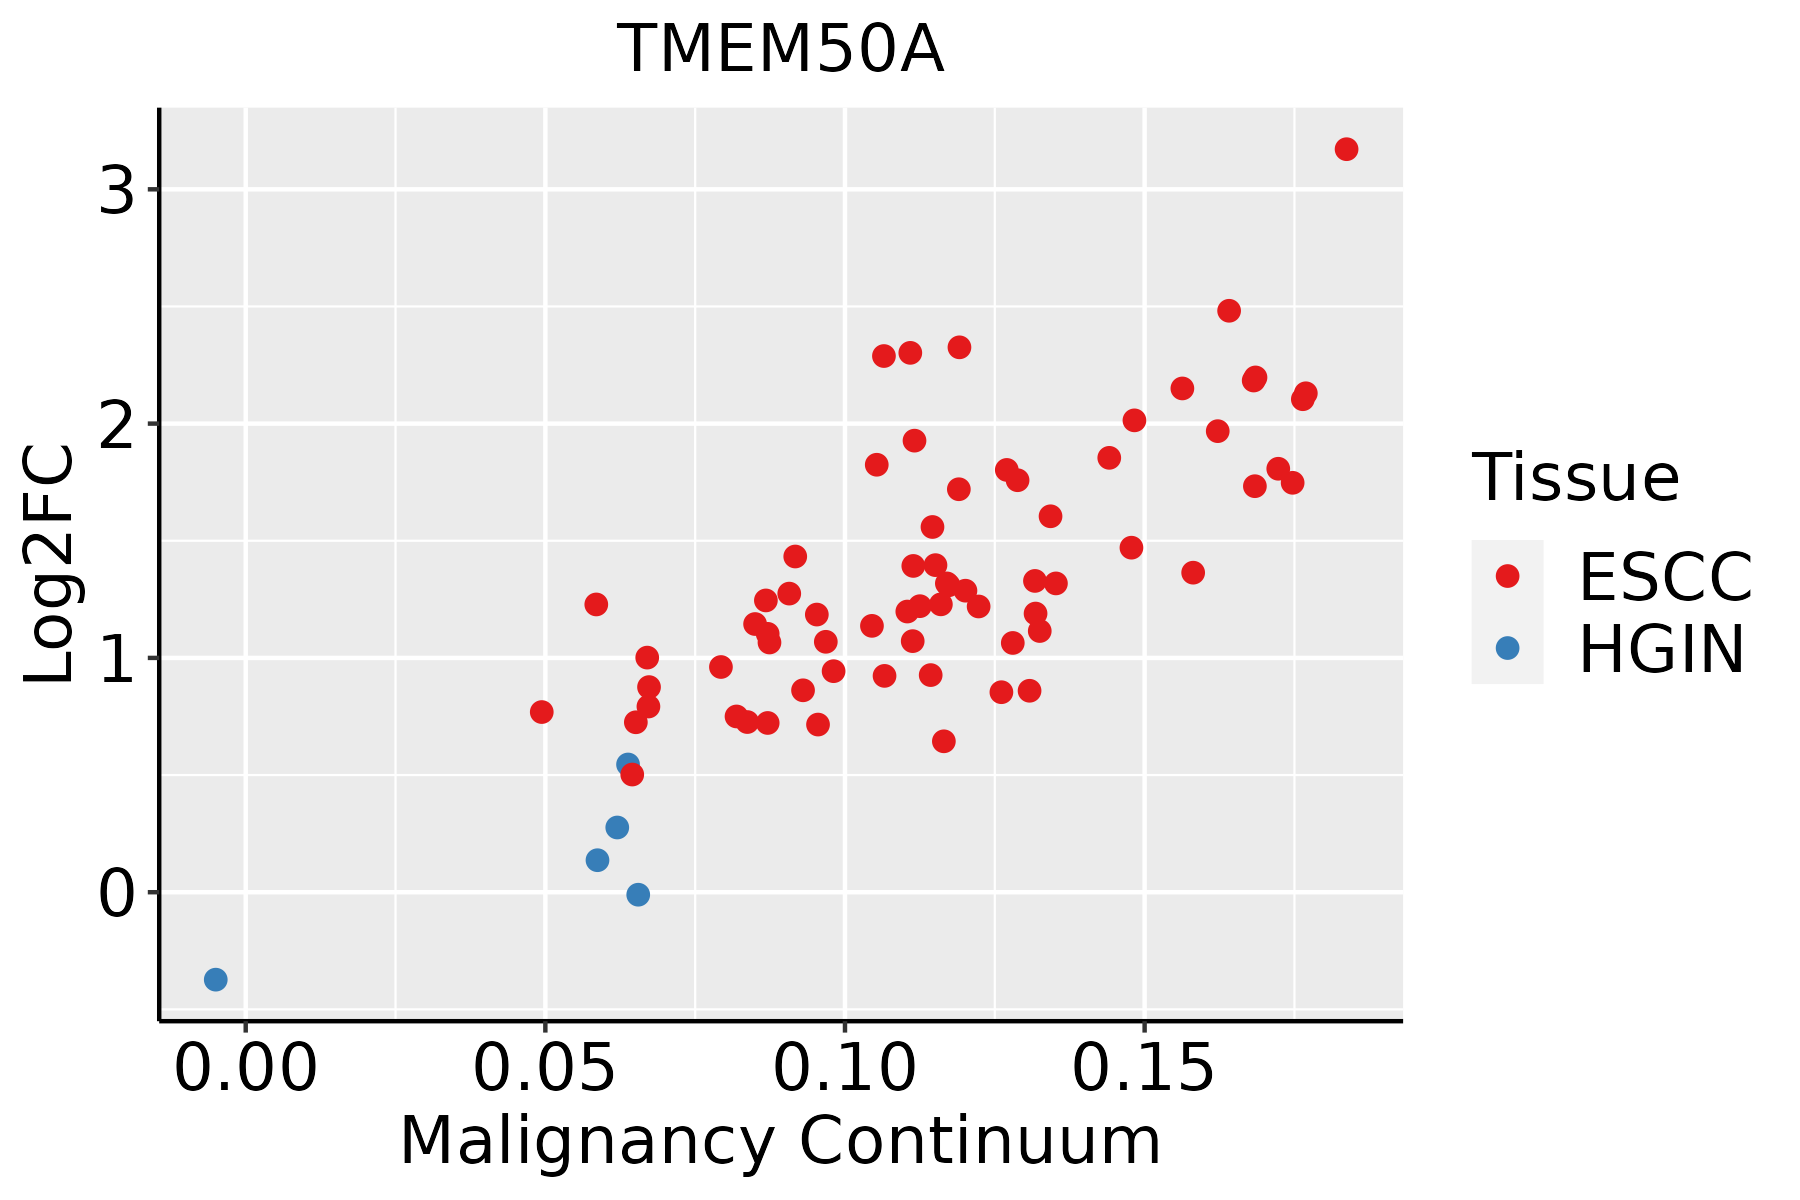 | ESCC: Esophageal squamous cell carcinoma |
| HGIN: High-grade intraepithelial neoplasias | ||
| LGIN: Low-grade intraepithelial neoplasias | ||
| Liver | 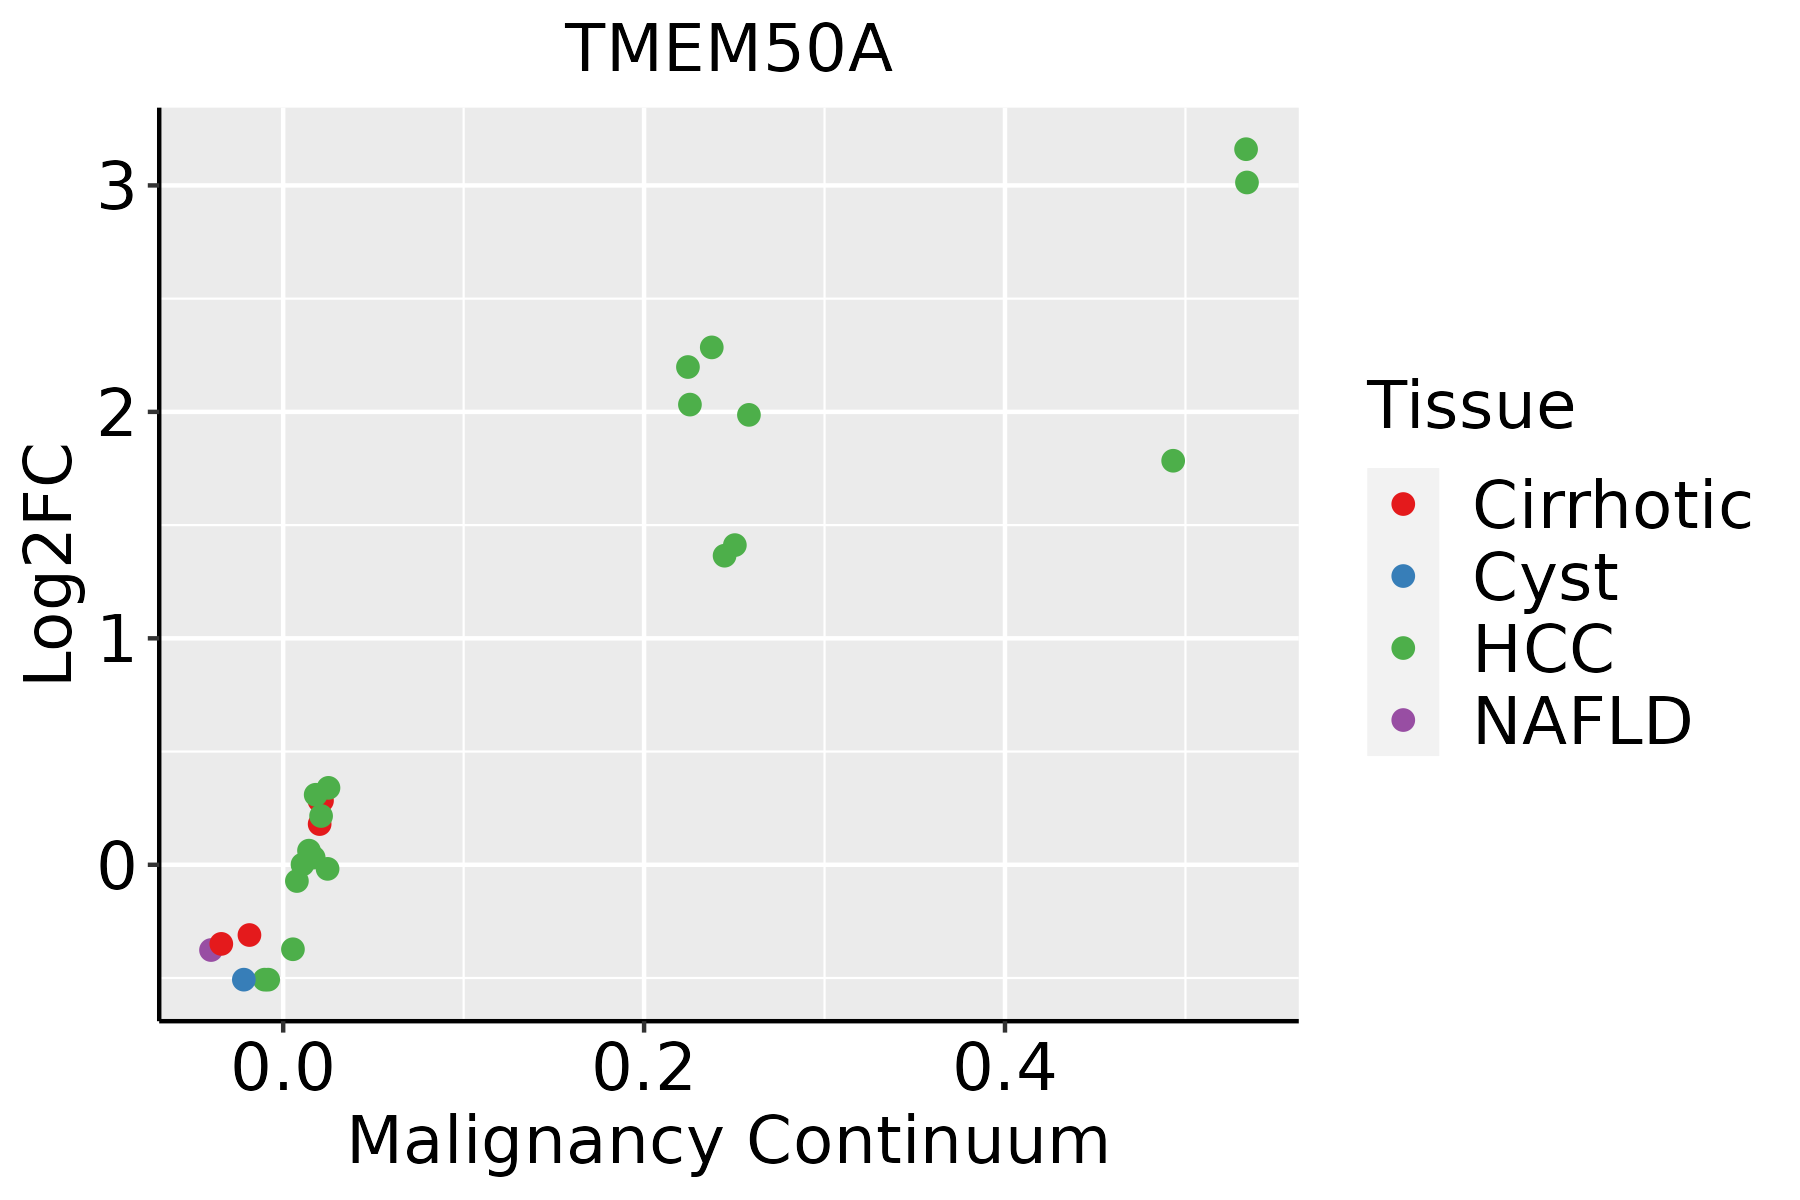 | HCC: Hepatocellular carcinoma |
| NAFLD: Non-alcoholic fatty liver disease | ||
| Oral Cavity | 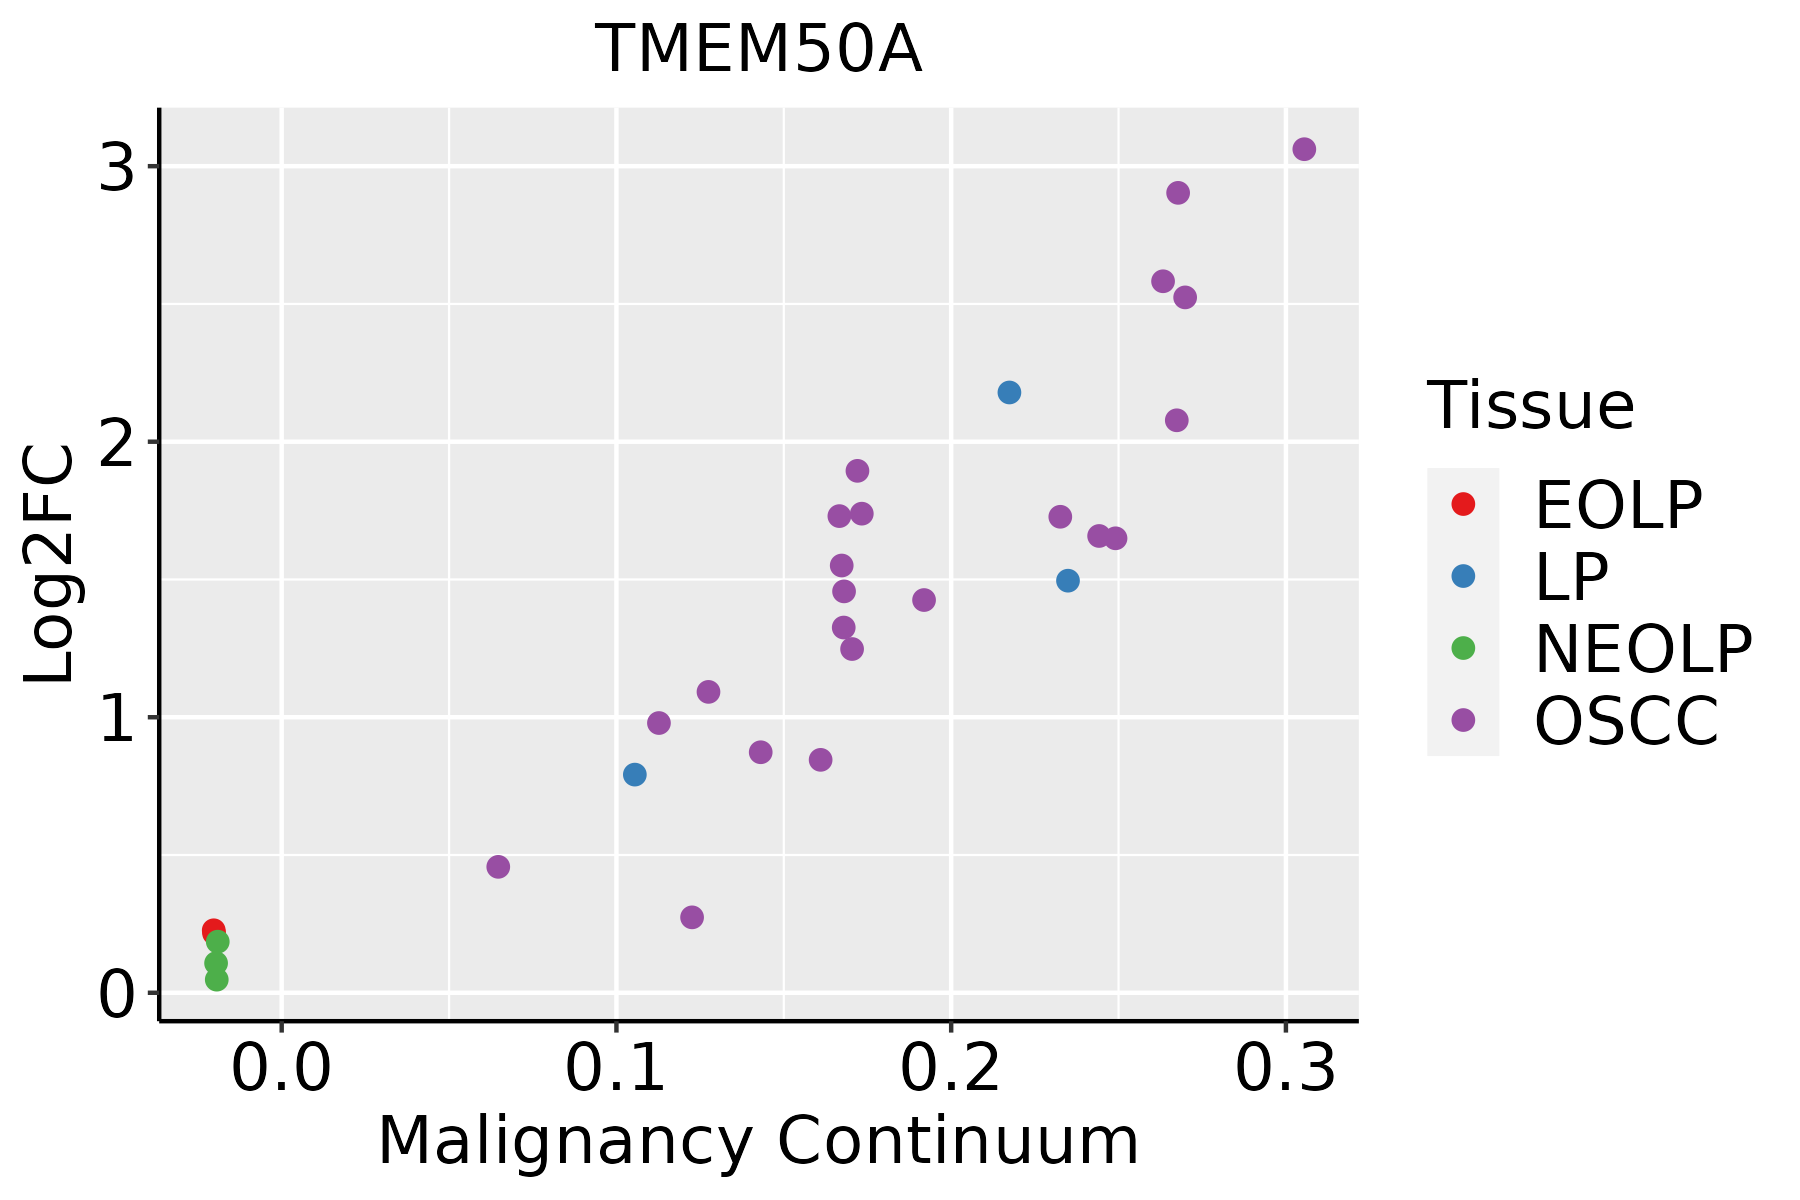 | EOLP: Erosive Oral lichen planus |
| LP: leukoplakia | ||
| NEOLP: Non-erosive oral lichen planus | ||
| OSCC: Oral squamous cell carcinoma | ||
| Prostate | 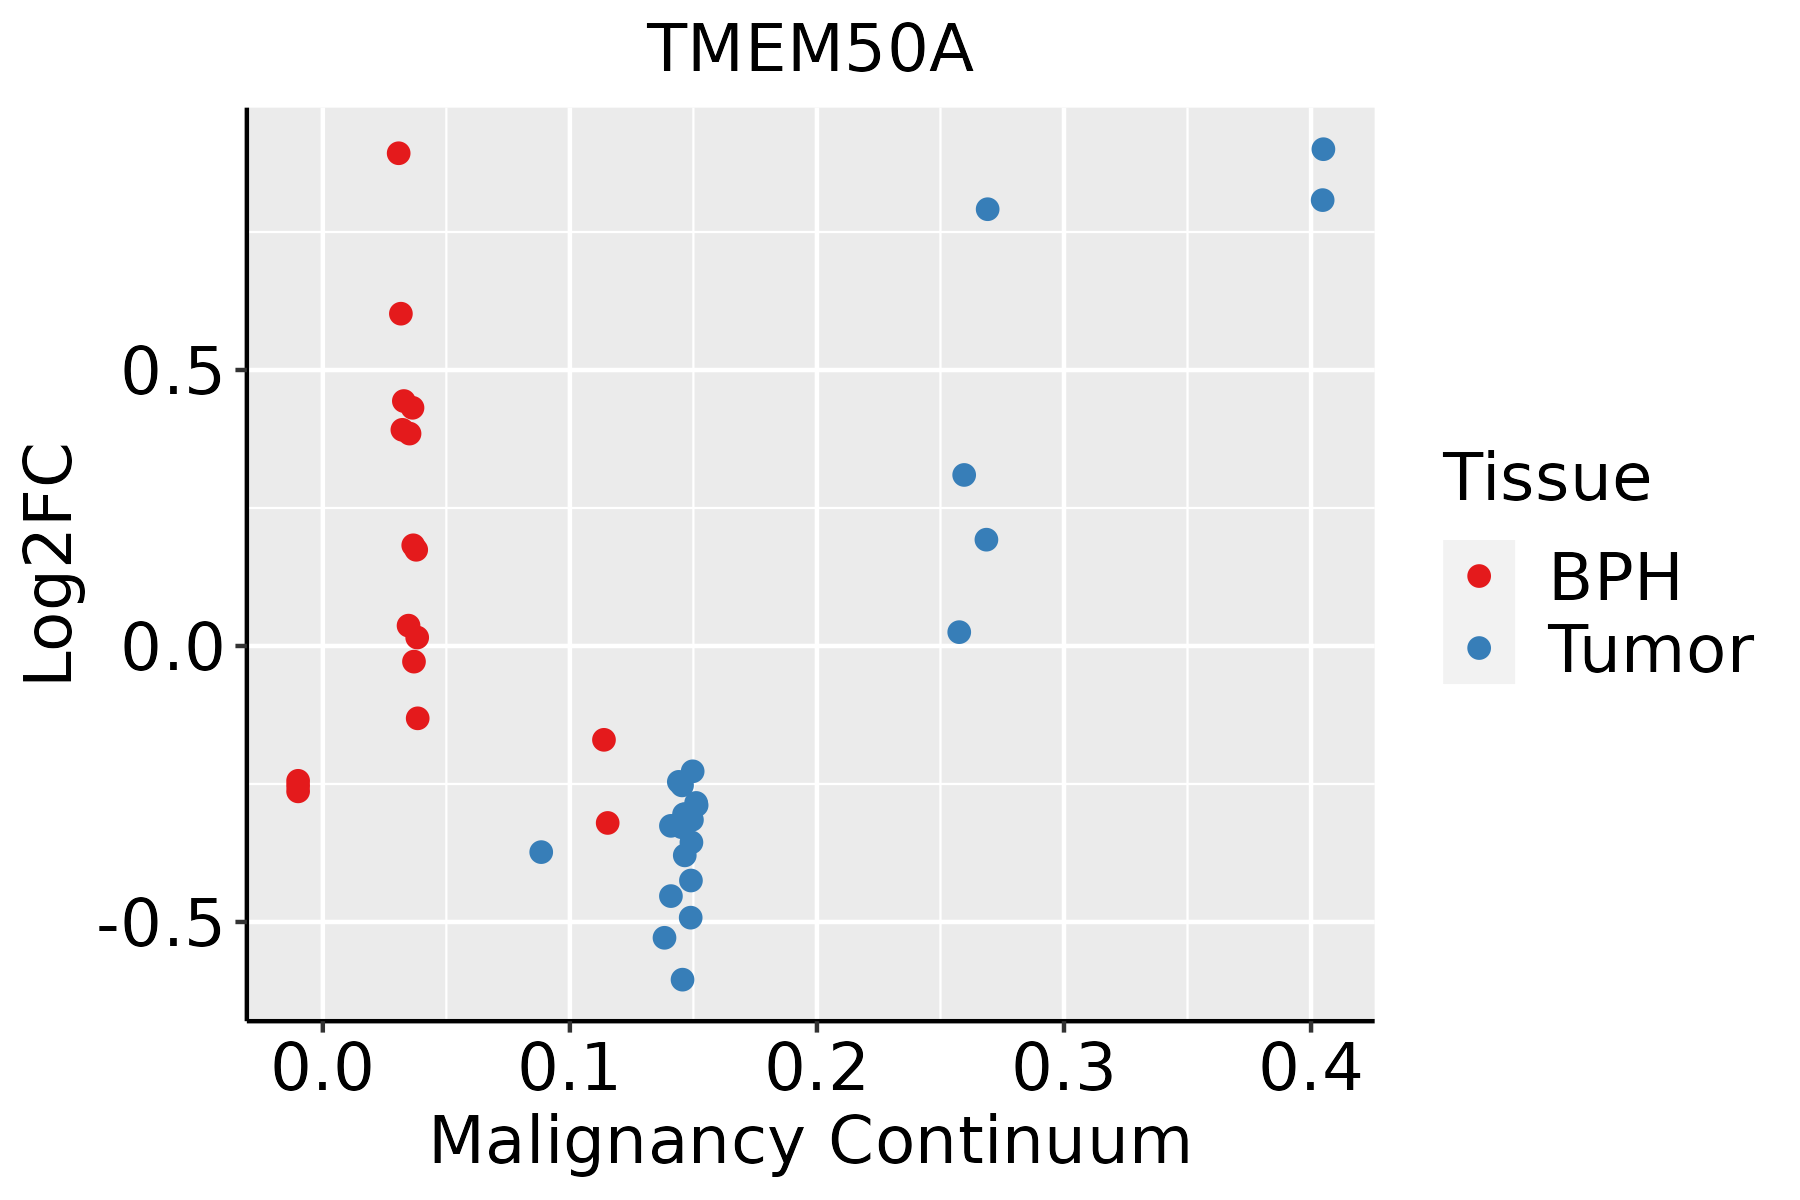 | BPH: Benign Prostatic Hyperplasia |
| Skin | 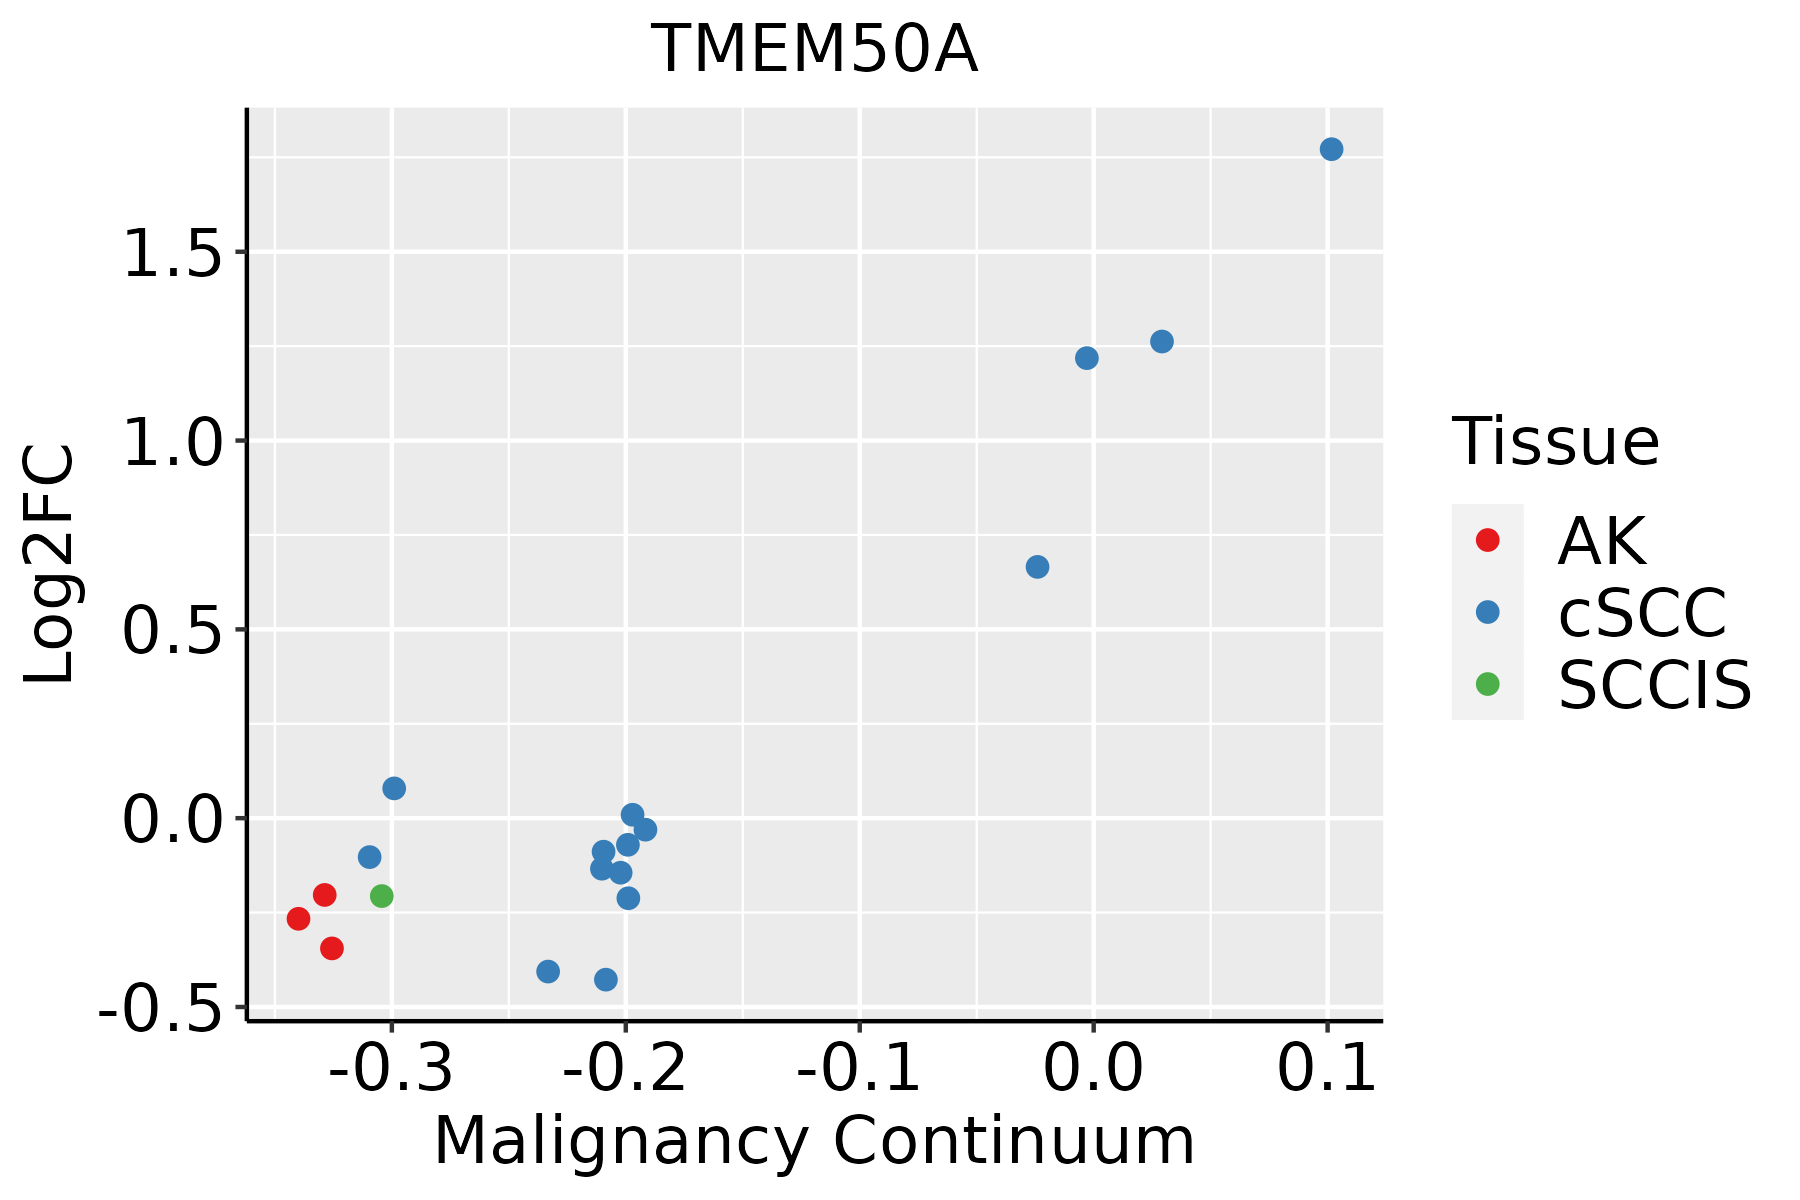 | AK: Actinic keratosis |
| cSCC: Cutaneous squamous cell carcinoma | ||
| SCCIS:squamous cell carcinoma in situ | ||
| Thyroid |  | ATC: Anaplastic thyroid cancer |
| HT: Hashimoto's thyroiditis | ||
| PTC: Papillary thyroid cancer |
| ∗log2FC in expression of this searched gene in stem-like cells from each diseased tissue sample relative to stem-like cells in normal samples in each tissue plotted against the malignancy continuum. Samples are colored based on if they are from different disease stage. |
Top |
Malignant transformation related pathway analysis |
| Find out the enriched GO biological processes and KEGG pathways involved in transition from healthy to precancer to cancer |
| Tissue | Disease Stage | Enriched GO biological Processes |
| Colorectum | AD |  |
| Colorectum | SER |  |
| Colorectum | MSS |  |
| Colorectum | MSI-H |  |
| Colorectum | FAP |  |
| ∗Top 15 enriched GO BP terms are showed in the bar plot of each disease state in each tissue. Each row represents a significant GO biological process which is colored according to the -log10(p.adjust). |
| Page: 1 2 3 4 5 6 7 8 9 |
| GO ID | Tissue | Disease Stage | Description | Gene Ratio | Bg Ratio | pvalue | p.adjust | Count |
| GO:00161977 | Cervix | CC | endosomal transport | 48/2311 | 230/18723 | 1.65e-04 | 1.97e-03 | 48 |
| GO:00070347 | Cervix | CC | vacuolar transport | 34/2311 | 157/18723 | 7.03e-04 | 6.40e-03 | 34 |
| GO:00070348 | Endometrium | AEH | vacuolar transport | 29/2100 | 157/18723 | 4.69e-03 | 2.99e-02 | 29 |
| GO:00325094 | Endometrium | AEH | endosome transport via multivesicular body sorting pathway | 9/2100 | 31/18723 | 5.59e-03 | 3.44e-02 | 9 |
| GO:003250912 | Endometrium | EEC | endosome transport via multivesicular body sorting pathway | 9/2168 | 31/18723 | 6.90e-03 | 3.98e-02 | 9 |
| GO:000703413 | Endometrium | EEC | vacuolar transport | 29/2168 | 157/18723 | 7.29e-03 | 4.15e-02 | 29 |
| GO:001619710 | Esophagus | HGIN | endosomal transport | 57/2587 | 230/18723 | 5.74e-06 | 1.81e-04 | 57 |
| GO:00719856 | Esophagus | HGIN | multivesicular body sorting pathway | 13/2587 | 37/18723 | 9.03e-04 | 1.15e-02 | 13 |
| GO:00325097 | Esophagus | HGIN | endosome transport via multivesicular body sorting pathway | 11/2587 | 31/18723 | 2.02e-03 | 2.12e-02 | 11 |
| GO:000703416 | Esophagus | HGIN | vacuolar transport | 35/2587 | 157/18723 | 2.52e-03 | 2.51e-02 | 35 |
| GO:001619715 | Esophagus | ESCC | endosomal transport | 168/8552 | 230/18723 | 2.28e-17 | 1.93e-15 | 168 |
| GO:000703417 | Esophagus | ESCC | vacuolar transport | 119/8552 | 157/18723 | 1.16e-14 | 6.30e-13 | 119 |
| GO:007198514 | Esophagus | ESCC | multivesicular body sorting pathway | 34/8552 | 37/18723 | 3.49e-09 | 7.39e-08 | 34 |
| GO:003250915 | Esophagus | ESCC | endosome transport via multivesicular body sorting pathway | 29/8552 | 31/18723 | 1.92e-08 | 3.72e-07 | 29 |
| GO:00453245 | Esophagus | ESCC | late endosome to vacuole transport | 23/8552 | 25/18723 | 1.39e-06 | 1.69e-05 | 23 |
| GO:00325113 | Esophagus | ESCC | late endosome to vacuole transport via multivesicular body sorting pathway | 16/8552 | 17/18723 | 3.46e-05 | 2.82e-04 | 16 |
| GO:000703411 | Liver | Cirrhotic | vacuolar transport | 75/4634 | 157/18723 | 3.13e-10 | 1.53e-08 | 75 |
| GO:00325093 | Liver | Cirrhotic | endosome transport via multivesicular body sorting pathway | 24/4634 | 31/18723 | 1.06e-09 | 4.76e-08 | 24 |
| GO:00719853 | Liver | Cirrhotic | multivesicular body sorting pathway | 25/4634 | 37/18723 | 4.79e-08 | 1.52e-06 | 25 |
| GO:001619711 | Liver | Cirrhotic | endosomal transport | 93/4634 | 230/18723 | 1.01e-07 | 2.93e-06 | 93 |
| Page: 1 2 3 4 |
| Pathway ID | Tissue | Disease Stage | Description | Gene Ratio | Bg Ratio | pvalue | p.adjust | qvalue | Count |
| Page: 1 |
Top |
Cell-cell communication analysis |
| Identification of potential cell-cell interactions between two cell types and their ligand-receptor pairs for different disease states |
| Ligand | Receptor | LRpair | Pathway | Tissue | Disease Stage |
| Page: 1 |
Top |
Single-cell gene regulatory network inference analysis |
| Find out the significant the regulons (TFs) and the target genes of each regulon across cell types for different disease states |
| TF | Cell Type | Tissue | Disease Stage | Target Gene | RSS | Regulon Activity |
| ∗The dot plots of a searched regulon are shown for all cell subpopulations in each disease state of each tissue based on the regulon specific score inferred using pySCENIC and by calculating the average expression. |
| Page: 1 |
Top |
Somatic mutation of malignant transformation related genes |
| Annotation of somatic variants for genes involved in malignant transformation |
| Hugo Symbol | Variant Class | Variant Classification | dbSNP RS | HGVSc | HGVSp | HGVSp Short | SWISSPROT | BIOTYPE | SIFT | PolyPhen | Tumor Sample Barcode | Tissue | Histology | Sex | Age | Stage | Therapy Types | Drugs | Outcome |
| TMEM50A | SNV | Missense_Mutation | c.32N>T | p.Ser11Leu | p.S11L | O95807 | protein_coding | tolerated(0.27) | benign(0.315) | TCGA-BH-A0AW-01 | Breast | breast invasive carcinoma | Female | <65 | I/II | Chemotherapy | carboplatin | SD | |
| TMEM50A | deletion | Frame_Shift_Del | c.47delN | p.Glu18LysfsTer23 | p.E18Kfs*23 | O95807 | protein_coding | TCGA-A8-A09Z-01 | Breast | breast invasive carcinoma | Female | >=65 | I/II | Unknown | Unknown | SD | |||
| TMEM50A | SNV | Missense_Mutation | c.58N>T | p.Arg20Cys | p.R20C | O95807 | protein_coding | deleterious(0) | probably_damaging(1) | TCGA-AA-A010-01 | Colorectum | colon adenocarcinoma | Female | <65 | I/II | Chemotherapy | folinic | CR | |
| TMEM50A | SNV | Missense_Mutation | c.262N>A | p.Leu88Met | p.L88M | O95807 | protein_coding | tolerated(0.14) | benign(0.284) | TCGA-AA-A010-01 | Colorectum | colon adenocarcinoma | Female | <65 | I/II | Chemotherapy | folinic | CR | |
| TMEM50A | SNV | Missense_Mutation | c.124G>A | p.Ala42Thr | p.A42T | O95807 | protein_coding | tolerated(0.22) | possibly_damaging(0.531) | TCGA-CM-4743-01 | Colorectum | colon adenocarcinoma | Male | >=65 | I/II | Chemotherapy | capecitabine | SD | |
| TMEM50A | SNV | Missense_Mutation | novel | c.373G>T | p.Asp125Tyr | p.D125Y | O95807 | protein_coding | deleterious(0.05) | benign(0.167) | TCGA-F5-6814-01 | Colorectum | rectum adenocarcinoma | Male | <65 | I/II | Unknown | Unknown | SD |
| TMEM50A | SNV | Missense_Mutation | rs774445401 | c.281N>A | p.Arg94His | p.R94H | O95807 | protein_coding | deleterious(0) | probably_damaging(0.977) | TCGA-A5-A0G2-01 | Endometrium | uterine corpus endometrioid carcinoma | Female | <65 | III/IV | Unknown | Unknown | SD |
| TMEM50A | SNV | Missense_Mutation | novel | c.467N>T | p.Trp156Leu | p.W156L | O95807 | protein_coding | deleterious(0) | probably_damaging(0.965) | TCGA-A5-A0G2-01 | Endometrium | uterine corpus endometrioid carcinoma | Female | <65 | III/IV | Unknown | Unknown | SD |
| TMEM50A | SNV | Missense_Mutation | novel | c.62N>C | p.Asn21Thr | p.N21T | O95807 | protein_coding | deleterious(0) | probably_damaging(1) | TCGA-AJ-A3EL-01 | Endometrium | uterine corpus endometrioid carcinoma | Female | <65 | I/II | Unknown | Unknown | SD |
| TMEM50A | SNV | Missense_Mutation | novel | c.265N>T | p.Gly89Cys | p.G89C | O95807 | protein_coding | deleterious(0) | probably_damaging(1) | TCGA-AX-A1C4-01 | Endometrium | uterine corpus endometrioid carcinoma | Female | <65 | I/II | Unknown | Unknown | SD |
| Page: 1 2 |
Top |
Related drugs of malignant transformation related genes |
| Identification of chemicals and drugs interact with genes involved in malignant transfromation |
| (DGIdb 4.0) |
| Entrez ID | Symbol | Category | Interaction Types | Drug Claim Name | Drug Name | PMIDs |
| Page: 1 |

Copyright 2023-Present -The University of Texas Health Science Center at Houston |