
|
|||||
|
 | |
| |
| |
| |
| |
| |
|
Gene: TMEM45B |
Gene summary for TMEM45B |
| Gene information | Species | Human | Gene symbol | TMEM45B | Gene ID | 120224 |
| Gene name | transmembrane protein 45B | |
| Gene Alias | TMEM45B | |
| Cytomap | 11q24.3 | |
| Gene Type | protein-coding | GO ID | GO:0005575 | UniProtAcc | Q96B21 |
Top |
Malignant transformation analysis |
| Identification of the aberrant gene expression in precancerous and cancerous lesions by comparing the gene expression of stem-like cells in diseased tissues with normal stem cells |
| Entrez ID | Symbol | Replicates | Species | Organ | Tissue | Adj P-value | Log2FC | Malignancy |
| 120224 | TMEM45B | HTA11_3410_2000001011 | Human | Colorectum | AD | 3.52e-10 | -4.87e-01 | 0.0155 |
| 120224 | TMEM45B | HTA11_2487_2000001011 | Human | Colorectum | SER | 1.40e-05 | 5.82e-01 | -0.1808 |
| 120224 | TMEM45B | HTA11_347_2000001011 | Human | Colorectum | AD | 3.02e-24 | 1.03e+00 | -0.1954 |
| 120224 | TMEM45B | HTA11_411_2000001011 | Human | Colorectum | SER | 2.59e-06 | 1.17e+00 | -0.2602 |
| 120224 | TMEM45B | HTA11_2112_2000001011 | Human | Colorectum | SER | 1.64e-06 | 8.06e-01 | -0.2196 |
| 120224 | TMEM45B | HTA11_83_2000001011 | Human | Colorectum | SER | 3.15e-03 | 5.60e-01 | -0.1526 |
| 120224 | TMEM45B | HTA11_5212_2000001011 | Human | Colorectum | AD | 1.85e-03 | 6.02e-01 | -0.2061 |
| 120224 | TMEM45B | HTA11_866_3004761011 | Human | Colorectum | AD | 1.39e-04 | -2.91e-01 | 0.096 |
| 120224 | TMEM45B | HTA11_10711_2000001011 | Human | Colorectum | AD | 5.11e-03 | -4.08e-01 | 0.0338 |
| 120224 | TMEM45B | HTA11_7696_3000711011 | Human | Colorectum | AD | 3.03e-11 | -3.87e-01 | 0.0674 |
| 120224 | TMEM45B | HTA11_6818_2000001021 | Human | Colorectum | AD | 3.45e-03 | -3.48e-01 | 0.0588 |
| 120224 | TMEM45B | HTA11_99999974143_84620 | Human | Colorectum | MSS | 5.87e-06 | -3.75e-01 | 0.3005 |
| 120224 | TMEM45B | F007 | Human | Colorectum | FAP | 1.38e-02 | -3.21e-01 | 0.1176 |
| 120224 | TMEM45B | A002-C-010 | Human | Colorectum | FAP | 1.24e-04 | -3.34e-01 | 0.242 |
| 120224 | TMEM45B | A001-C-207 | Human | Colorectum | FAP | 6.58e-05 | -3.06e-01 | 0.1278 |
| 120224 | TMEM45B | A015-C-203 | Human | Colorectum | FAP | 4.01e-34 | -5.19e-01 | -0.1294 |
| 120224 | TMEM45B | A015-C-204 | Human | Colorectum | FAP | 5.43e-07 | -2.63e-01 | -0.0228 |
| 120224 | TMEM45B | A014-C-040 | Human | Colorectum | FAP | 7.71e-05 | -4.34e-01 | -0.1184 |
| 120224 | TMEM45B | A002-C-201 | Human | Colorectum | FAP | 1.38e-15 | -4.13e-01 | 0.0324 |
| 120224 | TMEM45B | A002-C-203 | Human | Colorectum | FAP | 1.11e-04 | -1.78e-01 | 0.2786 |
| Page: 1 2 3 4 5 |
| Tissue | Expression Dynamics | Abbreviation |
| Colorectum (GSE201348) |  | FAP: Familial adenomatous polyposis |
| CRC: Colorectal cancer | ||
| Colorectum (HTA11) | 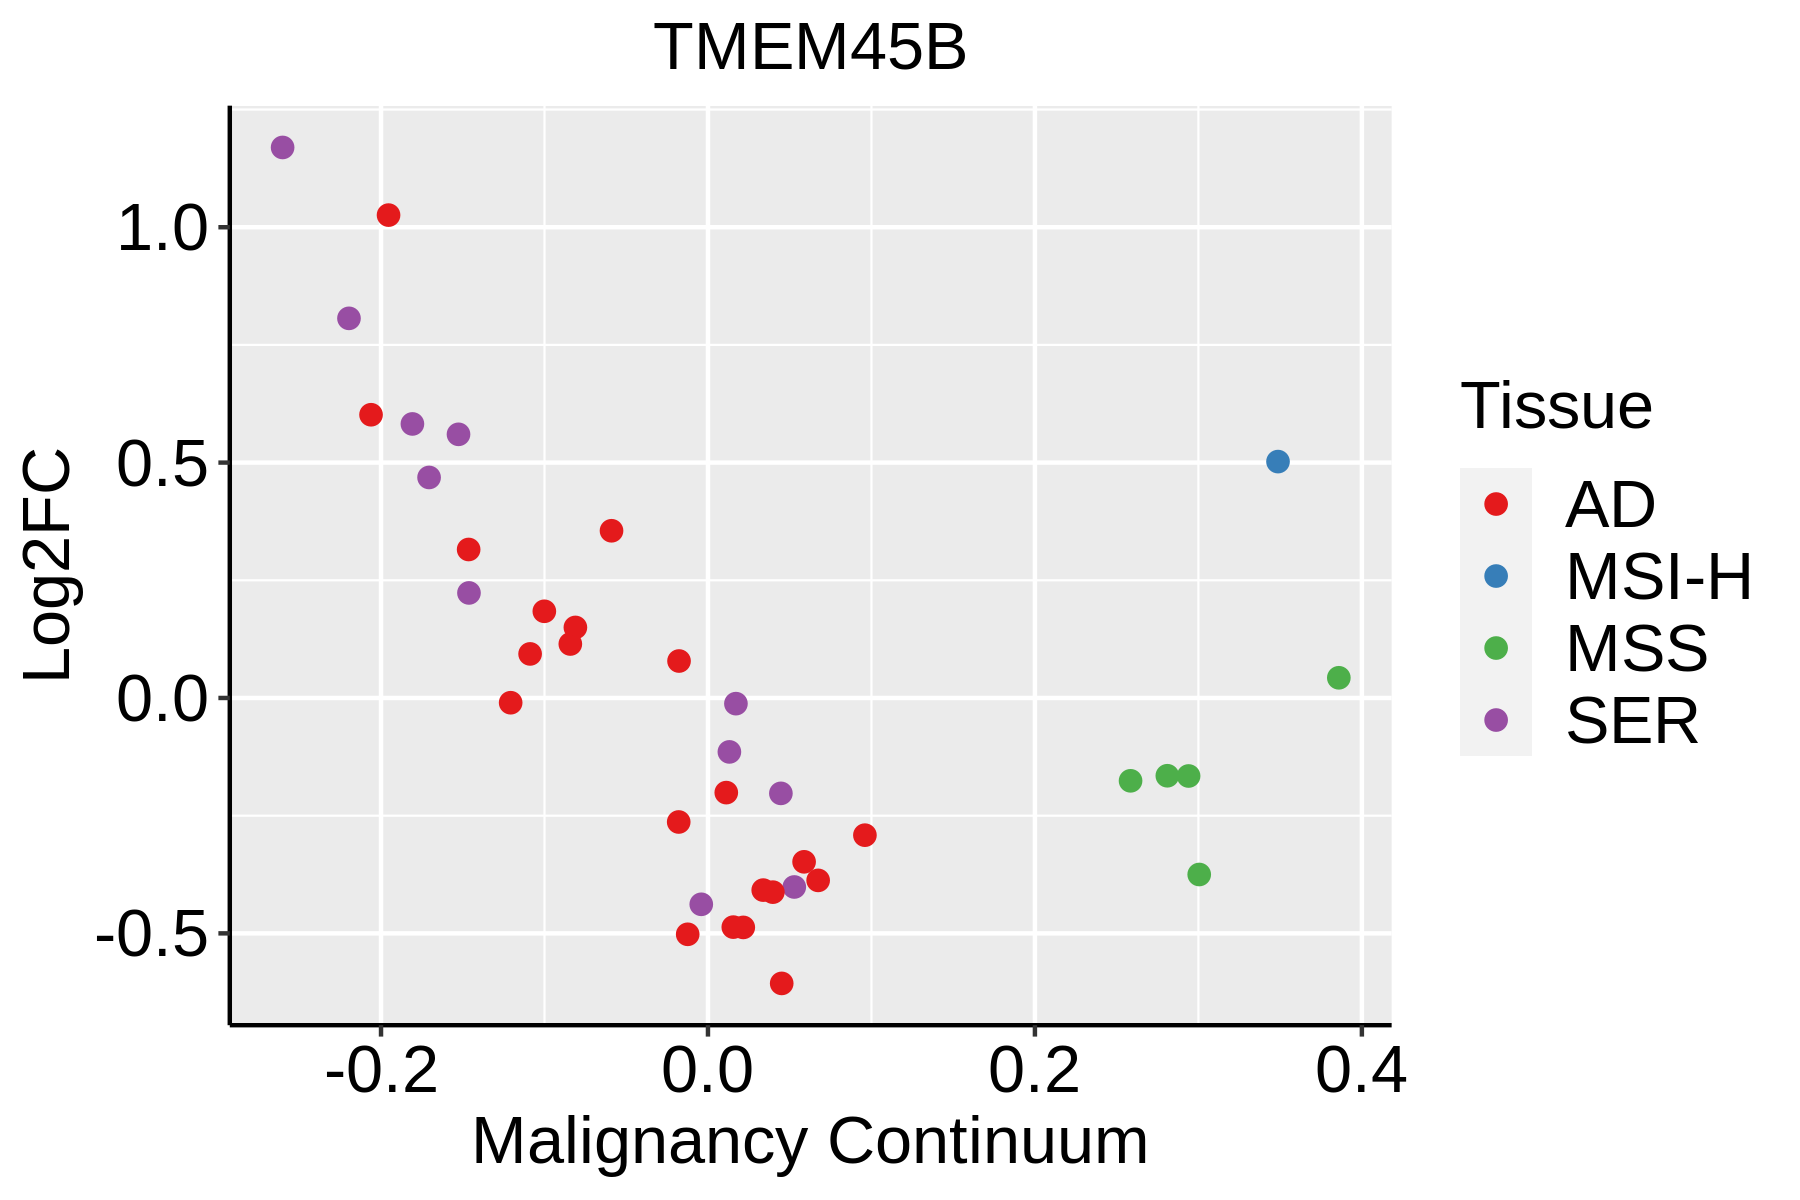 | AD: Adenomas |
| SER: Sessile serrated lesions | ||
| MSI-H: Microsatellite-high colorectal cancer | ||
| MSS: Microsatellite stable colorectal cancer | ||
| Esophagus |  | ESCC: Esophageal squamous cell carcinoma |
| HGIN: High-grade intraepithelial neoplasias | ||
| LGIN: Low-grade intraepithelial neoplasias | ||
| GC | 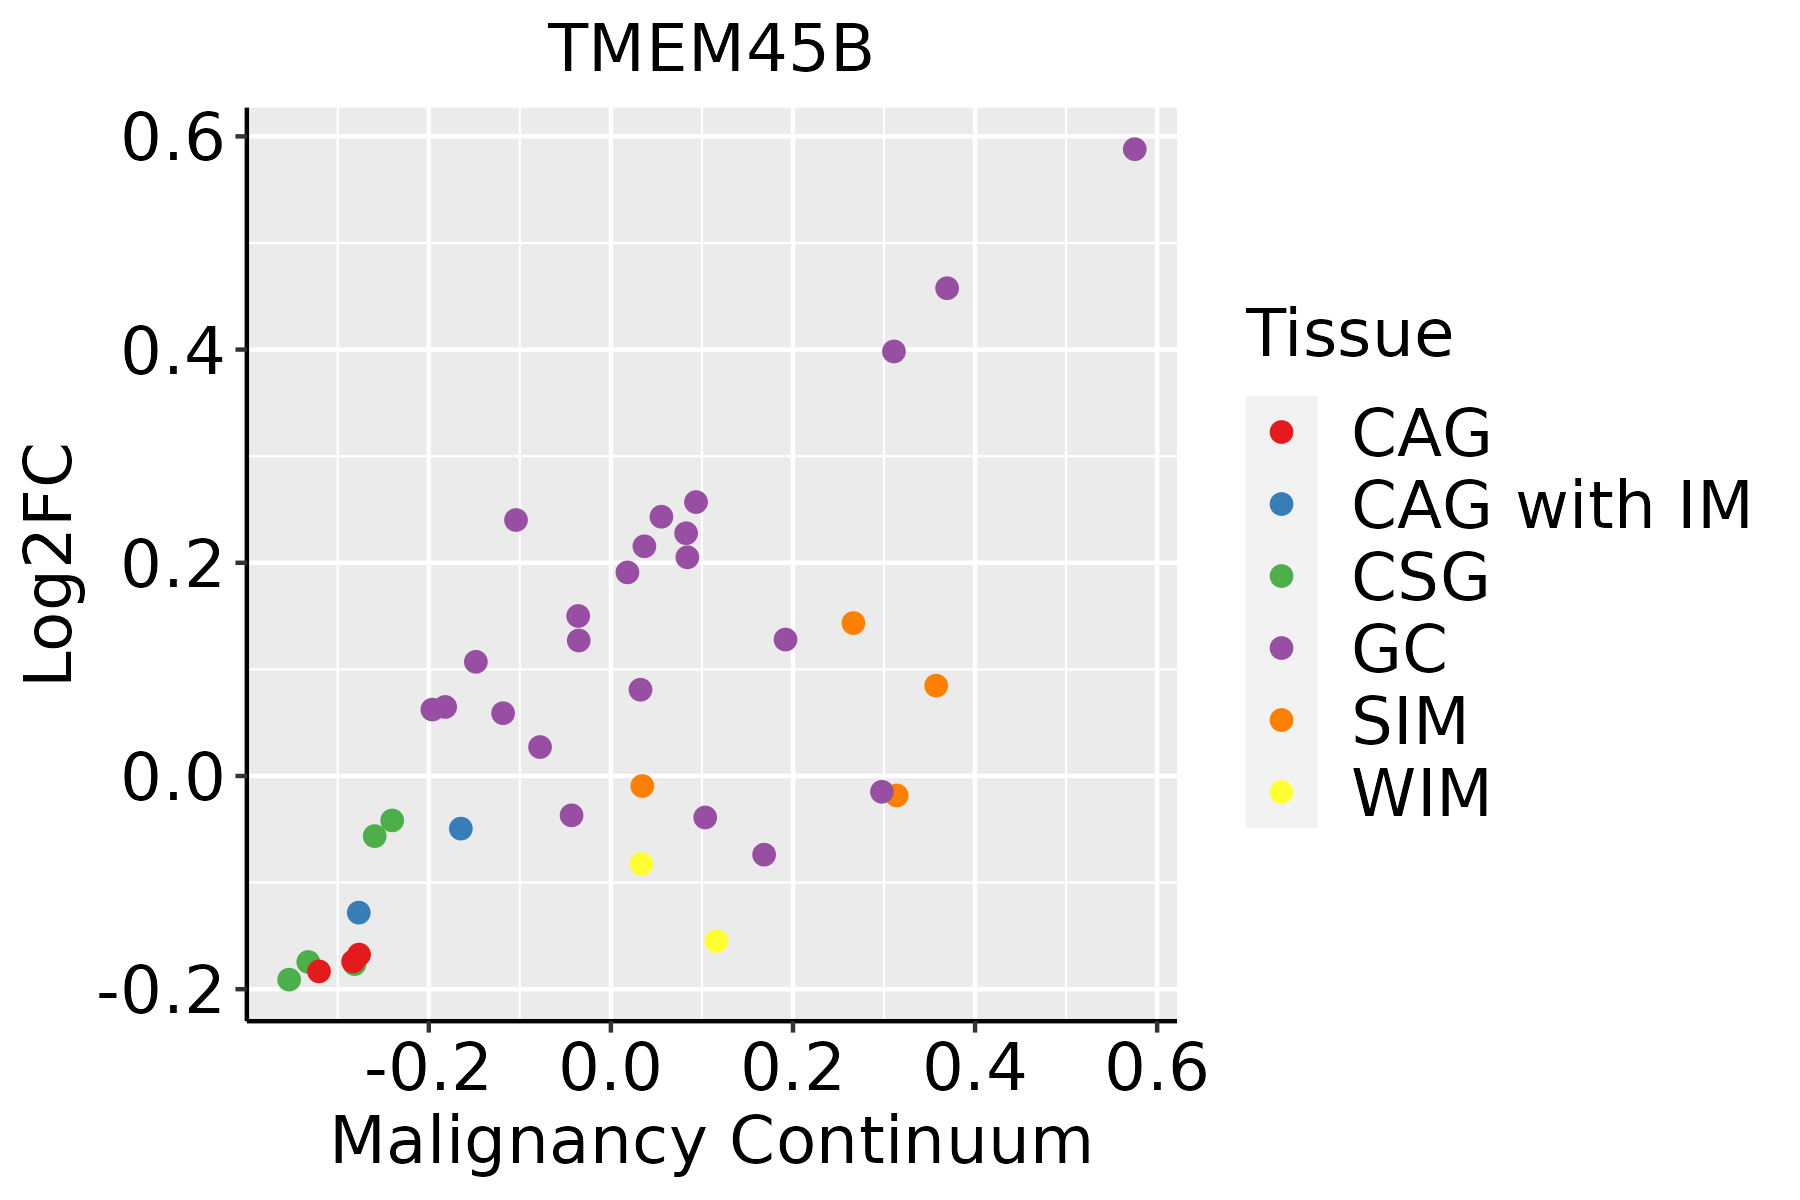 | CAG: Chronic atrophic gastritis |
| CAG with IM: Chronic atrophic gastritis with intestinal metaplasia | ||
| CSG: Chronic superficial gastritis | ||
| GC: Gastric cancer | ||
| SIM: Severe intestinal metaplasia | ||
| WIM: Wild intestinal metaplasia | ||
| Liver |  | HCC: Hepatocellular carcinoma |
| NAFLD: Non-alcoholic fatty liver disease | ||
| Oral Cavity |  | EOLP: Erosive Oral lichen planus |
| LP: leukoplakia | ||
| NEOLP: Non-erosive oral lichen planus | ||
| OSCC: Oral squamous cell carcinoma | ||
| Prostate | 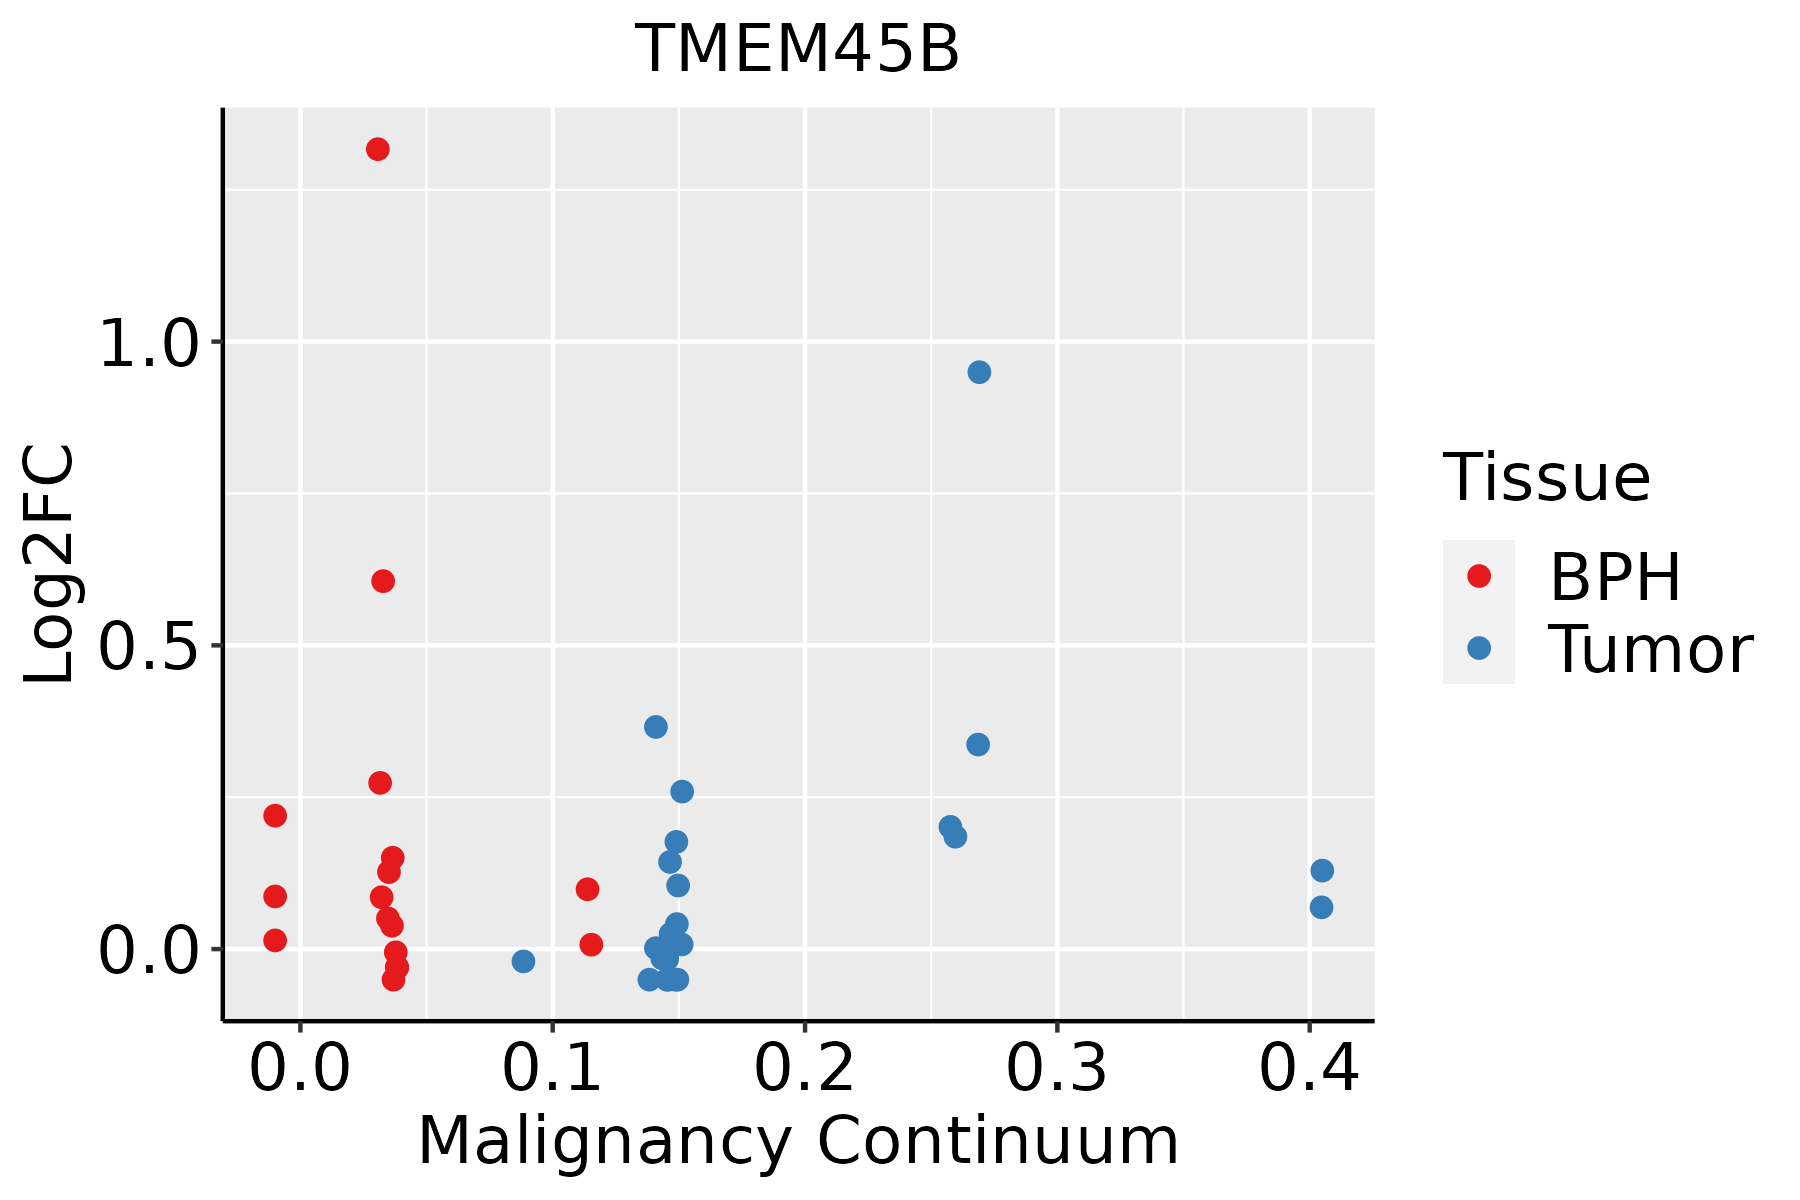 | BPH: Benign Prostatic Hyperplasia |
| ∗log2FC in expression of this searched gene in stem-like cells from each diseased tissue sample relative to stem-like cells in normal samples in each tissue plotted against the malignancy continuum. Samples are colored based on if they are from different disease stage. |
Top |
Malignant transformation related pathway analysis |
| Find out the enriched GO biological processes and KEGG pathways involved in transition from healthy to precancer to cancer |
| Tissue | Disease Stage | Enriched GO biological Processes |
| Colorectum | AD |  |
| Colorectum | SER |  |
| Colorectum | MSS |  |
| Colorectum | MSI-H |  |
| Colorectum | FAP |  |
| ∗Top 15 enriched GO BP terms are showed in the bar plot of each disease state in each tissue. Each row represents a significant GO biological process which is colored according to the -log10(p.adjust). |
| Page: 1 2 3 4 5 6 7 8 9 |
| GO ID | Tissue | Disease Stage | Description | Gene Ratio | Bg Ratio | pvalue | p.adjust | Count |
| Page: 1 |
| Pathway ID | Tissue | Disease Stage | Description | Gene Ratio | Bg Ratio | pvalue | p.adjust | qvalue | Count |
| Page: 1 |
Top |
Cell-cell communication analysis |
| Identification of potential cell-cell interactions between two cell types and their ligand-receptor pairs for different disease states |
| Ligand | Receptor | LRpair | Pathway | Tissue | Disease Stage |
| Page: 1 |
Top |
Single-cell gene regulatory network inference analysis |
| Find out the significant the regulons (TFs) and the target genes of each regulon across cell types for different disease states |
| TF | Cell Type | Tissue | Disease Stage | Target Gene | RSS | Regulon Activity |
| ∗The dot plots of a searched regulon are shown for all cell subpopulations in each disease state of each tissue based on the regulon specific score inferred using pySCENIC and by calculating the average expression. |
| Page: 1 |
Top |
Somatic mutation of malignant transformation related genes |
| Annotation of somatic variants for genes involved in malignant transformation |
| Hugo Symbol | Variant Class | Variant Classification | dbSNP RS | HGVSc | HGVSp | HGVSp Short | SWISSPROT | BIOTYPE | SIFT | PolyPhen | Tumor Sample Barcode | Tissue | Histology | Sex | Age | Stage | Therapy Types | Drugs | Outcome |
| TMEM45B | SNV | Missense_Mutation | rs752472325 | c.145N>A | p.Glu49Lys | p.E49K | Q96B21 | protein_coding | deleterious(0) | possibly_damaging(0.879) | TCGA-AN-A046-01 | Breast | breast invasive carcinoma | Female | >=65 | I/II | Unknown | Unknown | SD |
| TMEM45B | insertion | Frame_Shift_Ins | novel | c.663_664insATCATGGGACACTGTGAAAAACTCAAATCAA | p.His222IlefsTer51 | p.H222Ifs*51 | Q96B21 | protein_coding | TCGA-A2-A04V-01 | Breast | breast invasive carcinoma | Female | <65 | I/II | Chemotherapy | cytoxan | PD | ||
| TMEM45B | insertion | Frame_Shift_Ins | novel | c.643_644insTCATTTTTTGTATTTTTAGTAGAAACAGGGTT | p.Thr216IlefsTer37 | p.T216Ifs*37 | Q96B21 | protein_coding | TCGA-BH-A0B8-01 | Breast | breast invasive carcinoma | Female | <65 | I/II | Hormone Therapy | arimidex | SD | ||
| TMEM45B | SNV | Missense_Mutation | c.703N>G | p.Ser235Ala | p.S235A | Q96B21 | protein_coding | tolerated(0.76) | benign(0.001) | TCGA-AG-3892-01 | Colorectum | rectum adenocarcinoma | Female | <65 | I/II | Unknown | Unknown | SD | |
| TMEM45B | SNV | Missense_Mutation | rs752472325 | c.145N>A | p.Glu49Lys | p.E49K | Q96B21 | protein_coding | deleterious(0) | possibly_damaging(0.879) | TCGA-AG-A002-01 | Colorectum | rectum adenocarcinoma | Male | <65 | I/II | Unknown | Unknown | SD |
| TMEM45B | SNV | Missense_Mutation | c.154A>G | p.Ile52Val | p.I52V | Q96B21 | protein_coding | tolerated(1) | benign(0) | TCGA-AP-A0LJ-01 | Endometrium | uterine corpus endometrioid carcinoma | Female | <65 | I/II | Unknown | Unknown | SD | |
| TMEM45B | SNV | Missense_Mutation | novel | c.386N>A | p.Gly129Asp | p.G129D | Q96B21 | protein_coding | deleterious(0) | probably_damaging(0.996) | TCGA-AP-A1DK-01 | Endometrium | uterine corpus endometrioid carcinoma | Female | <65 | I/II | Unknown | Unknown | SD |
| TMEM45B | SNV | Missense_Mutation | rs765825131 | c.728N>A | p.Arg243Gln | p.R243Q | Q96B21 | protein_coding | deleterious(0.03) | possibly_damaging(0.531) | TCGA-AP-A1DO-01 | Endometrium | uterine corpus endometrioid carcinoma | Female | <65 | I/II | Unknown | Unknown | SD |
| TMEM45B | SNV | Missense_Mutation | rs765825131 | c.728N>A | p.Arg243Gln | p.R243Q | Q96B21 | protein_coding | deleterious(0.03) | possibly_damaging(0.531) | TCGA-AX-A2HG-01 | Endometrium | uterine corpus endometrioid carcinoma | Female | <65 | I/II | Unknown | Unknown | SD |
| TMEM45B | SNV | Missense_Mutation | c.118N>T | p.His40Tyr | p.H40Y | Q96B21 | protein_coding | tolerated(1) | benign(0) | TCGA-D1-A17M-01 | Endometrium | uterine corpus endometrioid carcinoma | Female | <65 | I/II | Unknown | Unknown | SD |
| Page: 1 2 3 |
Top |
Related drugs of malignant transformation related genes |
| Identification of chemicals and drugs interact with genes involved in malignant transfromation |
| (DGIdb 4.0) |
| Entrez ID | Symbol | Category | Interaction Types | Drug Claim Name | Drug Name | PMIDs |
| Page: 1 |

Copyright 2023-Present -The University of Texas Health Science Center at Houston |