
|
|||||
|
 | |
| |
| |
| |
| |
| |
|
Gene: TMEM45A |
Gene summary for TMEM45A |
| Gene information | Species | Human | Gene symbol | TMEM45A | Gene ID | 55076 |
| Gene name | transmembrane protein 45A | |
| Gene Alias | DERP7 | |
| Cytomap | 3q12.2 | |
| Gene Type | protein-coding | GO ID | GO:0005575 | UniProtAcc | Q9NWC5 |
Top |
Malignant transformation analysis |
| Identification of the aberrant gene expression in precancerous and cancerous lesions by comparing the gene expression of stem-like cells in diseased tissues with normal stem cells |
| Entrez ID | Symbol | Replicates | Species | Organ | Tissue | Adj P-value | Log2FC | Malignancy |
| 55076 | TMEM45A | GSM4909282 | Human | Breast | IDC | 1.67e-22 | 6.68e-01 | -0.0288 |
| 55076 | TMEM45A | GSM4909285 | Human | Breast | IDC | 6.78e-28 | 5.80e-01 | 0.21 |
| 55076 | TMEM45A | GSM4909286 | Human | Breast | IDC | 7.01e-03 | -1.28e-01 | 0.1081 |
| 55076 | TMEM45A | GSM4909287 | Human | Breast | IDC | 2.01e-03 | 1.84e-01 | 0.2057 |
| 55076 | TMEM45A | GSM4909290 | Human | Breast | IDC | 2.52e-11 | 3.32e-01 | 0.2096 |
| 55076 | TMEM45A | GSM4909311 | Human | Breast | IDC | 9.29e-03 | -1.15e-01 | 0.1534 |
| 55076 | TMEM45A | GSM4909317 | Human | Breast | IDC | 1.92e-06 | 3.77e-01 | 0.1355 |
| 55076 | TMEM45A | GSM4909319 | Human | Breast | IDC | 3.66e-02 | -1.22e-01 | 0.1563 |
| 55076 | TMEM45A | brca3 | Human | Breast | Precancer | 1.56e-09 | 3.55e-01 | -0.0263 |
| 55076 | TMEM45A | DCIS2 | Human | Breast | DCIS | 2.38e-15 | 4.04e-02 | 0.0085 |
| 55076 | TMEM45A | Tumor | Human | Cervix | CC | 2.99e-60 | 1.07e+00 | 0.1241 |
| 55076 | TMEM45A | sample1 | Human | Cervix | CC | 2.93e-04 | 3.86e-01 | 0.0959 |
| 55076 | TMEM45A | sample3 | Human | Cervix | CC | 2.78e-77 | 1.15e+00 | 0.1387 |
| 55076 | TMEM45A | L1 | Human | Cervix | CC | 4.93e-13 | 7.00e-01 | 0.0802 |
| 55076 | TMEM45A | T1 | Human | Cervix | CC | 9.94e-04 | 2.84e-01 | 0.0918 |
| 55076 | TMEM45A | T3 | Human | Cervix | CC | 7.31e-71 | 1.15e+00 | 0.1389 |
| 55076 | TMEM45A | LZE8T | Human | Esophagus | ESCC | 3.88e-32 | 1.71e+00 | 0.067 |
| 55076 | TMEM45A | LZE20T | Human | Esophagus | ESCC | 2.22e-02 | 1.48e-01 | 0.0662 |
| 55076 | TMEM45A | LZE22T | Human | Esophagus | ESCC | 2.03e-03 | 6.03e-01 | 0.068 |
| 55076 | TMEM45A | LZE6T | Human | Esophagus | ESCC | 4.25e-14 | 9.42e-01 | 0.0845 |
| Page: 1 2 3 4 5 6 |
| Tissue | Expression Dynamics | Abbreviation |
| Breast |  | IDC: Invasive ductal carcinoma |
| DCIS: Ductal carcinoma in situ | ||
| Precancer(BRCA1-mut): Precancerous lesion from BRCA1 mutation carriers | ||
| Cervix |  | CC: Cervix cancer |
| HSIL_HPV: HPV-infected high-grade squamous intraepithelial lesions | ||
| N_HPV: HPV-infected normal cervix | ||
| Esophagus | 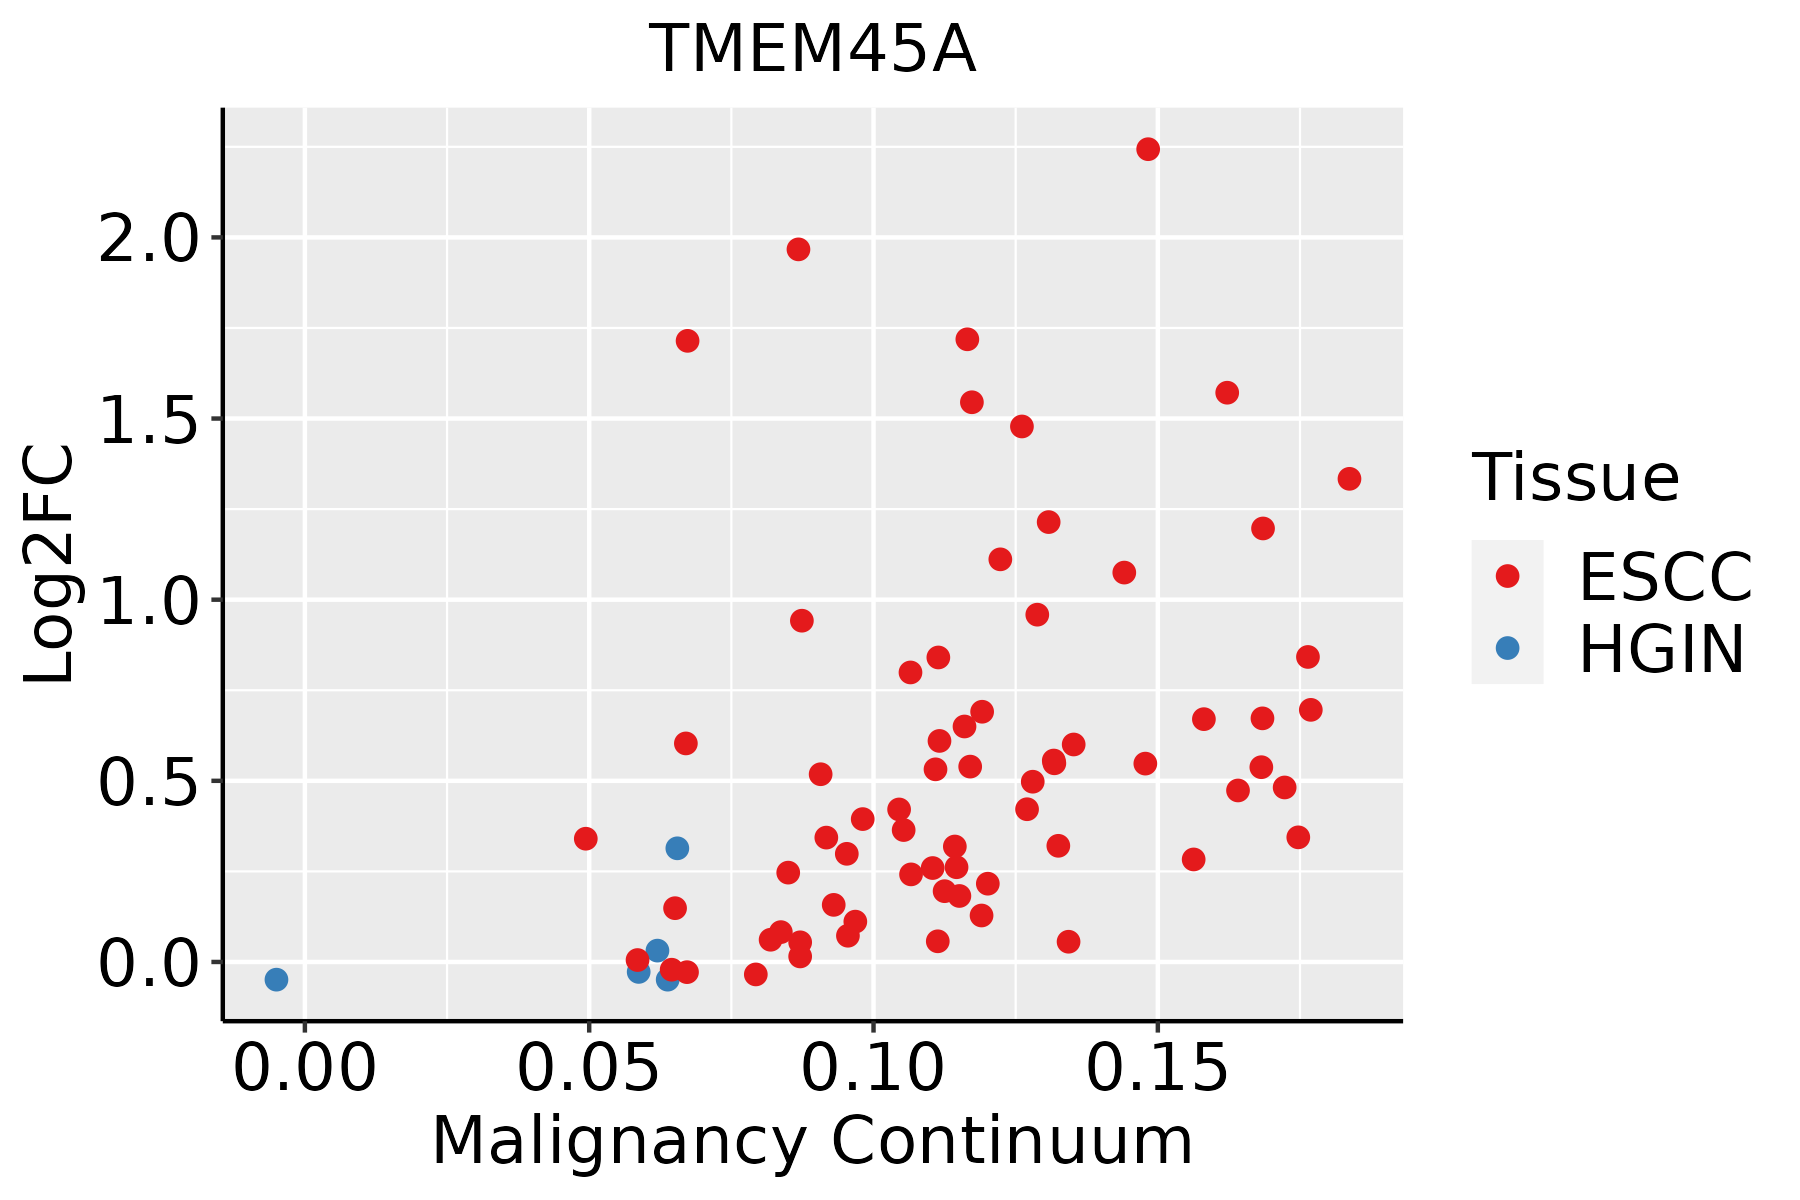 | ESCC: Esophageal squamous cell carcinoma |
| HGIN: High-grade intraepithelial neoplasias | ||
| LGIN: Low-grade intraepithelial neoplasias | ||
| Liver | 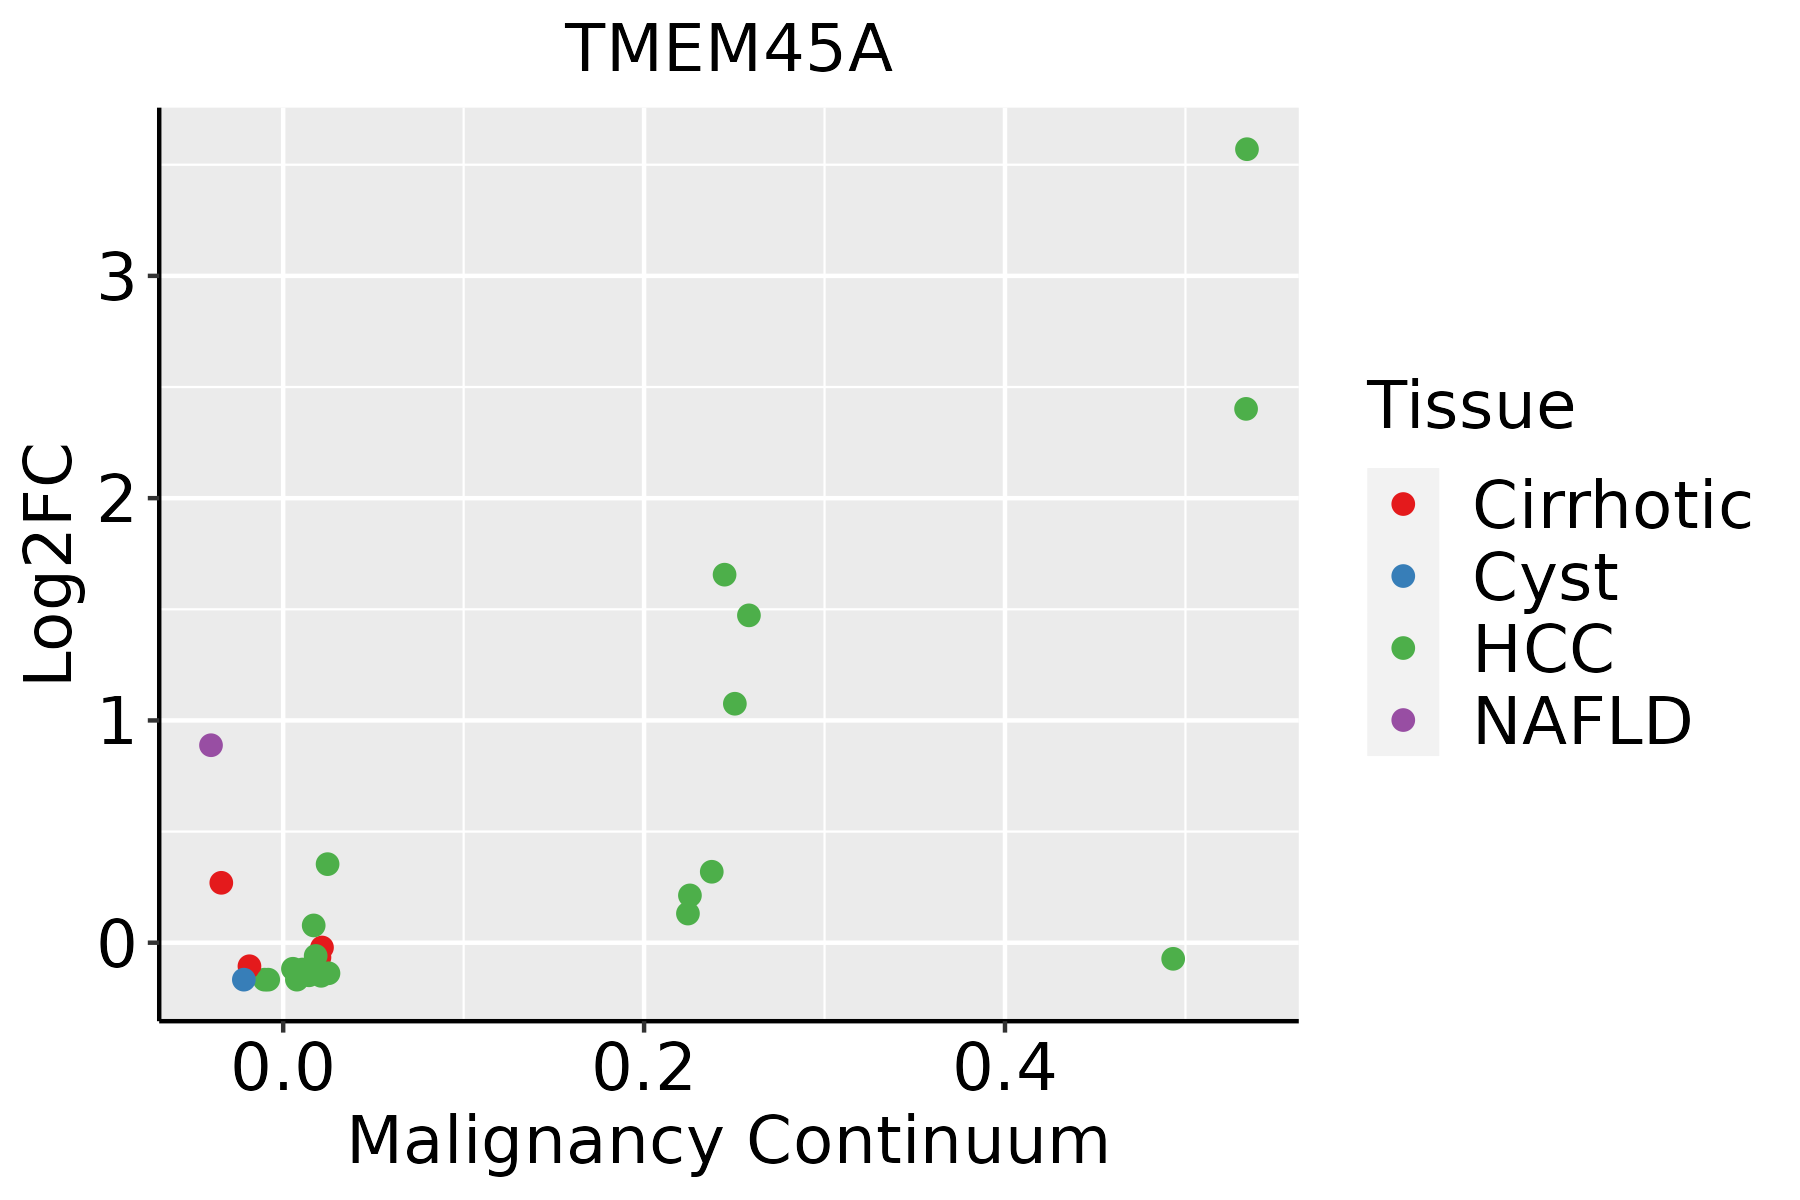 | HCC: Hepatocellular carcinoma |
| NAFLD: Non-alcoholic fatty liver disease | ||
| Oral Cavity |  | EOLP: Erosive Oral lichen planus |
| LP: leukoplakia | ||
| NEOLP: Non-erosive oral lichen planus | ||
| OSCC: Oral squamous cell carcinoma | ||
| Skin | 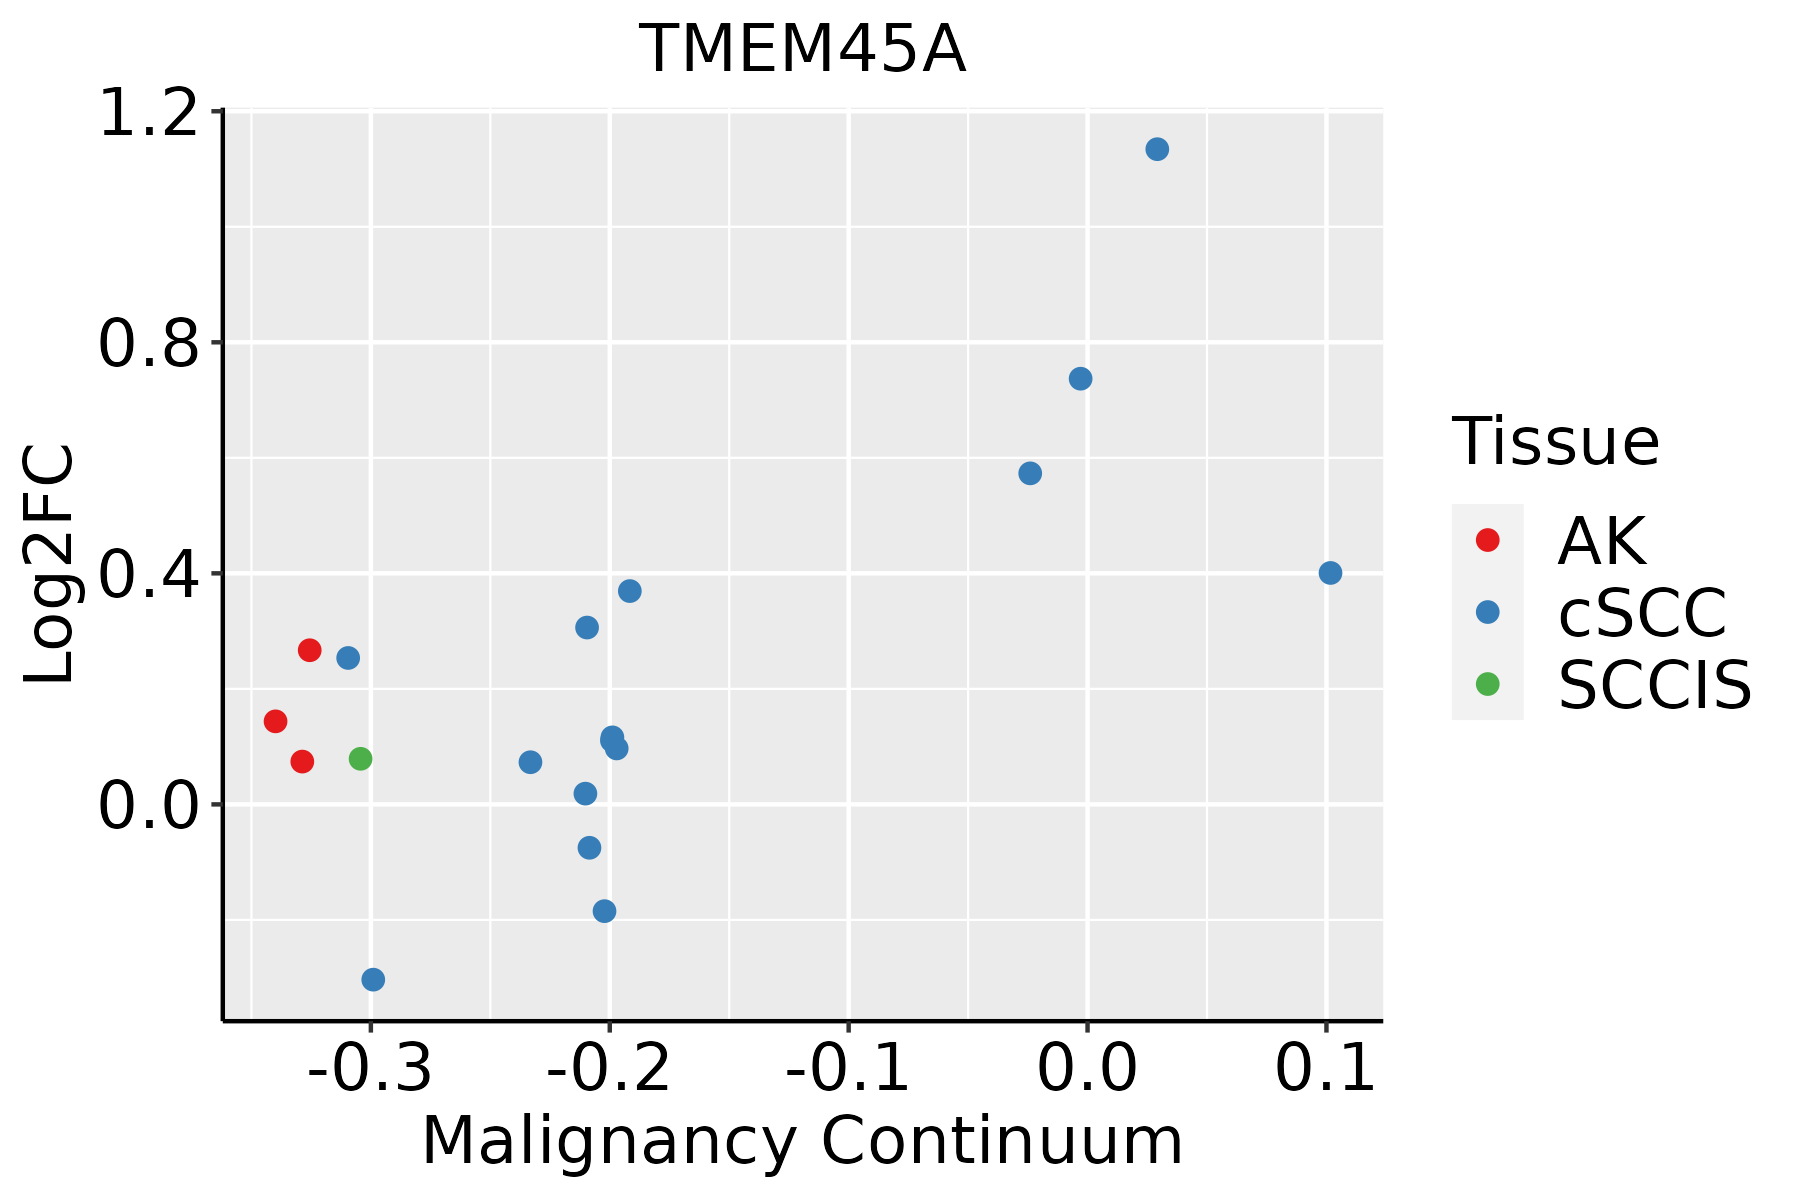 | AK: Actinic keratosis |
| cSCC: Cutaneous squamous cell carcinoma | ||
| SCCIS:squamous cell carcinoma in situ | ||
| Thyroid | 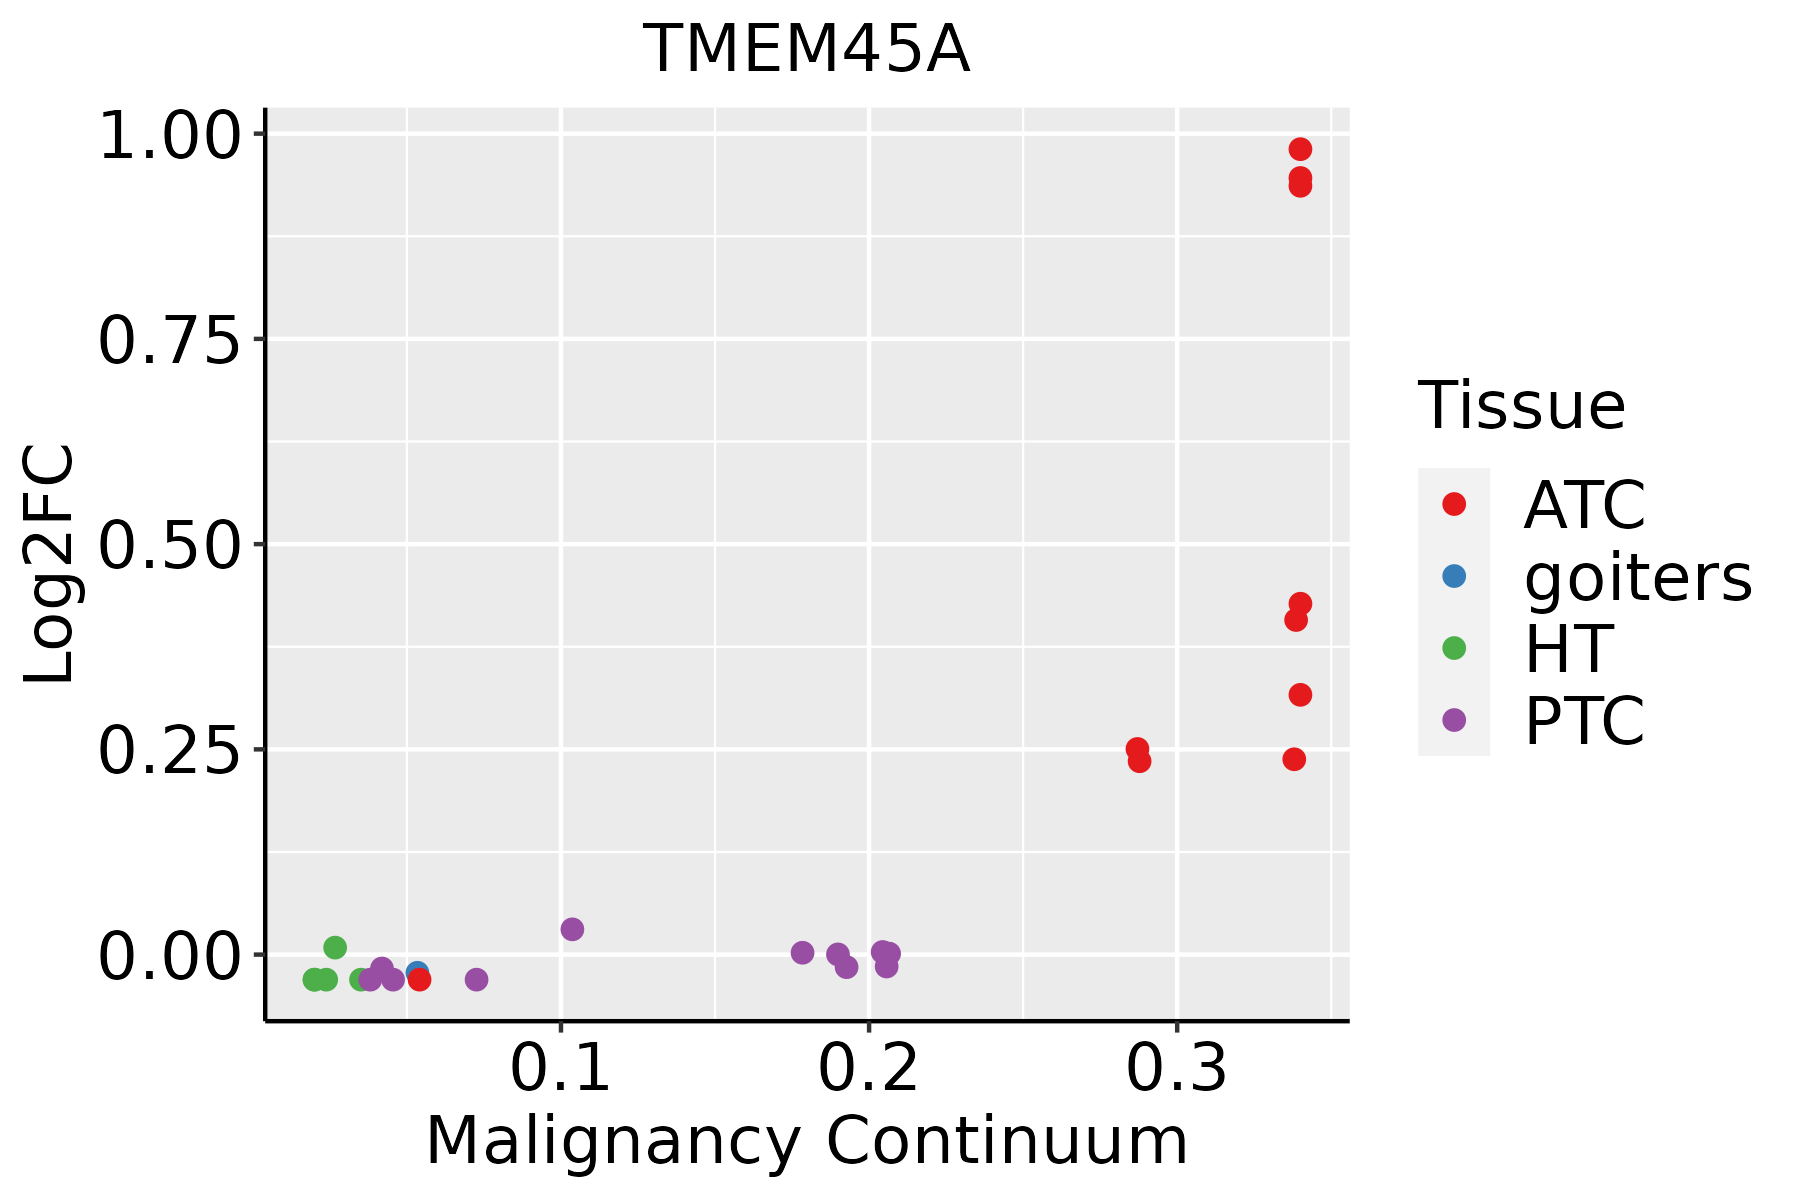 | ATC: Anaplastic thyroid cancer |
| HT: Hashimoto's thyroiditis | ||
| PTC: Papillary thyroid cancer |
| ∗log2FC in expression of this searched gene in stem-like cells from each diseased tissue sample relative to stem-like cells in normal samples in each tissue plotted against the malignancy continuum. Samples are colored based on if they are from different disease stage. |
Top |
Malignant transformation related pathway analysis |
| Find out the enriched GO biological processes and KEGG pathways involved in transition from healthy to precancer to cancer |
| Tissue | Disease Stage | Enriched GO biological Processes |
| Colorectum | AD |  |
| Colorectum | SER |  |
| Colorectum | MSS |  |
| Colorectum | MSI-H |  |
| Colorectum | FAP |  |
| ∗Top 15 enriched GO BP terms are showed in the bar plot of each disease state in each tissue. Each row represents a significant GO biological process which is colored according to the -log10(p.adjust). |
| Page: 1 2 3 4 5 6 7 8 9 |
| GO ID | Tissue | Disease Stage | Description | Gene Ratio | Bg Ratio | pvalue | p.adjust | Count |
| Page: 1 |
| Pathway ID | Tissue | Disease Stage | Description | Gene Ratio | Bg Ratio | pvalue | p.adjust | qvalue | Count |
| Page: 1 |
Top |
Cell-cell communication analysis |
| Identification of potential cell-cell interactions between two cell types and their ligand-receptor pairs for different disease states |
| Ligand | Receptor | LRpair | Pathway | Tissue | Disease Stage |
| Page: 1 |
Top |
Single-cell gene regulatory network inference analysis |
| Find out the significant the regulons (TFs) and the target genes of each regulon across cell types for different disease states |
| TF | Cell Type | Tissue | Disease Stage | Target Gene | RSS | Regulon Activity |
| ∗The dot plots of a searched regulon are shown for all cell subpopulations in each disease state of each tissue based on the regulon specific score inferred using pySCENIC and by calculating the average expression. |
| Page: 1 |
Top |
Somatic mutation of malignant transformation related genes |
| Annotation of somatic variants for genes involved in malignant transformation |
| Hugo Symbol | Variant Class | Variant Classification | dbSNP RS | HGVSc | HGVSp | HGVSp Short | SWISSPROT | BIOTYPE | SIFT | PolyPhen | Tumor Sample Barcode | Tissue | Histology | Sex | Age | Stage | Therapy Types | Drugs | Outcome |
| TMEM45A | SNV | Missense_Mutation | c.143G>A | p.Arg48Gln | p.R48Q | Q9NWC5 | protein_coding | deleterious(0.03) | benign(0.325) | TCGA-2W-A8YY-01 | Cervix | cervical & endocervical cancer | Female | <65 | I/II | Chemotherapy | cisplatin | CR | |
| TMEM45A | SNV | Missense_Mutation | c.414C>G | p.Phe138Leu | p.F138L | Q9NWC5 | protein_coding | deleterious(0.04) | possibly_damaging(0.617) | TCGA-C5-A2LX-01 | Cervix | cervical & endocervical cancer | Female | <65 | I/II | Chemotherapy | cisplatin | SD | |
| TMEM45A | SNV | Missense_Mutation | novel | c.749N>C | p.Arg250Thr | p.R250T | Q9NWC5 | protein_coding | deleterious(0) | possibly_damaging(0.617) | TCGA-5M-AAT4-01 | Colorectum | colon adenocarcinoma | Male | >=65 | III/IV | Unknown | Unknown | PD |
| TMEM45A | SNV | Missense_Mutation | rs760669672 | c.378N>A | p.Met126Ile | p.M126I | Q9NWC5 | protein_coding | deleterious(0.04) | benign(0.003) | TCGA-G4-6628-01 | Colorectum | colon adenocarcinoma | Male | >=65 | I/II | Unknown | Unknown | SD |
| TMEM45A | SNV | Missense_Mutation | novel | c.124N>A | p.Ser42Thr | p.S42T | Q9NWC5 | protein_coding | tolerated(0.07) | benign(0.007) | TCGA-A5-A2K5-01 | Endometrium | uterine corpus endometrioid carcinoma | Female | >=65 | I/II | Unknown | Unknown | SD |
| TMEM45A | SNV | Missense_Mutation | novel | c.731N>A | p.Thr244Asn | p.T244N | Q9NWC5 | protein_coding | tolerated(0.26) | benign(0.003) | TCGA-A5-A2K5-01 | Endometrium | uterine corpus endometrioid carcinoma | Female | >=65 | I/II | Unknown | Unknown | SD |
| TMEM45A | SNV | Missense_Mutation | rs201066091 | c.800N>A | p.Arg267Gln | p.R267Q | Q9NWC5 | protein_coding | tolerated(0.14) | benign(0.051) | TCGA-AJ-A3EL-01 | Endometrium | uterine corpus endometrioid carcinoma | Female | <65 | I/II | Unknown | Unknown | SD |
| TMEM45A | SNV | Missense_Mutation | c.540N>T | p.Glu180Asp | p.E180D | Q9NWC5 | protein_coding | deleterious(0.01) | probably_damaging(0.913) | TCGA-AP-A051-01 | Endometrium | uterine corpus endometrioid carcinoma | Female | >=65 | I/II | Unknown | Unknown | SD | |
| TMEM45A | SNV | Missense_Mutation | c.34N>G | p.Thr12Ala | p.T12A | Q9NWC5 | protein_coding | deleterious(0.01) | benign(0.018) | TCGA-AP-A0LM-01 | Endometrium | uterine corpus endometrioid carcinoma | Female | <65 | III/IV | Chemotherapy | cisplatin | SD | |
| TMEM45A | SNV | Missense_Mutation | novel | c.280N>T | p.His94Tyr | p.H94Y | Q9NWC5 | protein_coding | deleterious(0.01) | possibly_damaging(0.642) | TCGA-AX-A1CE-01 | Endometrium | uterine corpus endometrioid carcinoma | Female | <65 | I/II | Unspecific | Paclitaxel | SD |
| Page: 1 2 3 |
Top |
Related drugs of malignant transformation related genes |
| Identification of chemicals and drugs interact with genes involved in malignant transfromation |
| (DGIdb 4.0) |
| Entrez ID | Symbol | Category | Interaction Types | Drug Claim Name | Drug Name | PMIDs |
| Page: 1 |

Copyright 2023-Present -The University of Texas Health Science Center at Houston |