
|
|||||
|
 | |
| |
| |
| |
| |
| |
|
Gene: TMEM44 |
Gene summary for TMEM44 |
| Gene information | Species | Human | Gene symbol | TMEM44 | Gene ID | 93109 |
| Gene name | transmembrane protein 44 | |
| Gene Alias | TMEM44 | |
| Cytomap | 3q29 | |
| Gene Type | protein-coding | GO ID | GO:0005575 | UniProtAcc | Q2T9K0 |
Top |
Malignant transformation analysis |
| Identification of the aberrant gene expression in precancerous and cancerous lesions by comparing the gene expression of stem-like cells in diseased tissues with normal stem cells |
| Entrez ID | Symbol | Replicates | Species | Organ | Tissue | Adj P-value | Log2FC | Malignancy |
| 93109 | TMEM44 | LZE2T | Human | Esophagus | ESCC | 2.18e-04 | 4.52e-01 | 0.082 |
| 93109 | TMEM44 | LZE7T | Human | Esophagus | ESCC | 3.01e-10 | 4.78e-01 | 0.0667 |
| 93109 | TMEM44 | LZE8T | Human | Esophagus | ESCC | 2.72e-03 | 1.20e-01 | 0.067 |
| 93109 | TMEM44 | LZE21D1 | Human | Esophagus | HGIN | 1.52e-08 | 5.85e-01 | 0.0632 |
| 93109 | TMEM44 | LZE22D1 | Human | Esophagus | HGIN | 3.26e-02 | 1.30e-01 | 0.0595 |
| 93109 | TMEM44 | LZE24D1 | Human | Esophagus | HGIN | 3.66e-03 | 1.25e+00 | 0.054 |
| 93109 | TMEM44 | LZE24T | Human | Esophagus | ESCC | 1.24e-25 | 6.46e-01 | 0.0596 |
| 93109 | TMEM44 | LZE21T | Human | Esophagus | ESCC | 1.78e-08 | 4.96e-01 | 0.0655 |
| 93109 | TMEM44 | P2T-E | Human | Esophagus | ESCC | 4.36e-05 | 1.18e-01 | 0.1177 |
| 93109 | TMEM44 | P4T-E | Human | Esophagus | ESCC | 3.37e-26 | 5.36e-01 | 0.1323 |
| 93109 | TMEM44 | P5T-E | Human | Esophagus | ESCC | 8.34e-03 | 8.02e-02 | 0.1327 |
| 93109 | TMEM44 | P8T-E | Human | Esophagus | ESCC | 6.38e-16 | 3.04e-01 | 0.0889 |
| 93109 | TMEM44 | P9T-E | Human | Esophagus | ESCC | 7.03e-31 | 6.09e-01 | 0.1131 |
| 93109 | TMEM44 | P10T-E | Human | Esophagus | ESCC | 7.62e-05 | 1.52e-01 | 0.116 |
| 93109 | TMEM44 | P11T-E | Human | Esophagus | ESCC | 1.72e-04 | 1.79e-01 | 0.1426 |
| 93109 | TMEM44 | P12T-E | Human | Esophagus | ESCC | 1.13e-30 | 6.48e-01 | 0.1122 |
| 93109 | TMEM44 | P15T-E | Human | Esophagus | ESCC | 1.19e-13 | 2.55e-01 | 0.1149 |
| 93109 | TMEM44 | P20T-E | Human | Esophagus | ESCC | 6.15e-13 | 3.06e-01 | 0.1124 |
| 93109 | TMEM44 | P21T-E | Human | Esophagus | ESCC | 9.50e-08 | 1.96e-01 | 0.1617 |
| 93109 | TMEM44 | P22T-E | Human | Esophagus | ESCC | 1.73e-02 | 7.17e-02 | 0.1236 |
| Page: 1 2 3 4 |
| Tissue | Expression Dynamics | Abbreviation |
| Esophagus | 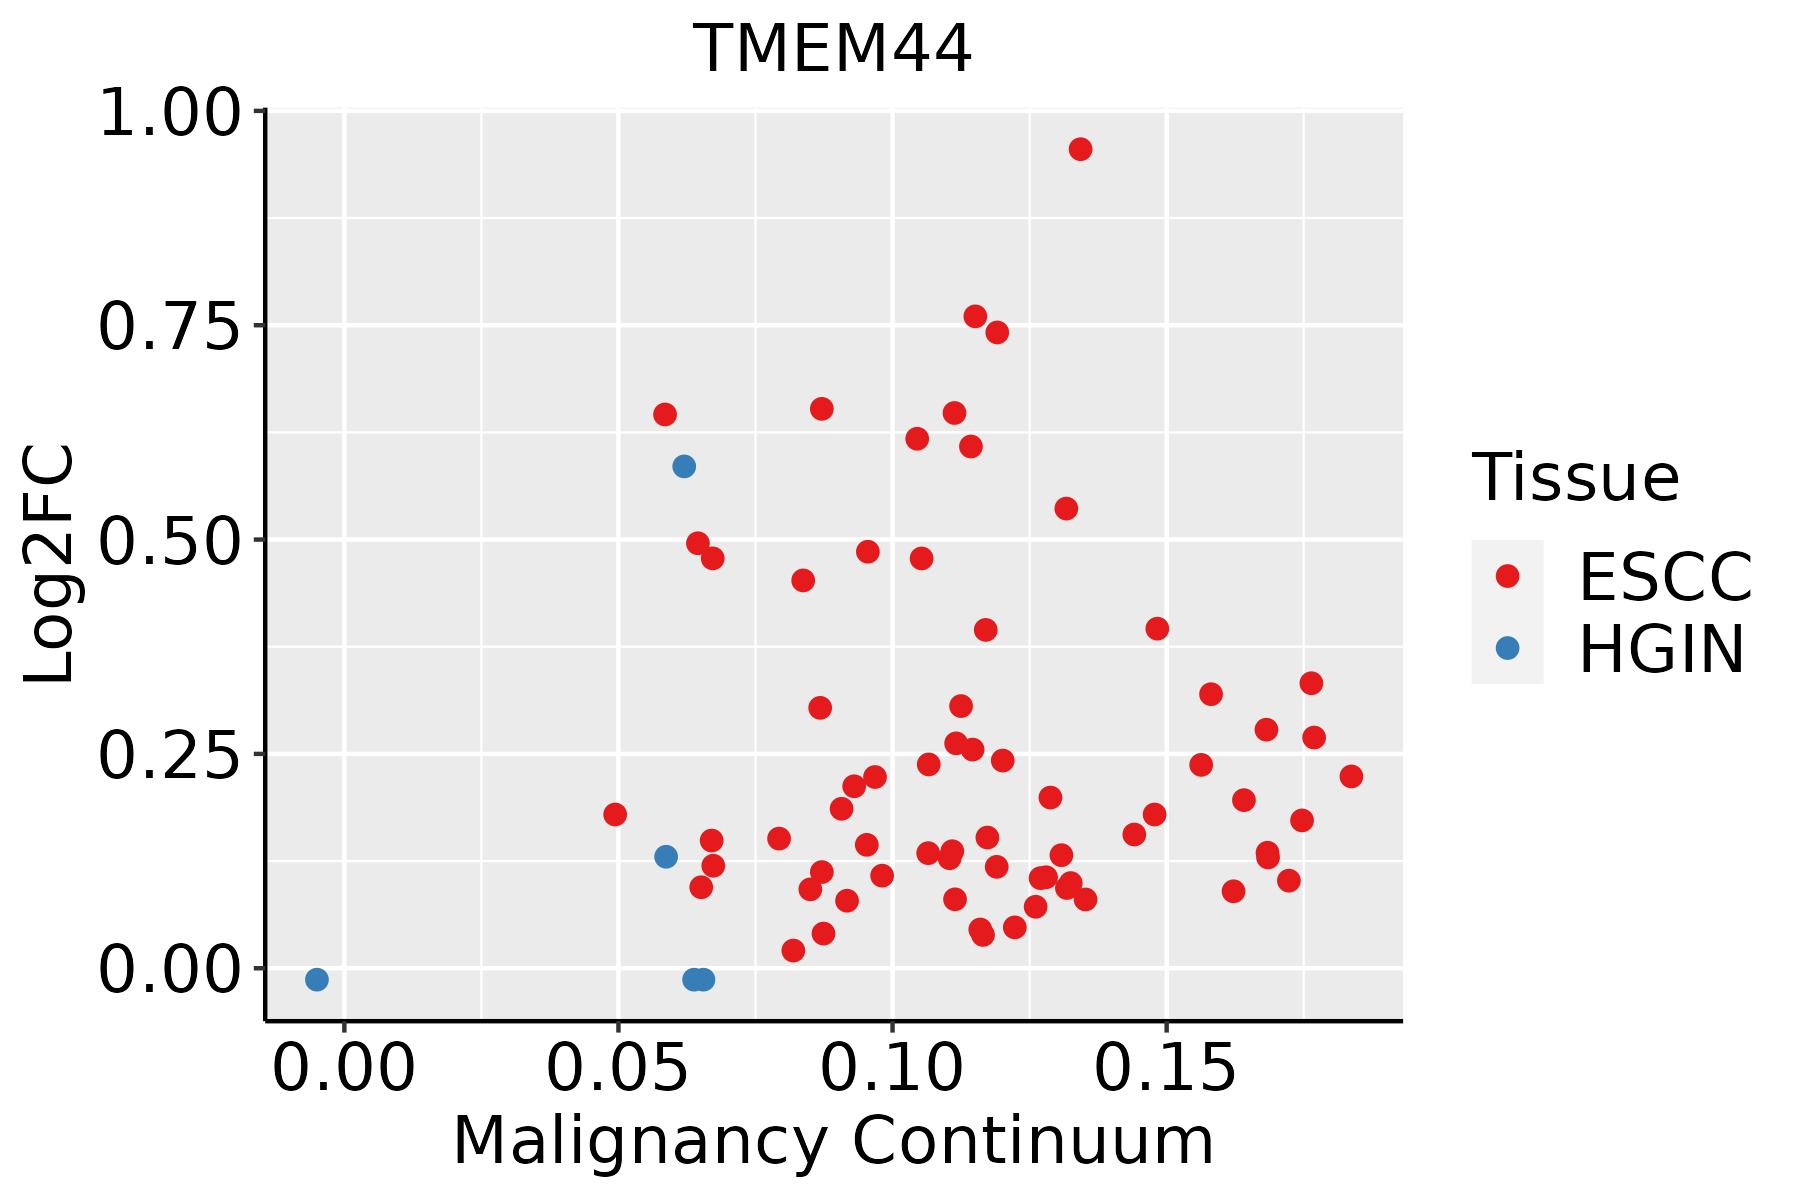 | ESCC: Esophageal squamous cell carcinoma |
| HGIN: High-grade intraepithelial neoplasias | ||
| LGIN: Low-grade intraepithelial neoplasias | ||
| Thyroid |  | ATC: Anaplastic thyroid cancer |
| HT: Hashimoto's thyroiditis | ||
| PTC: Papillary thyroid cancer |
| ∗log2FC in expression of this searched gene in stem-like cells from each diseased tissue sample relative to stem-like cells in normal samples in each tissue plotted against the malignancy continuum. Samples are colored based on if they are from different disease stage. |
Top |
Malignant transformation related pathway analysis |
| Find out the enriched GO biological processes and KEGG pathways involved in transition from healthy to precancer to cancer |
| Tissue | Disease Stage | Enriched GO biological Processes |
| Colorectum | AD |  |
| Colorectum | SER |  |
| Colorectum | MSS |  |
| Colorectum | MSI-H |  |
| Colorectum | FAP |  |
| ∗Top 15 enriched GO BP terms are showed in the bar plot of each disease state in each tissue. Each row represents a significant GO biological process which is colored according to the -log10(p.adjust). |
| Page: 1 2 3 4 5 6 7 8 9 |
| GO ID | Tissue | Disease Stage | Description | Gene Ratio | Bg Ratio | pvalue | p.adjust | Count |
| Page: 1 |
| Pathway ID | Tissue | Disease Stage | Description | Gene Ratio | Bg Ratio | pvalue | p.adjust | qvalue | Count |
| Page: 1 |
Top |
Cell-cell communication analysis |
| Identification of potential cell-cell interactions between two cell types and their ligand-receptor pairs for different disease states |
| Ligand | Receptor | LRpair | Pathway | Tissue | Disease Stage |
| Page: 1 |
Top |
Single-cell gene regulatory network inference analysis |
| Find out the significant the regulons (TFs) and the target genes of each regulon across cell types for different disease states |
| TF | Cell Type | Tissue | Disease Stage | Target Gene | RSS | Regulon Activity |
| ∗The dot plots of a searched regulon are shown for all cell subpopulations in each disease state of each tissue based on the regulon specific score inferred using pySCENIC and by calculating the average expression. |
| Page: 1 |
Top |
Somatic mutation of malignant transformation related genes |
| Annotation of somatic variants for genes involved in malignant transformation |
| Hugo Symbol | Variant Class | Variant Classification | dbSNP RS | HGVSc | HGVSp | HGVSp Short | SWISSPROT | BIOTYPE | SIFT | PolyPhen | Tumor Sample Barcode | Tissue | Histology | Sex | Age | Stage | Therapy Types | Drugs | Outcome |
| TMEM44 | SNV | Missense_Mutation | rs775906120 | c.938N>T | p.Ser313Leu | p.S313L | Q2T9K0 | protein_coding | deleterious(0) | probably_damaging(0.988) | TCGA-AN-A046-01 | Breast | breast invasive carcinoma | Female | >=65 | I/II | Unknown | Unknown | SD |
| TMEM44 | SNV | Missense_Mutation | c.1150G>C | p.Val384Leu | p.V384L | Q2T9K0 | protein_coding | deleterious(0.01) | possibly_damaging(0.477) | TCGA-AN-A0AS-01 | Breast | breast invasive carcinoma | Female | >=65 | III/IV | Unknown | Unknown | SD | |
| TMEM44 | insertion | Nonsense_Mutation | novel | c.600_601insACACACTAACG | p.Leu201ThrfsTer3 | p.L201Tfs*3 | Q2T9K0 | protein_coding | TCGA-A7-A0DB-01 | Breast | breast invasive carcinoma | Female | <65 | I/II | Hormone Therapy | arimidex | SD | ||
| TMEM44 | insertion | Nonsense_Mutation | novel | c.1279_1280insCTCCAGCTTAGCCAACAGAGCGAG | p.Ser427delinsThrProAlaTerProThrGluArgGly | p.S427delinsTPA*PTERG | Q2T9K0 | protein_coding | TCGA-AQ-A04J-01 | Breast | breast invasive carcinoma | Female | <65 | I/II | Chemotherapy | cytoxan | SD | ||
| TMEM44 | SNV | Missense_Mutation | rs565869394 | c.623C>T | p.Pro208Leu | p.P208L | Q2T9K0 | protein_coding | tolerated_low_confidence(0.36) | benign(0) | TCGA-2W-A8YY-01 | Cervix | cervical & endocervical cancer | Female | <65 | I/II | Chemotherapy | cisplatin | CR |
| TMEM44 | SNV | Missense_Mutation | c.757N>T | p.Arg253Trp | p.R253W | Q2T9K0 | protein_coding | deleterious(0.04) | benign(0.073) | TCGA-UC-A7PF-01 | Cervix | cervical & endocervical cancer | Female | <65 | I/II | Unknown | Unknown | SD | |
| TMEM44 | SNV | Missense_Mutation | rs768376448 | c.1207N>A | p.Gly403Arg | p.G403R | Q2T9K0 | protein_coding | deleterious(0.03) | benign(0.171) | TCGA-A6-4105-01 | Colorectum | colon adenocarcinoma | Male | >=65 | I/II | Unknown | Unknown | PD |
| TMEM44 | SNV | Missense_Mutation | c.194C>T | p.Ala65Val | p.A65V | Q2T9K0 | protein_coding | tolerated(0.12) | benign(0.072) | TCGA-A6-6781-01 | Colorectum | colon adenocarcinoma | Male | <65 | III/IV | Chemotherapy | oxaliplatin | SD | |
| TMEM44 | SNV | Missense_Mutation | c.525N>T | p.Gln175His | p.Q175H | Q2T9K0 | protein_coding | deleterious(0.04) | probably_damaging(0.978) | TCGA-AA-3492-01 | Colorectum | colon adenocarcinoma | Female | >=65 | I/II | Unknown | Unknown | SD | |
| TMEM44 | SNV | Missense_Mutation | novel | c.811N>A | p.Ala271Thr | p.A271T | Q2T9K0 | protein_coding | deleterious(0) | probably_damaging(0.982) | TCGA-AA-3947-01 | Colorectum | colon adenocarcinoma | Female | <65 | I/II | Unknown | Unknown | SD |
| Page: 1 2 3 4 5 |
Top |
Related drugs of malignant transformation related genes |
| Identification of chemicals and drugs interact with genes involved in malignant transfromation |
| (DGIdb 4.0) |
| Entrez ID | Symbol | Category | Interaction Types | Drug Claim Name | Drug Name | PMIDs |
| Page: 1 |

Copyright 2023-Present -The University of Texas Health Science Center at Houston |