Schematic overview of the cellular and molecular mechanisms involved in the cancer progression, including the proposed cellular and molecular mechanisms in cancer cells trajectory. AT1: alveolar type 1 cells; AT2: alveolar type 2 cells; AAH: atypical adenomatous hyperplasia; AIS: adenocarcinoma in situ; MIA: minimally invasive adenocarcinoma; IA: invasive adenocarcinoma; EMT: epithelial-mesenchymal transition

Home

Download

Statistics

Help

Contact

Center for Computational Systems Medicine
leaf

Gene summary

leaf

Malignant transformation analysis

leaf

Malignant transformation related pathway analysis

leaf

Cell-cell communication analysis

leaf

Single-cell gene regulatory network inference analysis

leaf

Somatic mutation of malignant transformation related genes

leaf

Related drugs of malignant transformation related genes

Gene: TMEM43

Gene summary for TMEM43

check button Gene summary.

Gene informationSpeciesHuman
Gene symbol

TMEM43

Gene ID

79188

Gene nametransmembrane protein 43
Gene AliasARVC5
Cytomap3p25.1
Gene Typeprotein-coding
GO ID

GO:0006996

UniProtAcc

A0A024R2F9


Top

Malignant transformation analysis

check button Identification of the aberrant gene expression in precancerous and cancerous lesions by comparing the gene expression of stem-like cells in diseased tissues with normal stem cells
check button Malignant transformation involving gene list.
Entrez IDSymbolReplicatesSpeciesOrganTissueAdj P-valueLog2FCMalignancy
79188TMEM43LZE2THumanEsophagusESCC4.16e-082.47e-010.082
79188TMEM43LZE4THumanEsophagusESCC4.49e-086.77e-020.0811
79188TMEM43LZE5THumanEsophagusESCC6.56e-04-4.55e-020.0514
79188TMEM43LZE7THumanEsophagusESCC2.46e-091.47e-010.0667
79188TMEM43LZE8THumanEsophagusESCC2.69e-031.81e-020.067
79188TMEM43LZE20THumanEsophagusESCC8.66e-086.39e-020.0662
79188TMEM43LZE21D1HumanEsophagusHGIN4.33e-029.46e-020.0632
79188TMEM43LZE22D1HumanEsophagusHGIN2.02e-03-6.72e-020.0595
79188TMEM43LZE24THumanEsophagusESCC8.12e-091.94e-010.0596
79188TMEM43LZE21THumanEsophagusESCC2.19e-041.81e-010.0655
79188TMEM43LZE6THumanEsophagusESCC1.27e-021.70e-010.0845
79188TMEM43P1T-EHumanEsophagusESCC2.09e-061.95e-010.0875
79188TMEM43P2T-EHumanEsophagusESCC1.10e-162.39e-010.1177
79188TMEM43P4T-EHumanEsophagusESCC8.94e-184.28e-010.1323
79188TMEM43P5T-EHumanEsophagusESCC2.45e-246.17e-010.1327
79188TMEM43P8T-EHumanEsophagusESCC1.64e-151.79e-010.0889
79188TMEM43P9T-EHumanEsophagusESCC1.40e-272.06e-010.1131
79188TMEM43P10T-EHumanEsophagusESCC9.62e-274.03e-010.116
79188TMEM43P11T-EHumanEsophagusESCC1.15e-206.80e-010.1426
79188TMEM43P12T-EHumanEsophagusESCC2.02e-326.42e-010.1122
Page: 1 2 3 4 5 6 7 

check button Transcriptomic changes along malignancy continuum.
TissueExpression DynamicsAbbreviation
EsophagusThe image shows the transcriptomic changes along malignancy continuum.log2FC in expression of this searched gene in stem-like cells from each diseased tissue sample relative to stem-like cells in normal samples in each tissue plotted against the malignancy continuum. Samples are colored based on if they are from different disease stage.
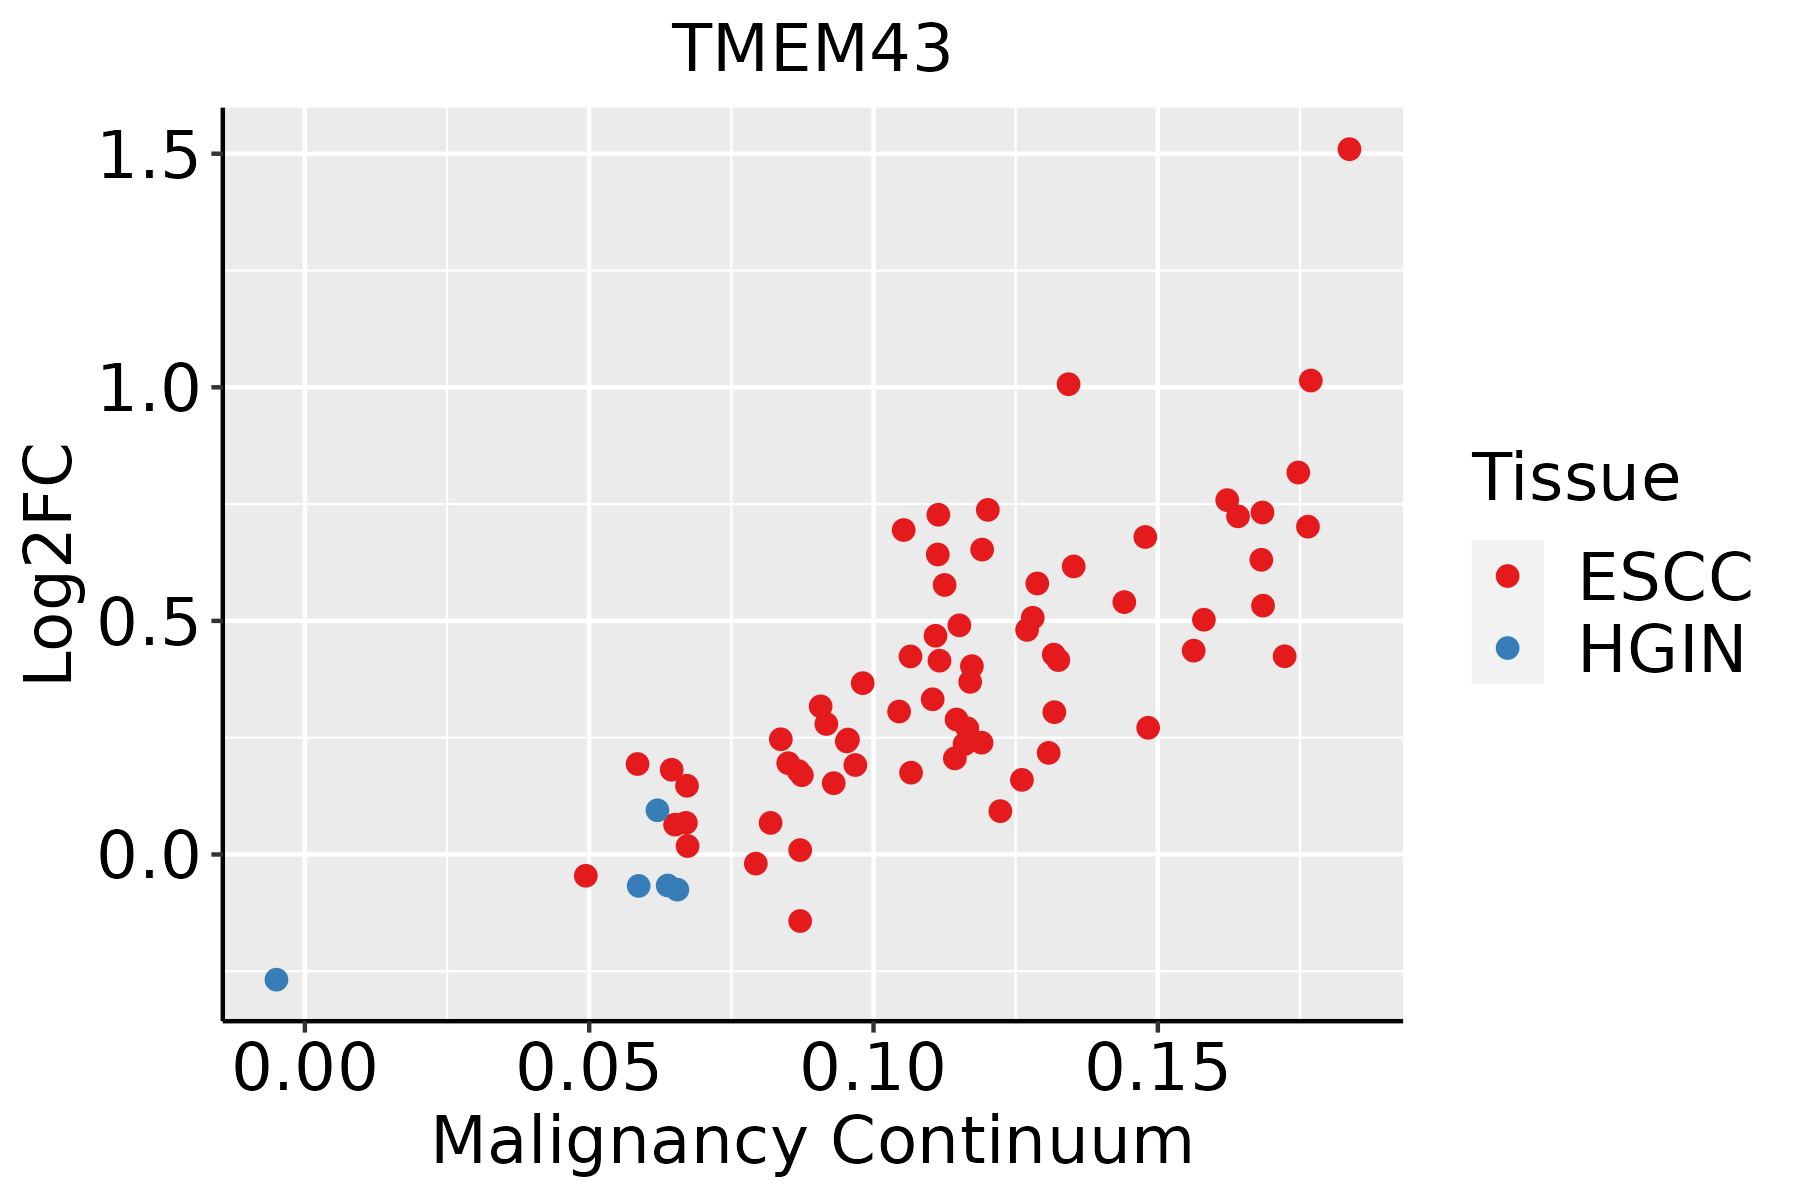
ESCC: Esophageal squamous cell carcinoma
HGIN: High-grade intraepithelial neoplasias
LGIN: Low-grade intraepithelial neoplasias
LiverThe image shows the transcriptomic changes along malignancy continuum.log2FC in expression of this searched gene in stem-like cells from each diseased tissue sample relative to stem-like cells in normal samples in each tissue plotted against the malignancy continuum. Samples are colored based on if they are from different disease stage.HCC: Hepatocellular carcinoma
NAFLD: Non-alcoholic fatty liver disease
Oral CavityThe image shows the transcriptomic changes along malignancy continuum.log2FC in expression of this searched gene in stem-like cells from each diseased tissue sample relative to stem-like cells in normal samples in each tissue plotted against the malignancy continuum. Samples are colored based on if they are from different disease stage.
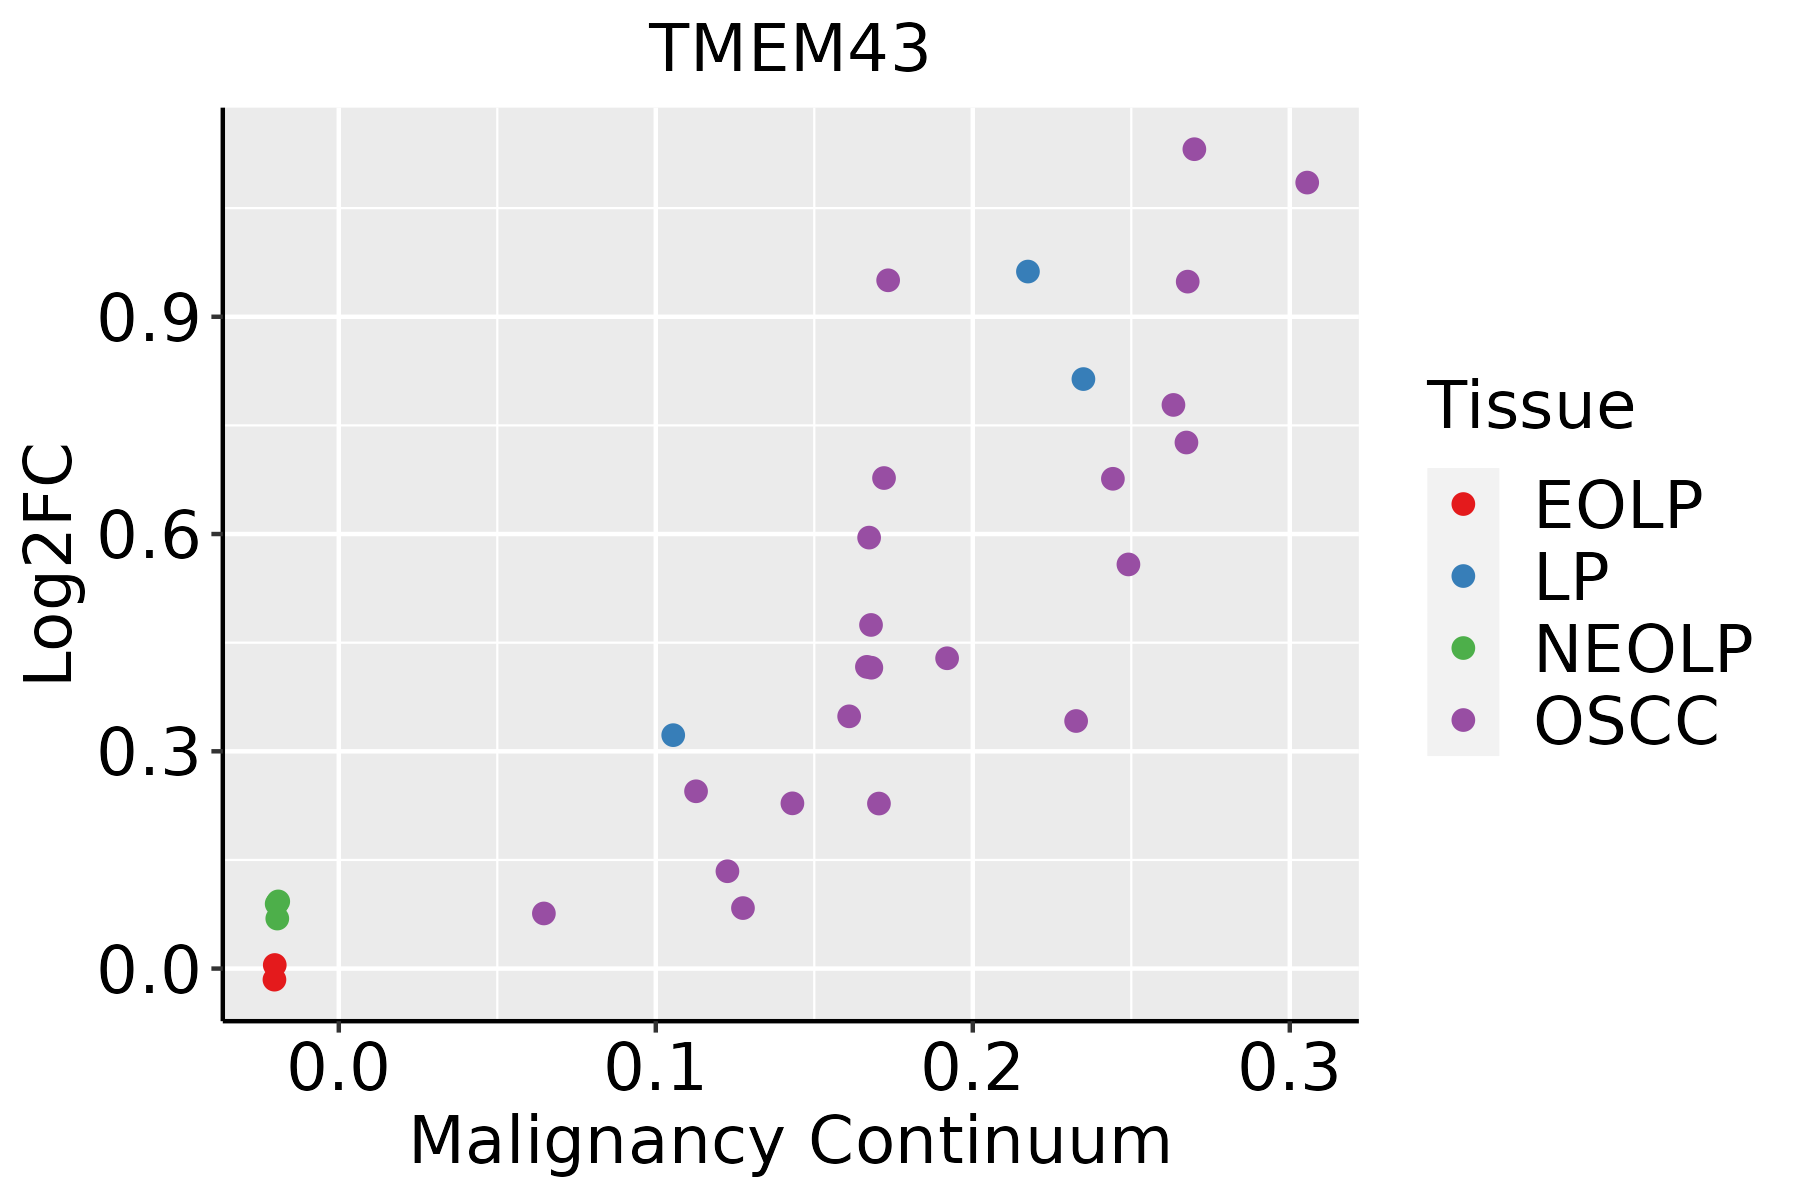
EOLP: Erosive Oral lichen planus
LP: leukoplakia
NEOLP: Non-erosive oral lichen planus
OSCC: Oral squamous cell carcinoma
ProstateThe image shows the transcriptomic changes along malignancy continuum.log2FC in expression of this searched gene in stem-like cells from each diseased tissue sample relative to stem-like cells in normal samples in each tissue plotted against the malignancy continuum. Samples are colored based on if they are from different disease stage.
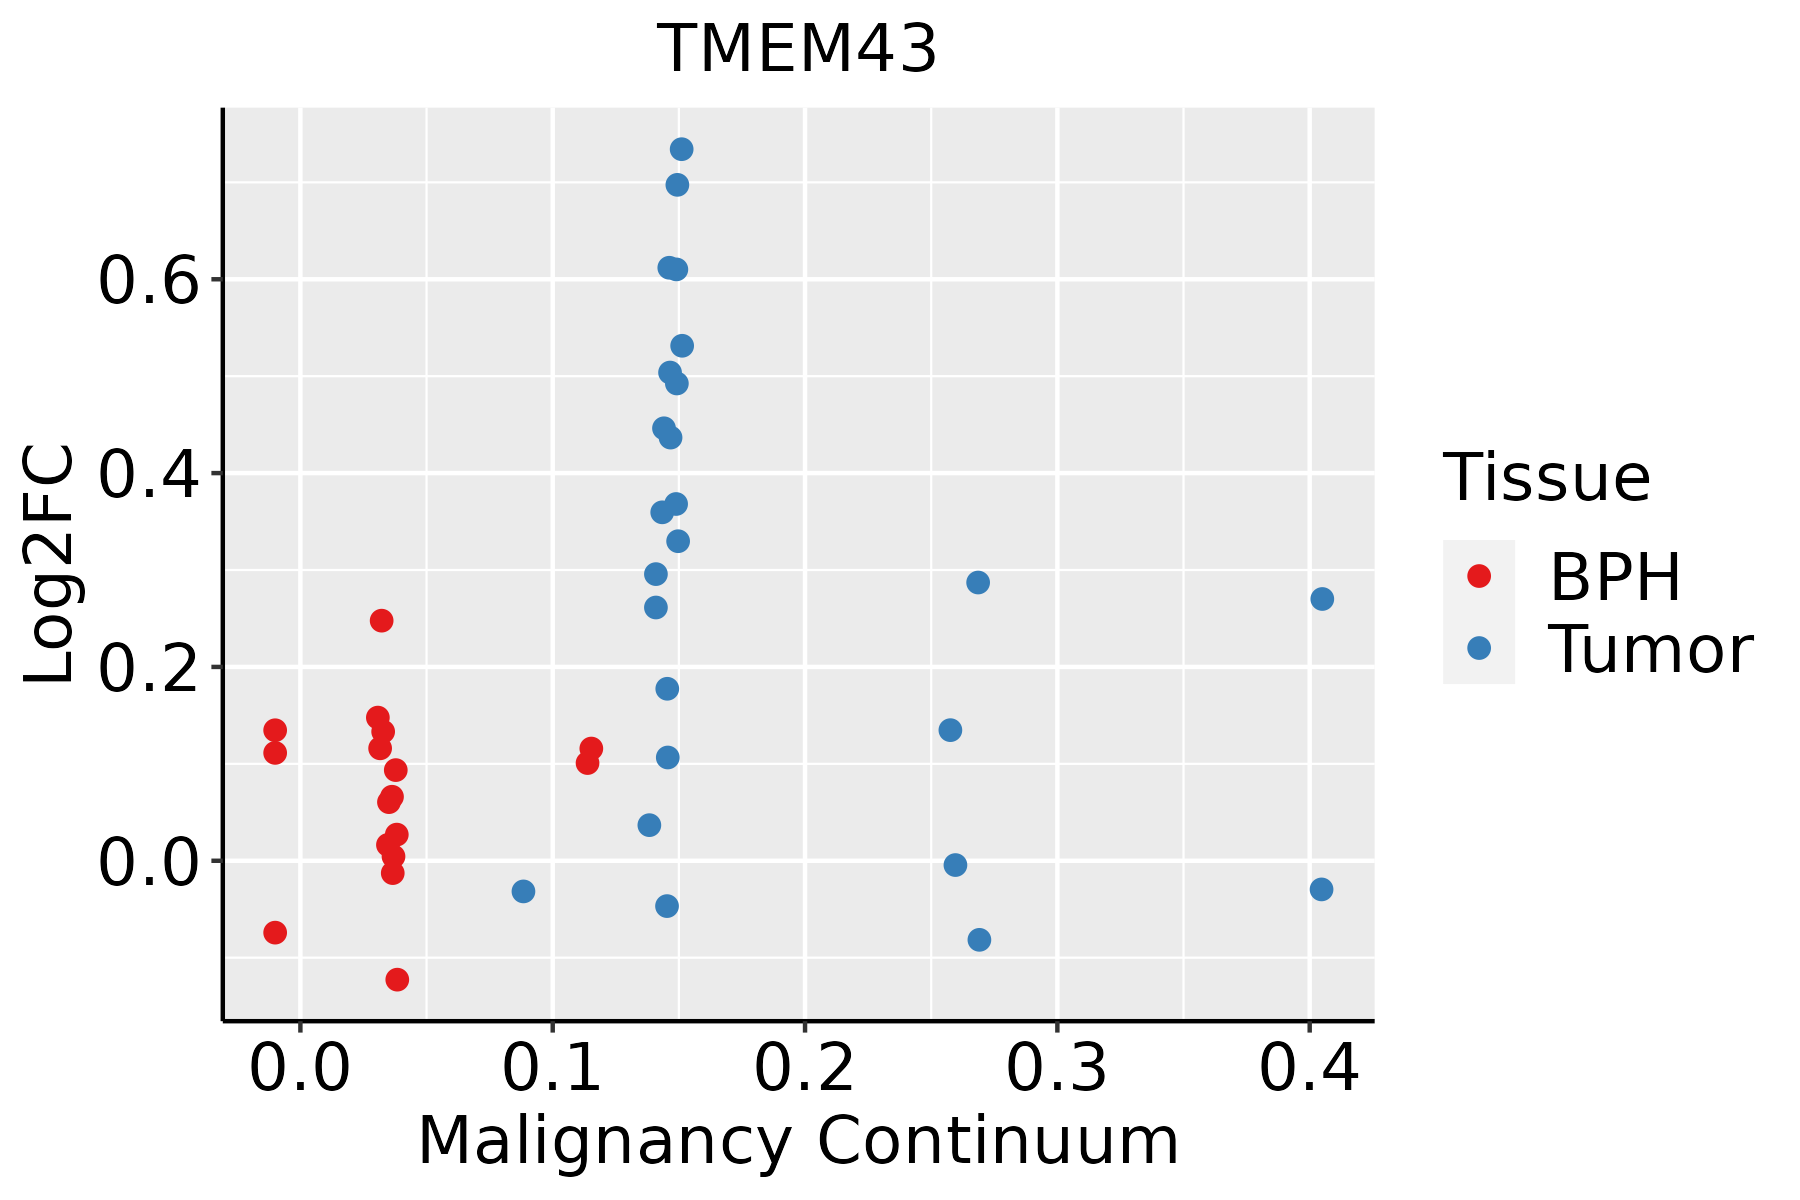
BPH: Benign Prostatic Hyperplasia
SkinThe image shows the transcriptomic changes along malignancy continuum.log2FC in expression of this searched gene in stem-like cells from each diseased tissue sample relative to stem-like cells in normal samples in each tissue plotted against the malignancy continuum. Samples are colored based on if they are from different disease stage.
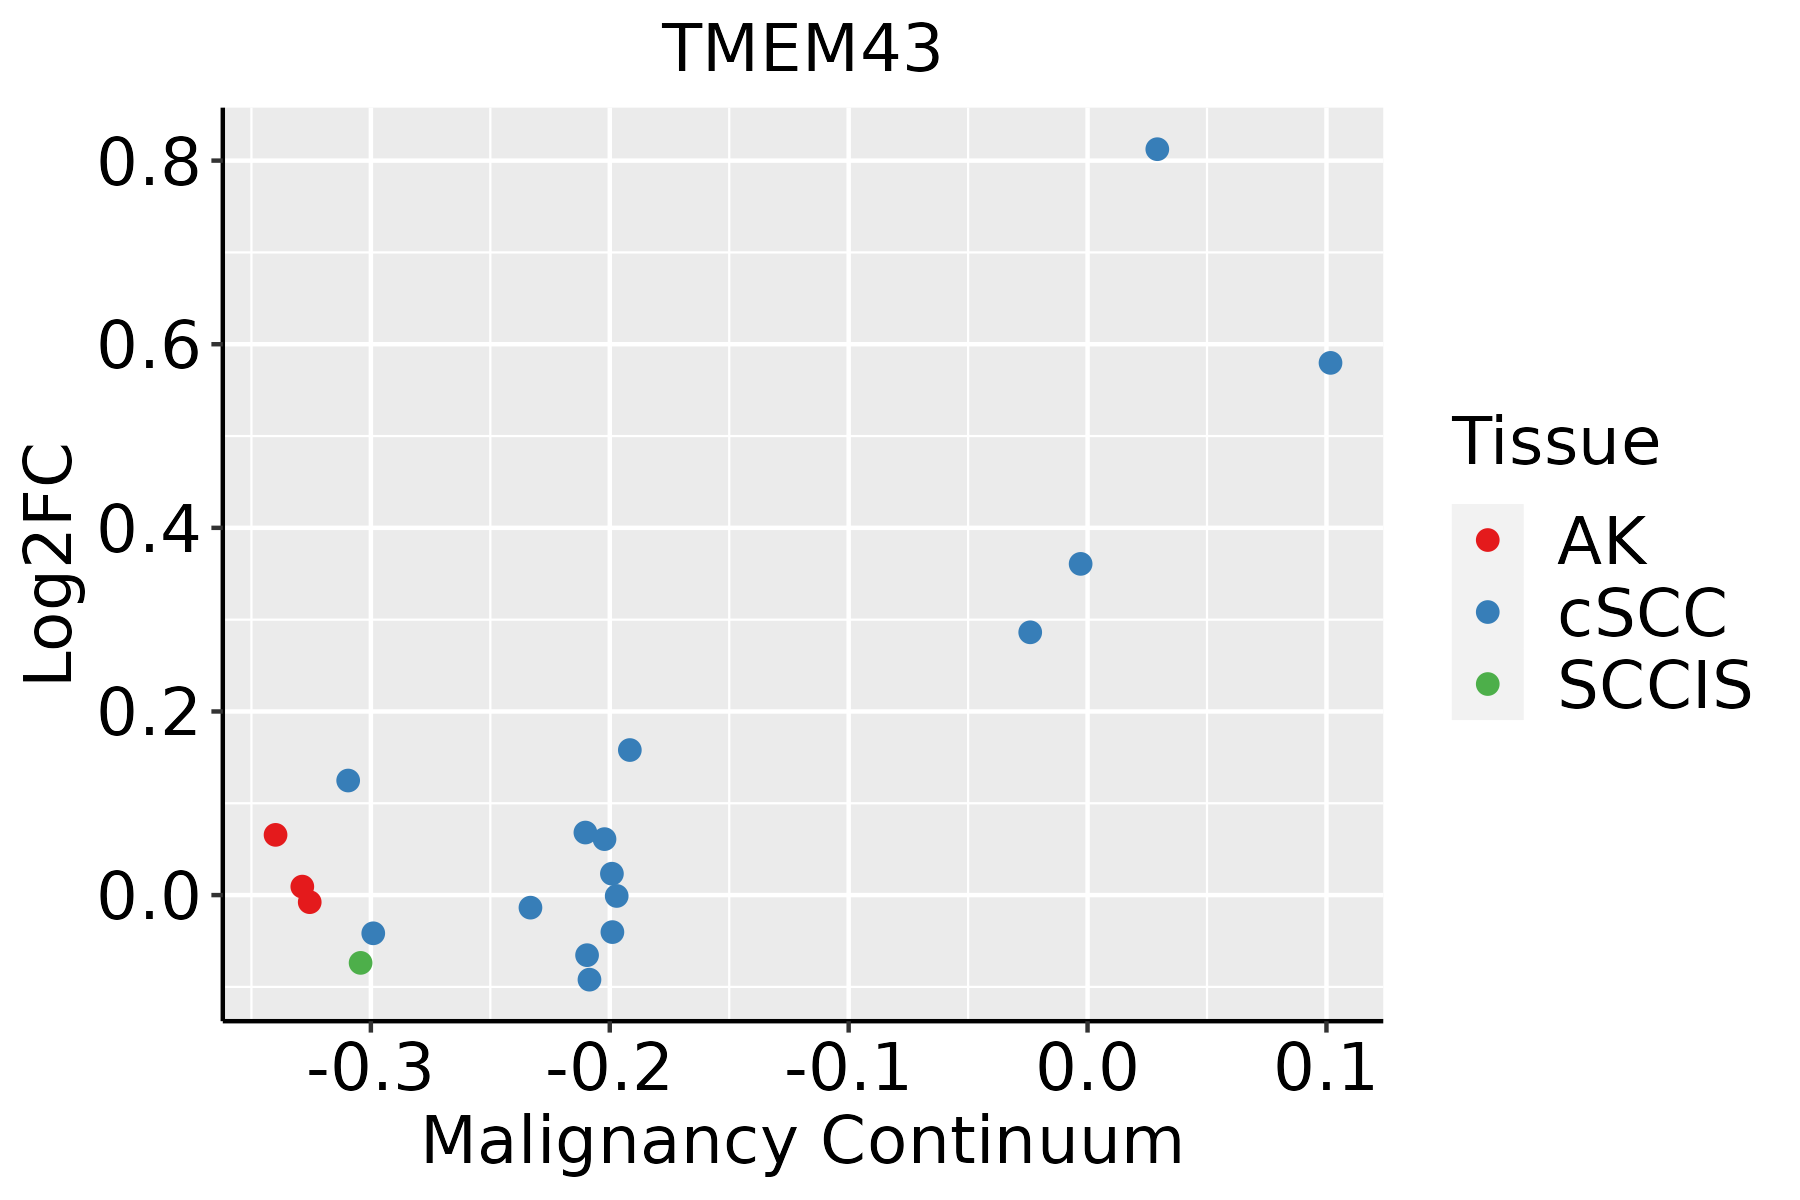
AK: Actinic keratosis
cSCC: Cutaneous squamous cell carcinoma
SCCIS:squamous cell carcinoma in situ
ThyroidThe image shows the transcriptomic changes along malignancy continuum.log2FC in expression of this searched gene in stem-like cells from each diseased tissue sample relative to stem-like cells in normal samples in each tissue plotted against the malignancy continuum. Samples are colored based on if they are from different disease stage.ATC: Anaplastic thyroid cancer
HT: Hashimoto's thyroiditis
PTC: Papillary thyroid cancer
∗log2FC in expression of this searched gene in stem-like cells from each diseased tissue sample relative to stem-like cells in normal samples in each tissue plotted against the malignancy continuum. Samples are colored based on if they are from different disease stage.

Top

Malignant transformation related pathway analysis

check buttonFind out the enriched GO biological processes and KEGG pathways involved in transition from healthy to precancer to cancer
check button Figure of enriched GO biological processes.
TissueDisease StageEnriched GO biological Processes
ColorectumADGO analysis - Figure of enriched GO biological processes: Top 15 enriched GO BP terms are showed in the bar plot of each disease state in each tissue. Each row represents a significant GO biological process which is colored according to the -log10(p.adjust).
ColorectumSERGO analysis - Figure of enriched GO biological processes: Top 15 enriched GO BP terms are showed in the bar plot of each disease state in each tissue. Each row represents a significant GO biological process which is colored according to the -log10(p.adjust).
ColorectumMSSGO analysis - Figure of enriched GO biological processes: Top 15 enriched GO BP terms are showed in the bar plot of each disease state in each tissue. Each row represents a significant GO biological process which is colored according to the -log10(p.adjust).
ColorectumMSI-HGO analysis - Figure of enriched GO biological processes: Top 15 enriched GO BP terms are showed in the bar plot of each disease state in each tissue. Each row represents a significant GO biological process which is colored according to the -log10(p.adjust).
ColorectumFAPGO analysis - Figure of enriched GO biological processes: Top 15 enriched GO BP terms are showed in the bar plot of each disease state in each tissue. Each row represents a significant GO biological process which is colored according to the -log10(p.adjust).
∗Top 15 enriched GO BP terms are showed in the bar plot of each disease state in each tissue. Each row represents a significant GO biological process which is colored according to the -log10(p.adjust).
Page: 1 2 3 4 5 6 7 8 9 

check button Enriched GO biological processes.
GO IDTissueDisease StageDescriptionGene RatioBg Ratiopvaluep.adjustCount
GO:00069975EsophagusHGINnucleus organization34/2587133/187232.20e-044.00e-0334
GO:00717634EsophagusHGINnuclear membrane organization12/258733/187239.97e-041.25e-0212
GO:00069983EsophagusHGINnuclear envelope organization14/258747/187233.49e-033.23e-0214
GO:000699713EsophagusESCCnucleus organization96/8552133/187234.66e-101.21e-0896
GO:000699811EsophagusESCCnuclear envelope organization39/855247/187231.48e-072.35e-0639
GO:007176312EsophagusESCCnuclear membrane organization29/855233/187235.30e-077.04e-0629
GO:0006997LiverCirrhoticnucleus organization48/4634133/187232.27e-031.38e-0248
GO:0071763LiverCirrhoticnuclear membrane organization15/463433/187237.61e-033.60e-0215
GO:00717631LiverHCCnuclear membrane organization27/795833/187234.31e-065.50e-0527
GO:00069971LiverHCCnucleus organization82/7958133/187236.32e-067.72e-0582
GO:0006998LiverHCCnuclear envelope organization34/795847/187233.27e-053.29e-0434
GO:00069974Oral cavityOSCCnucleus organization85/7305133/187235.12e-091.12e-0785
GO:00717633Oral cavityOSCCnuclear membrane organization29/730533/187238.40e-091.76e-0729
GO:00069982Oral cavityOSCCnuclear envelope organization37/730547/187233.19e-086.12e-0737
GO:007176311Oral cavityLPnuclear membrane organization18/462333/187232.26e-042.41e-0318
GO:00069981Oral cavityLPnuclear envelope organization23/462347/187232.74e-042.84e-0323
GO:000699712Oral cavityLPnucleus organization51/4623133/187233.22e-043.26e-0351
GO:00069972ProstateBPHnucleus organization38/3107133/187233.69e-042.72e-0338
GO:000699711ProstateTumornucleus organization38/3246133/187238.78e-045.89e-0338
GO:00069976SkincSCCnucleus organization62/4864133/187232.21e-074.72e-0662
Page: 1 2 

check button Enriched KEGG pathways.
Pathway IDTissueDisease StageDescriptionGene RatioBg Ratiopvaluep.adjustqvalueCount
Page: 1 

Top

Cell-cell communication analysis

check buttonIdentification of potential cell-cell interactions between two cell types and their ligand-receptor pairs for different disease states
LigandReceptorLRpairPathwayTissueDisease Stage
Page: 1 

Top

Single-cell gene regulatory network inference analysis

check buttonFind out the significant the regulons (TFs) and the target genes of each regulon across cell types for different disease states
TFCell TypeTissueDisease StageTarget GeneRSSRegulon Activity
∗The dot plots of a searched regulon are shown for all cell subpopulations in each disease state of each tissue based on the regulon specific score inferred using pySCENIC and by calculating the average expression.
Page: 1 

Top

Somatic mutation of malignant transformation related genes

check buttonAnnotation of somatic variants for genes involved in malignant transformation
Hugo SymbolVariant ClassVariant ClassificationdbSNP RSHGVScHGVSpHGVSp ShortSWISSPROTBIOTYPESIFTPolyPhenTumor Sample BarcodeTissueHistologySexAgeStageTherapy TypesDrugsOutcome
TMEM43SNVMissense_Mutationnovelc.797N>Tp.Arg266Leup.R266LQ9BTV4protein_codingdeleterious(0.04)benign(0.212)TCGA-A2-A25A-01Breastbreast invasive carcinomaFemale<65I/IIUnspecificCytoxanSD
TMEM43insertionNonsense_Mutationnovelc.1077_1078insGGTGCACATGGTGCCTAACACAGGCAACGTTCAGAAp.Leu359_Thr360insGlyAlaHisGlyAlaTerHisArgGlnArgSerGlup.L359_T360insGAHGA*HRQRSEQ9BTV4protein_codingTCGA-B6-A0I5-01Breastbreast invasive carcinomaFemale<65I/IIUnknownUnknownSD
TMEM43SNVMissense_Mutationnovelc.179C>Tp.Thr60Metp.T60MQ9BTV4protein_codingtolerated(0.07)possibly_damaging(0.534)TCGA-2W-A8YY-01Cervixcervical & endocervical cancerFemale<65I/IIChemotherapycisplatinCR
TMEM43SNVMissense_Mutationc.196G>Ap.Glu66Lysp.E66KQ9BTV4protein_codingdeleterious(0)possibly_damaging(0.706)TCGA-Q1-A73O-01Cervixcervical & endocervical cancerFemale<65I/IIChemotherapycisplatinCR
TMEM43SNVMissense_Mutationc.882N>Tp.Glu294Aspp.E294DQ9BTV4protein_codingdeleterious(0.02)possibly_damaging(0.492)TCGA-AZ-6601-01Colorectumcolon adenocarcinomaMale>=65I/IIUnknownUnknownPD
TMEM43SNVMissense_Mutationrs138764471c.223G>Ap.Asp75Asnp.D75NQ9BTV4protein_codingtolerated(0.38)benign(0)TCGA-AG-3893-01Colorectumrectum adenocarcinomaMale>=65III/IVChemotherapyfolinicCR
TMEM43SNVMissense_Mutationc.944N>Cp.Gly315Alap.G315AQ9BTV4protein_codingdeleterious(0)probably_damaging(0.995)TCGA-AG-A01Y-01Colorectumrectum adenocarcinomaFemale<65I/IIChemotherapy5-fluorouracilCR
TMEM43SNVMissense_Mutationc.692C>Gp.Pro231Argp.P231RQ9BTV4protein_codingdeleterious(0)possibly_damaging(0.905)TCGA-AG-A026-01Colorectumrectum adenocarcinomaMale>=65I/IIUnknownUnknownPD
TMEM43SNVMissense_Mutationrs553757132c.515N>Tp.Ala172Valp.A172VQ9BTV4protein_codingtolerated(0.13)possibly_damaging(0.674)TCGA-A5-A0G2-01Endometriumuterine corpus endometrioid carcinomaFemale<65III/IVUnknownUnknownSD
TMEM43SNVMissense_Mutationnovelc.959N>Cp.Phe320Serp.F320SQ9BTV4protein_codingdeleterious(0)probably_damaging(0.995)TCGA-AJ-A3EL-01Endometriumuterine corpus endometrioid carcinomaFemale<65I/IIUnknownUnknownSD
Page: 1 2 3 

Top

Related drugs of malignant transformation related genes

check buttonIdentification of chemicals and drugs interact with genes involved in malignant transfromation
(DGIdb 4.0)
Entrez IDSymbolCategoryInteraction TypesDrug Claim NameDrug NamePMIDs
Page: 1