
|
|||||
|
 | |
| |
| |
| |
| |
| |
|
Gene: TMEM41B |
Gene summary for TMEM41B |
| Gene information | Species | Human | Gene symbol | TMEM41B | Gene ID | 440026 |
| Gene name | transmembrane protein 41B | |
| Gene Alias | TMEM41B | |
| Cytomap | 11p15.4 | |
| Gene Type | protein-coding | GO ID | GO:0000045 | UniProtAcc | Q5BJD5 |
Top |
Malignant transformation analysis |
| Identification of the aberrant gene expression in precancerous and cancerous lesions by comparing the gene expression of stem-like cells in diseased tissues with normal stem cells |
| Entrez ID | Symbol | Replicates | Species | Organ | Tissue | Adj P-value | Log2FC | Malignancy |
| 440026 | TMEM41B | LZE3D | Human | Esophagus | HGIN | 2.94e-05 | 4.78e-01 | 0.0668 |
| 440026 | TMEM41B | LZE4T | Human | Esophagus | ESCC | 8.94e-10 | 2.74e-01 | 0.0811 |
| 440026 | TMEM41B | LZE7T | Human | Esophagus | ESCC | 4.82e-06 | 3.64e-01 | 0.0667 |
| 440026 | TMEM41B | LZE8T | Human | Esophagus | ESCC | 3.77e-03 | 4.43e-02 | 0.067 |
| 440026 | TMEM41B | LZE20T | Human | Esophagus | ESCC | 3.31e-02 | -6.89e-02 | 0.0662 |
| 440026 | TMEM41B | LZE24T | Human | Esophagus | ESCC | 2.19e-17 | 5.23e-01 | 0.0596 |
| 440026 | TMEM41B | P1T-E | Human | Esophagus | ESCC | 1.07e-03 | 1.48e-01 | 0.0875 |
| 440026 | TMEM41B | P2T-E | Human | Esophagus | ESCC | 3.34e-25 | 2.58e-01 | 0.1177 |
| 440026 | TMEM41B | P4T-E | Human | Esophagus | ESCC | 2.92e-19 | 5.15e-01 | 0.1323 |
| 440026 | TMEM41B | P5T-E | Human | Esophagus | ESCC | 6.35e-19 | 1.71e-01 | 0.1327 |
| 440026 | TMEM41B | P8T-E | Human | Esophagus | ESCC | 3.54e-16 | 9.37e-02 | 0.0889 |
| 440026 | TMEM41B | P9T-E | Human | Esophagus | ESCC | 8.82e-18 | 4.27e-01 | 0.1131 |
| 440026 | TMEM41B | P10T-E | Human | Esophagus | ESCC | 4.25e-14 | 2.06e-01 | 0.116 |
| 440026 | TMEM41B | P11T-E | Human | Esophagus | ESCC | 6.78e-10 | 4.63e-01 | 0.1426 |
| 440026 | TMEM41B | P12T-E | Human | Esophagus | ESCC | 1.27e-16 | -2.44e-02 | 0.1122 |
| 440026 | TMEM41B | P15T-E | Human | Esophagus | ESCC | 3.15e-11 | 1.76e-01 | 0.1149 |
| 440026 | TMEM41B | P16T-E | Human | Esophagus | ESCC | 3.33e-15 | -1.01e-02 | 0.1153 |
| 440026 | TMEM41B | P17T-E | Human | Esophagus | ESCC | 7.86e-03 | 2.28e-02 | 0.1278 |
| 440026 | TMEM41B | P19T-E | Human | Esophagus | ESCC | 6.22e-04 | 2.91e-01 | 0.1662 |
| 440026 | TMEM41B | P20T-E | Human | Esophagus | ESCC | 9.47e-21 | 1.58e-01 | 0.1124 |
| Page: 1 2 3 4 5 6 7 8 |
| Tissue | Expression Dynamics | Abbreviation |
| Esophagus | 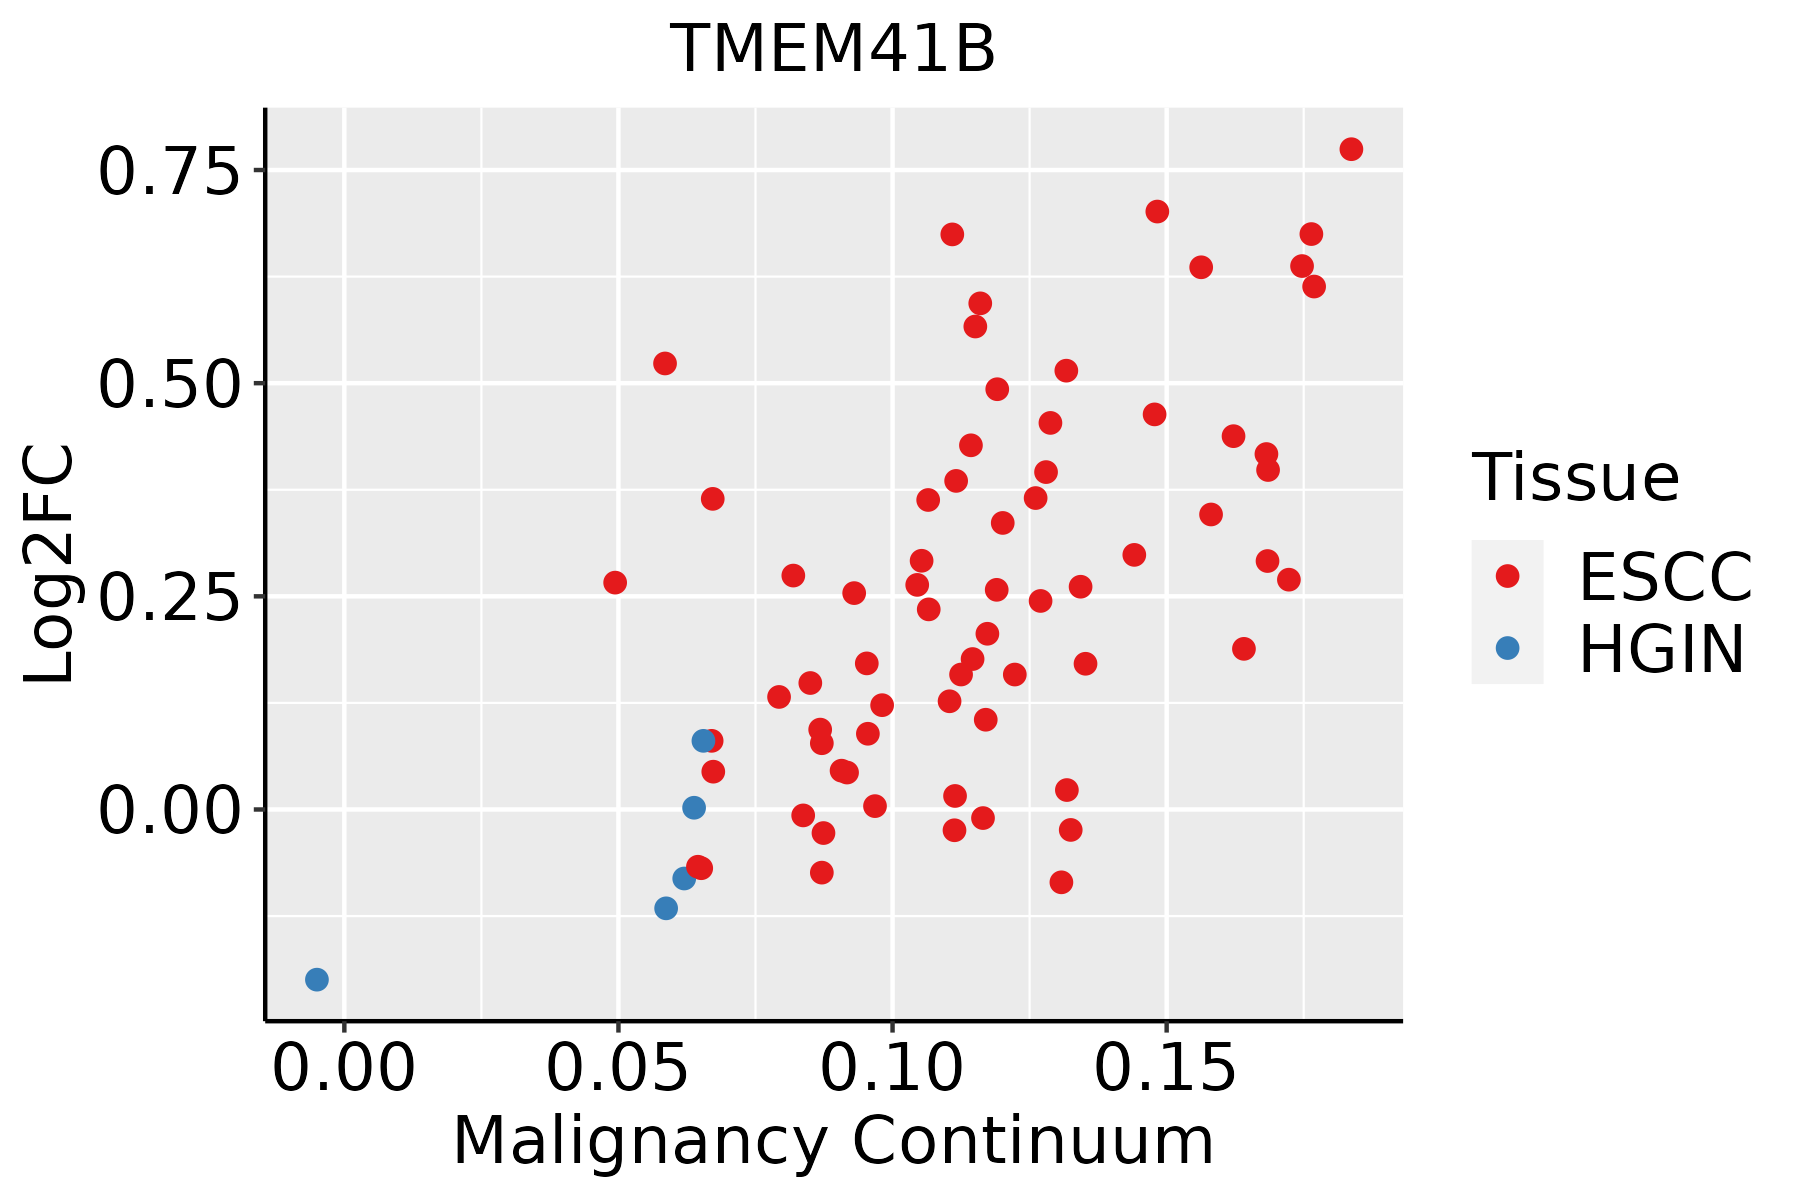 | ESCC: Esophageal squamous cell carcinoma |
| HGIN: High-grade intraepithelial neoplasias | ||
| LGIN: Low-grade intraepithelial neoplasias | ||
| Liver | 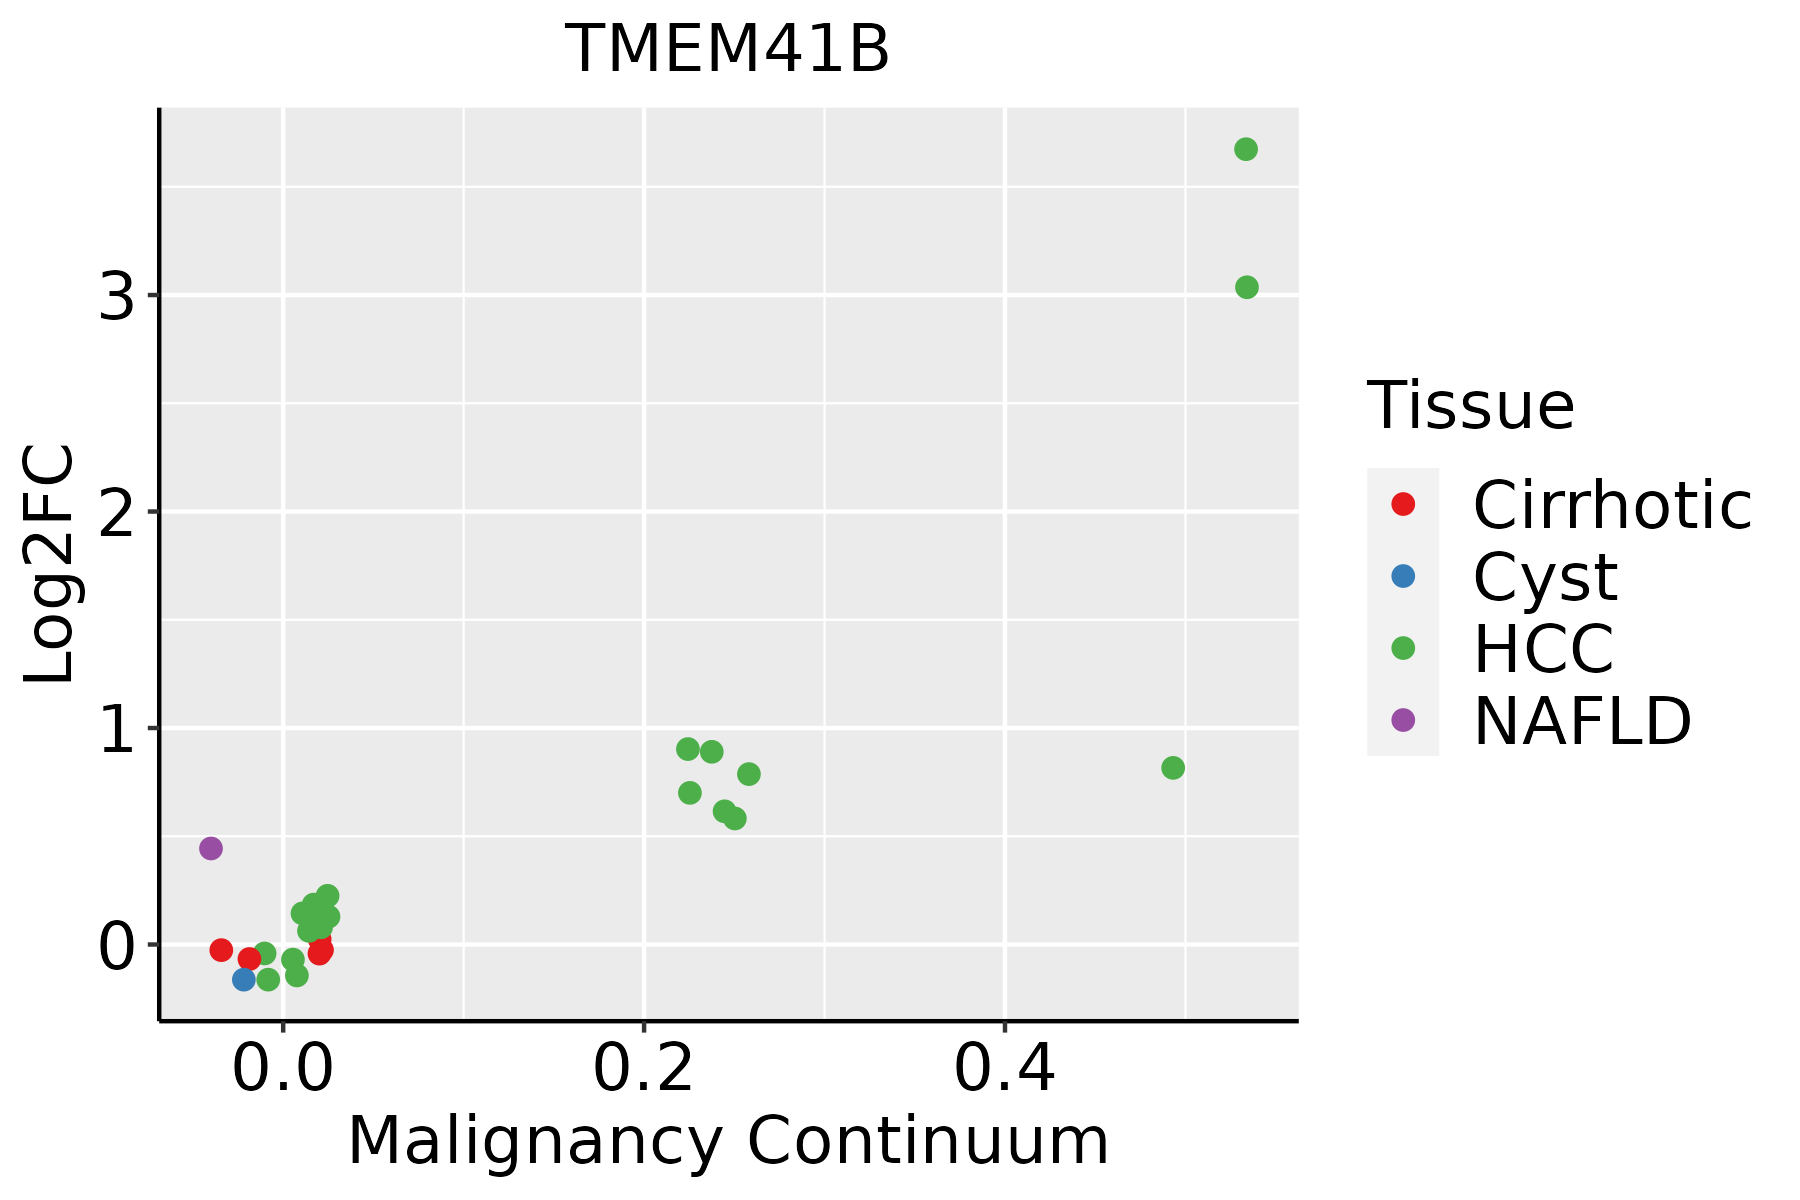 | HCC: Hepatocellular carcinoma |
| NAFLD: Non-alcoholic fatty liver disease | ||
| Lung | 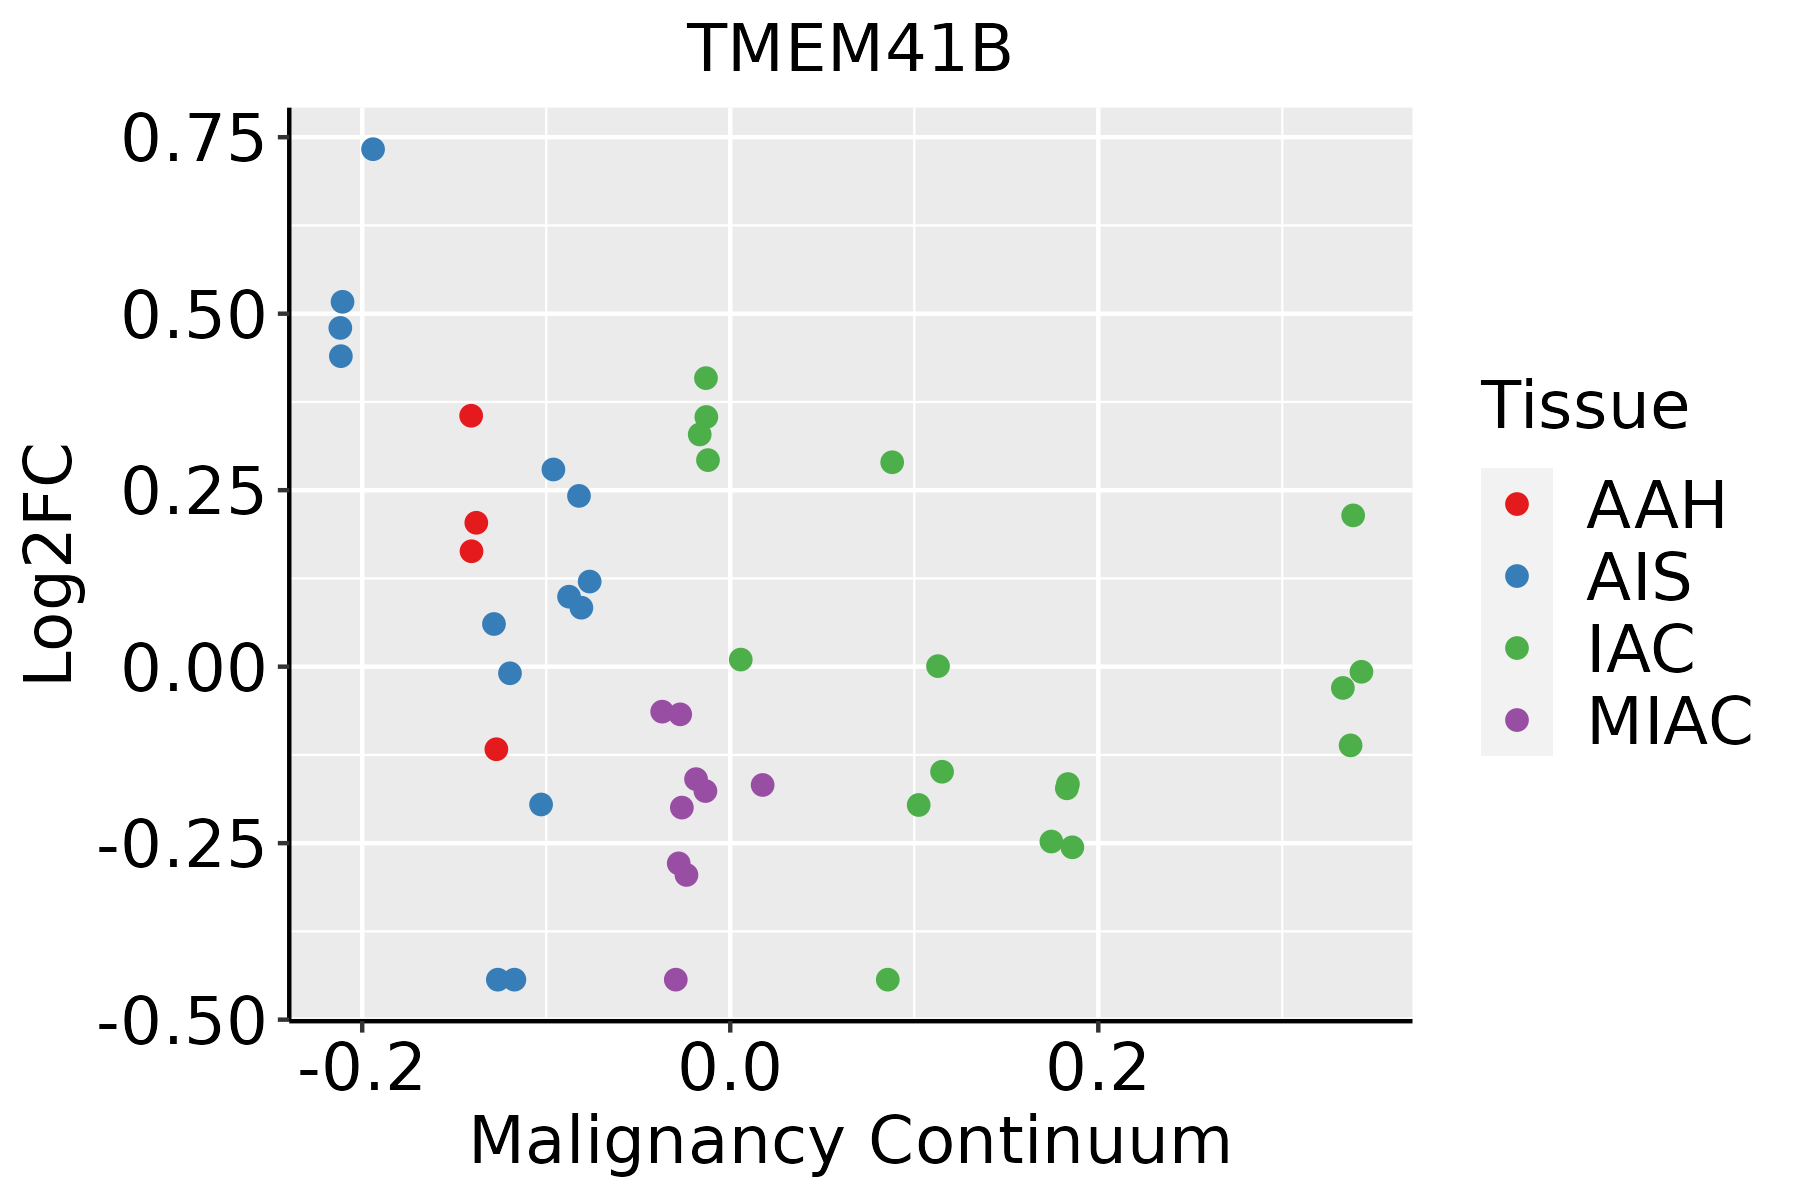 | AAH: Atypical adenomatous hyperplasia |
| AIS: Adenocarcinoma in situ | ||
| IAC: Invasive lung adenocarcinoma | ||
| MIA: Minimally invasive adenocarcinoma | ||
| Oral Cavity | 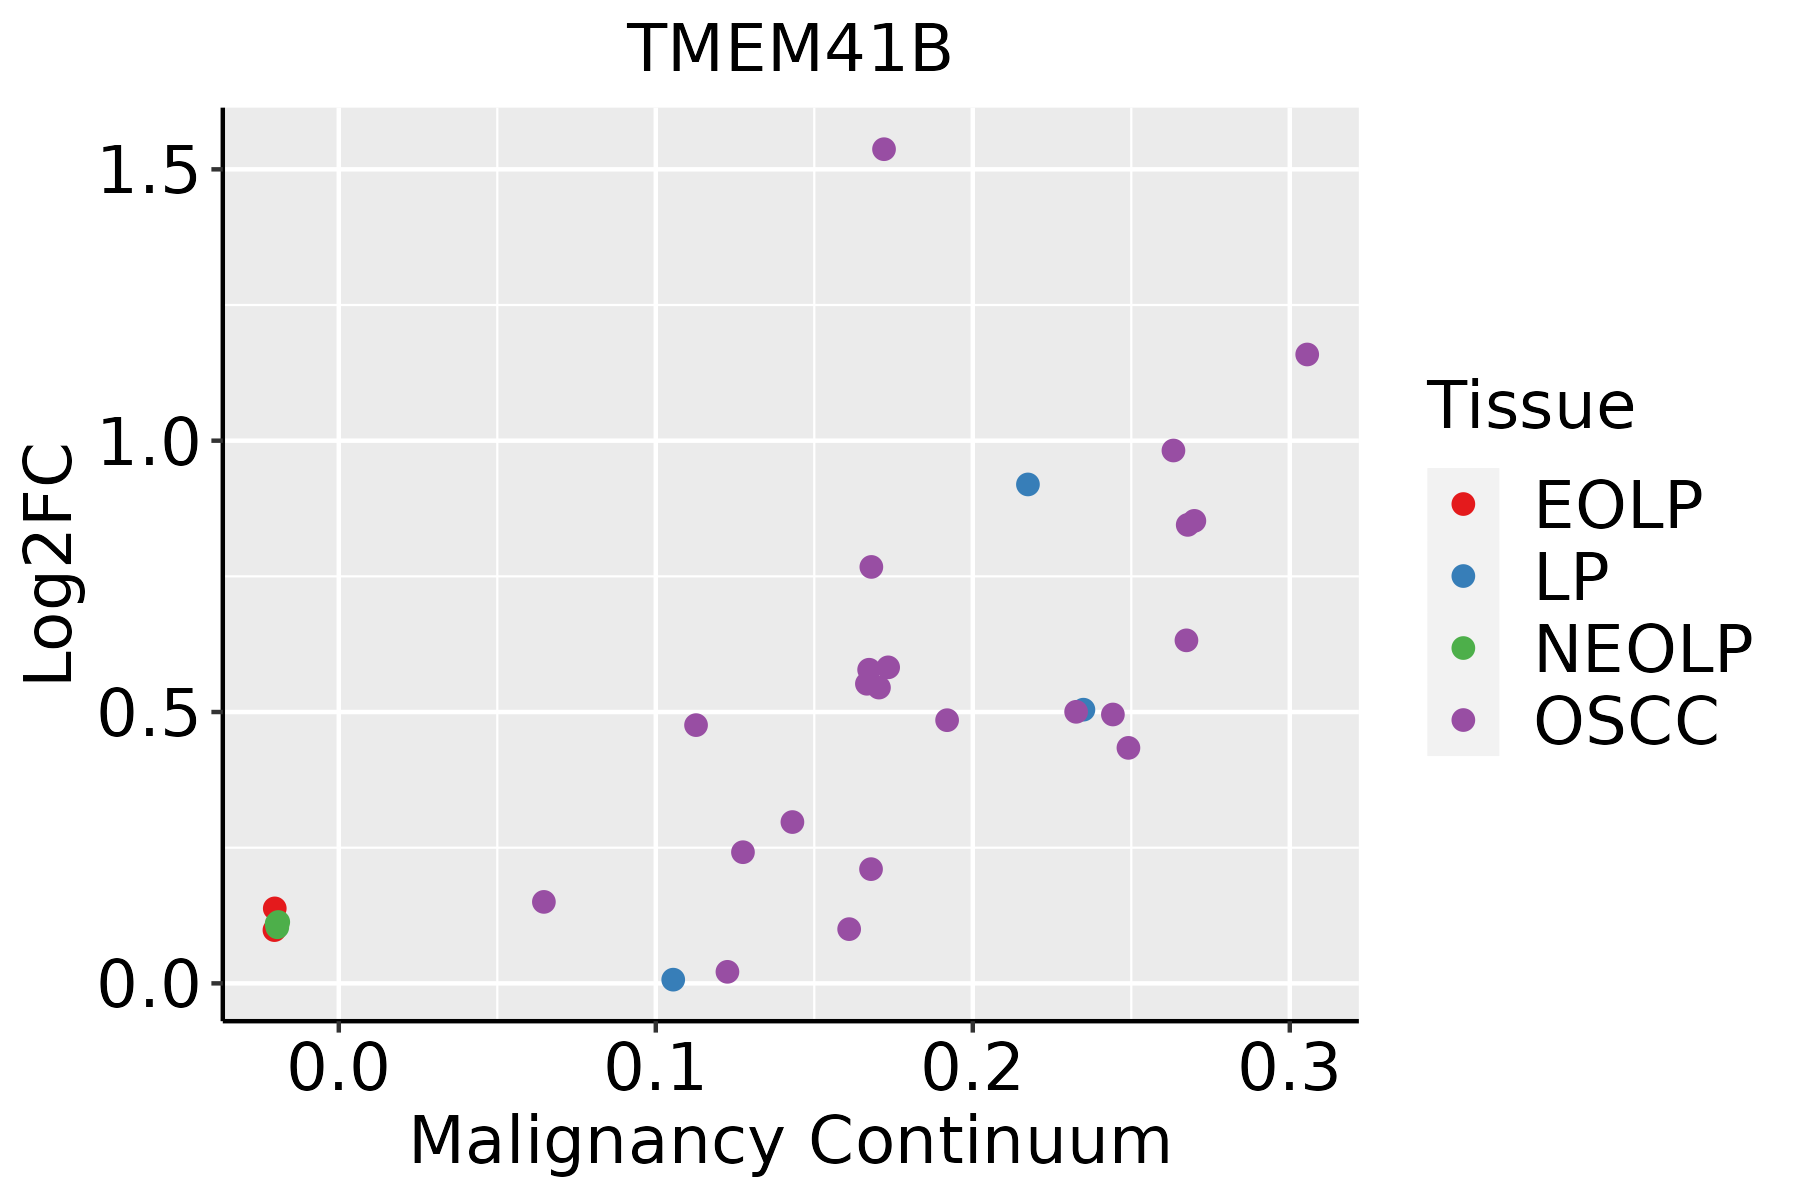 | EOLP: Erosive Oral lichen planus |
| LP: leukoplakia | ||
| NEOLP: Non-erosive oral lichen planus | ||
| OSCC: Oral squamous cell carcinoma | ||
| Prostate | 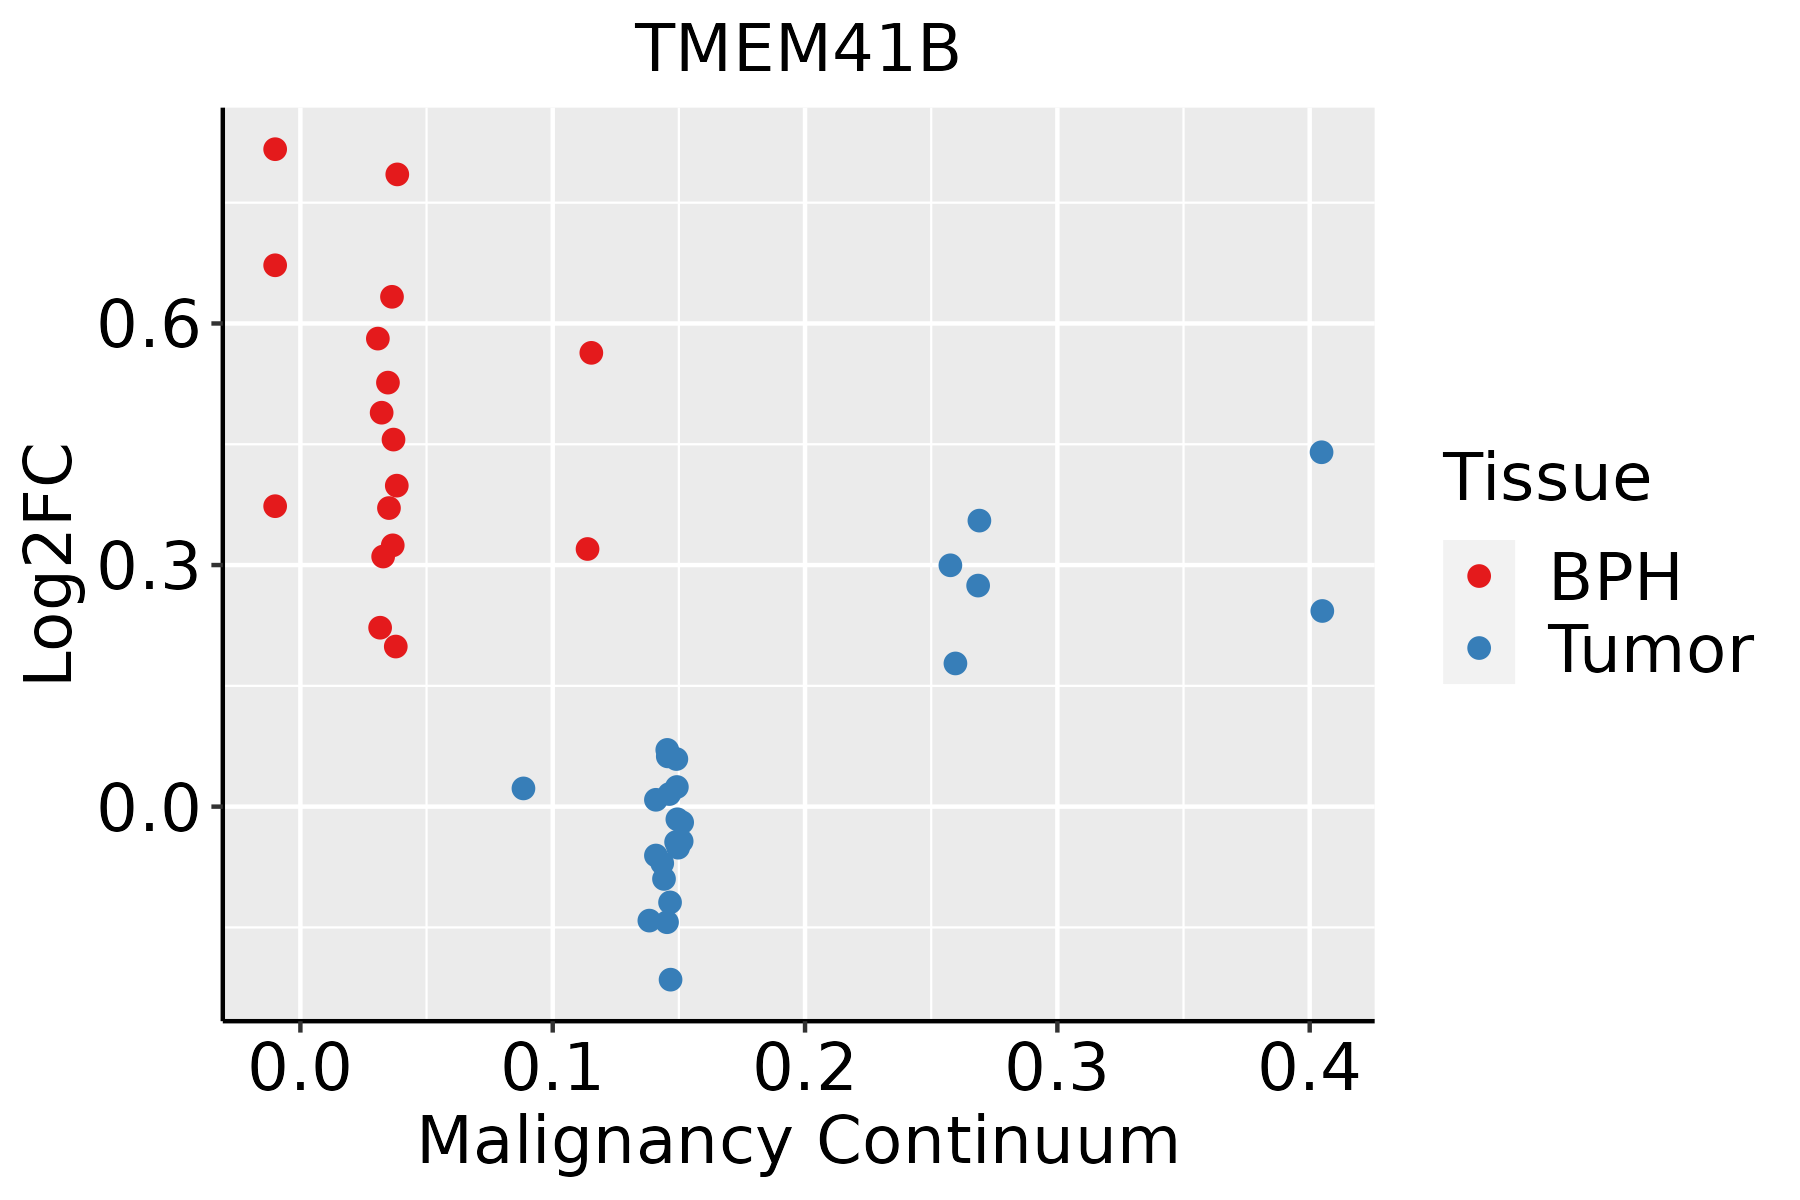 | BPH: Benign Prostatic Hyperplasia |
| Skin | 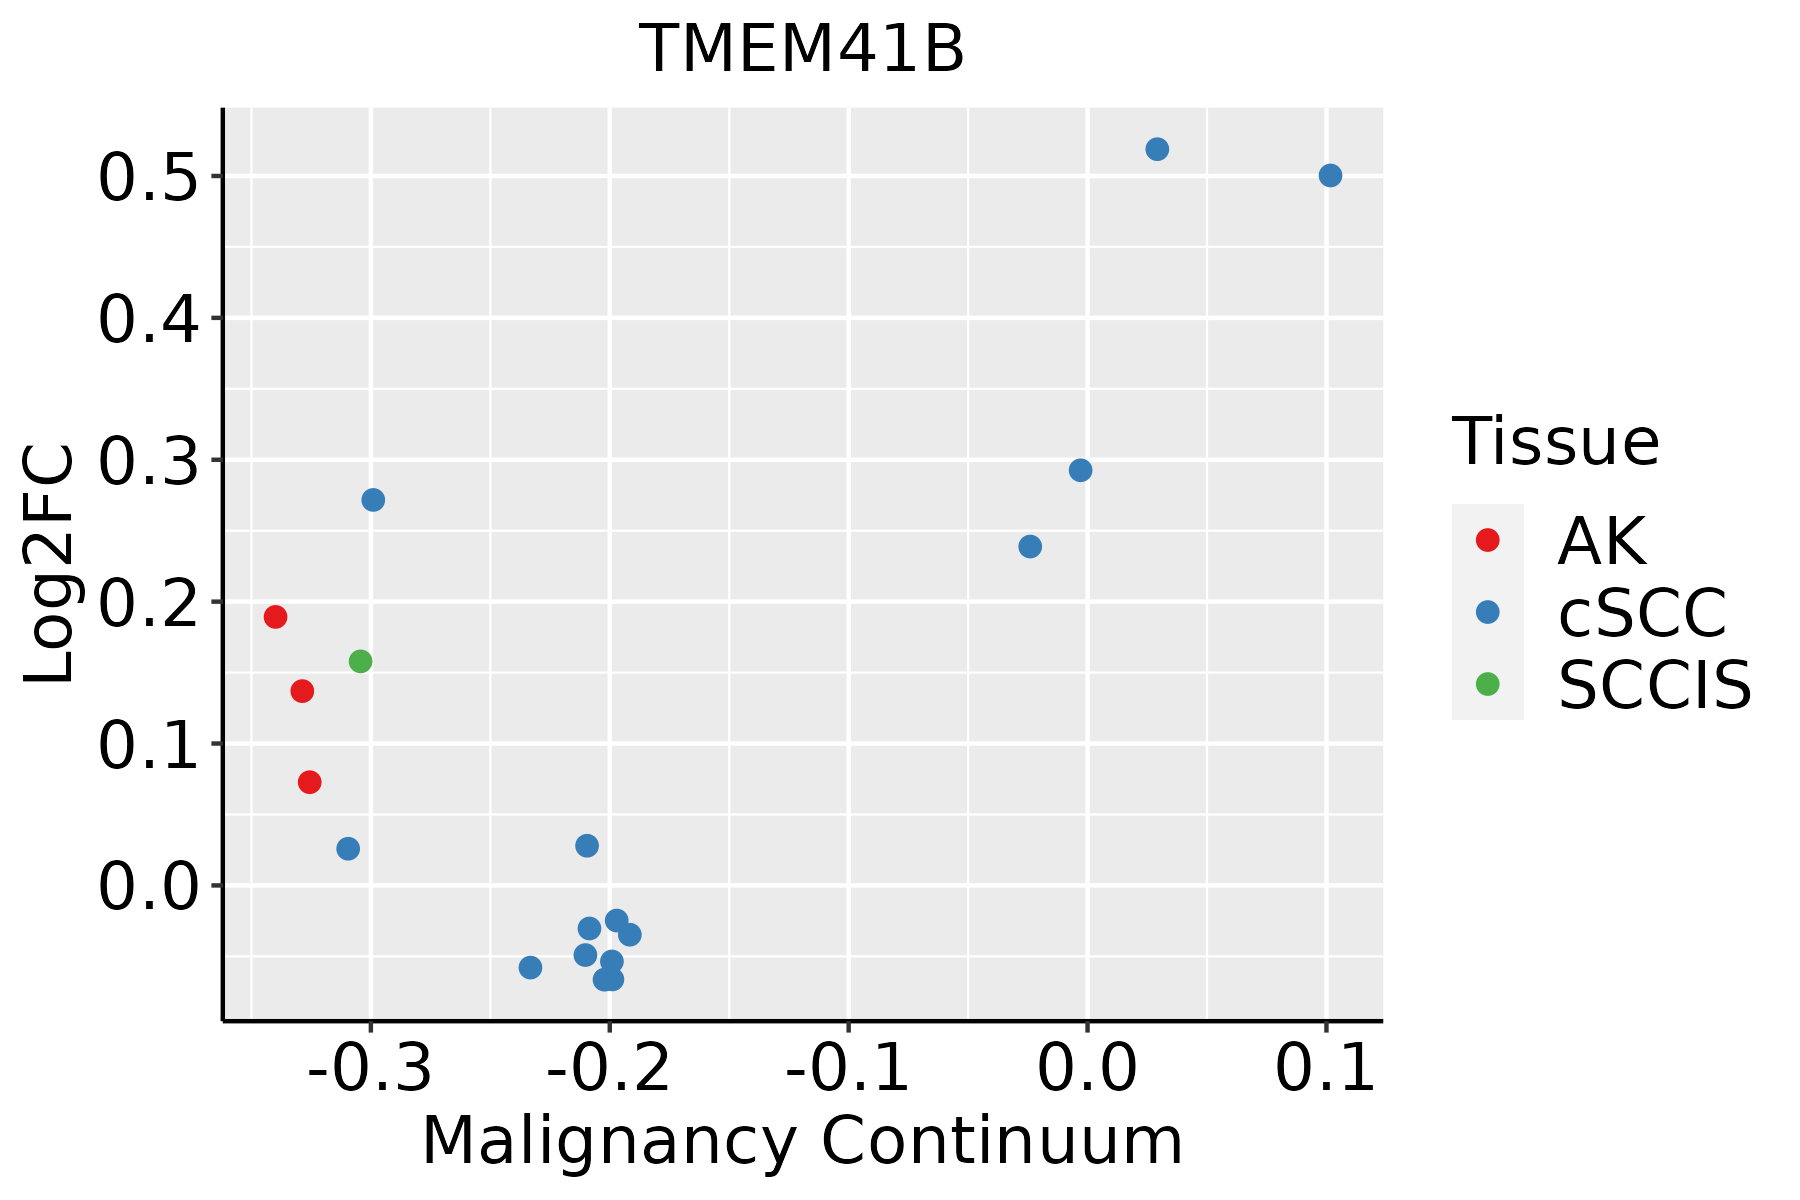 | AK: Actinic keratosis |
| cSCC: Cutaneous squamous cell carcinoma | ||
| SCCIS:squamous cell carcinoma in situ | ||
| Thyroid | 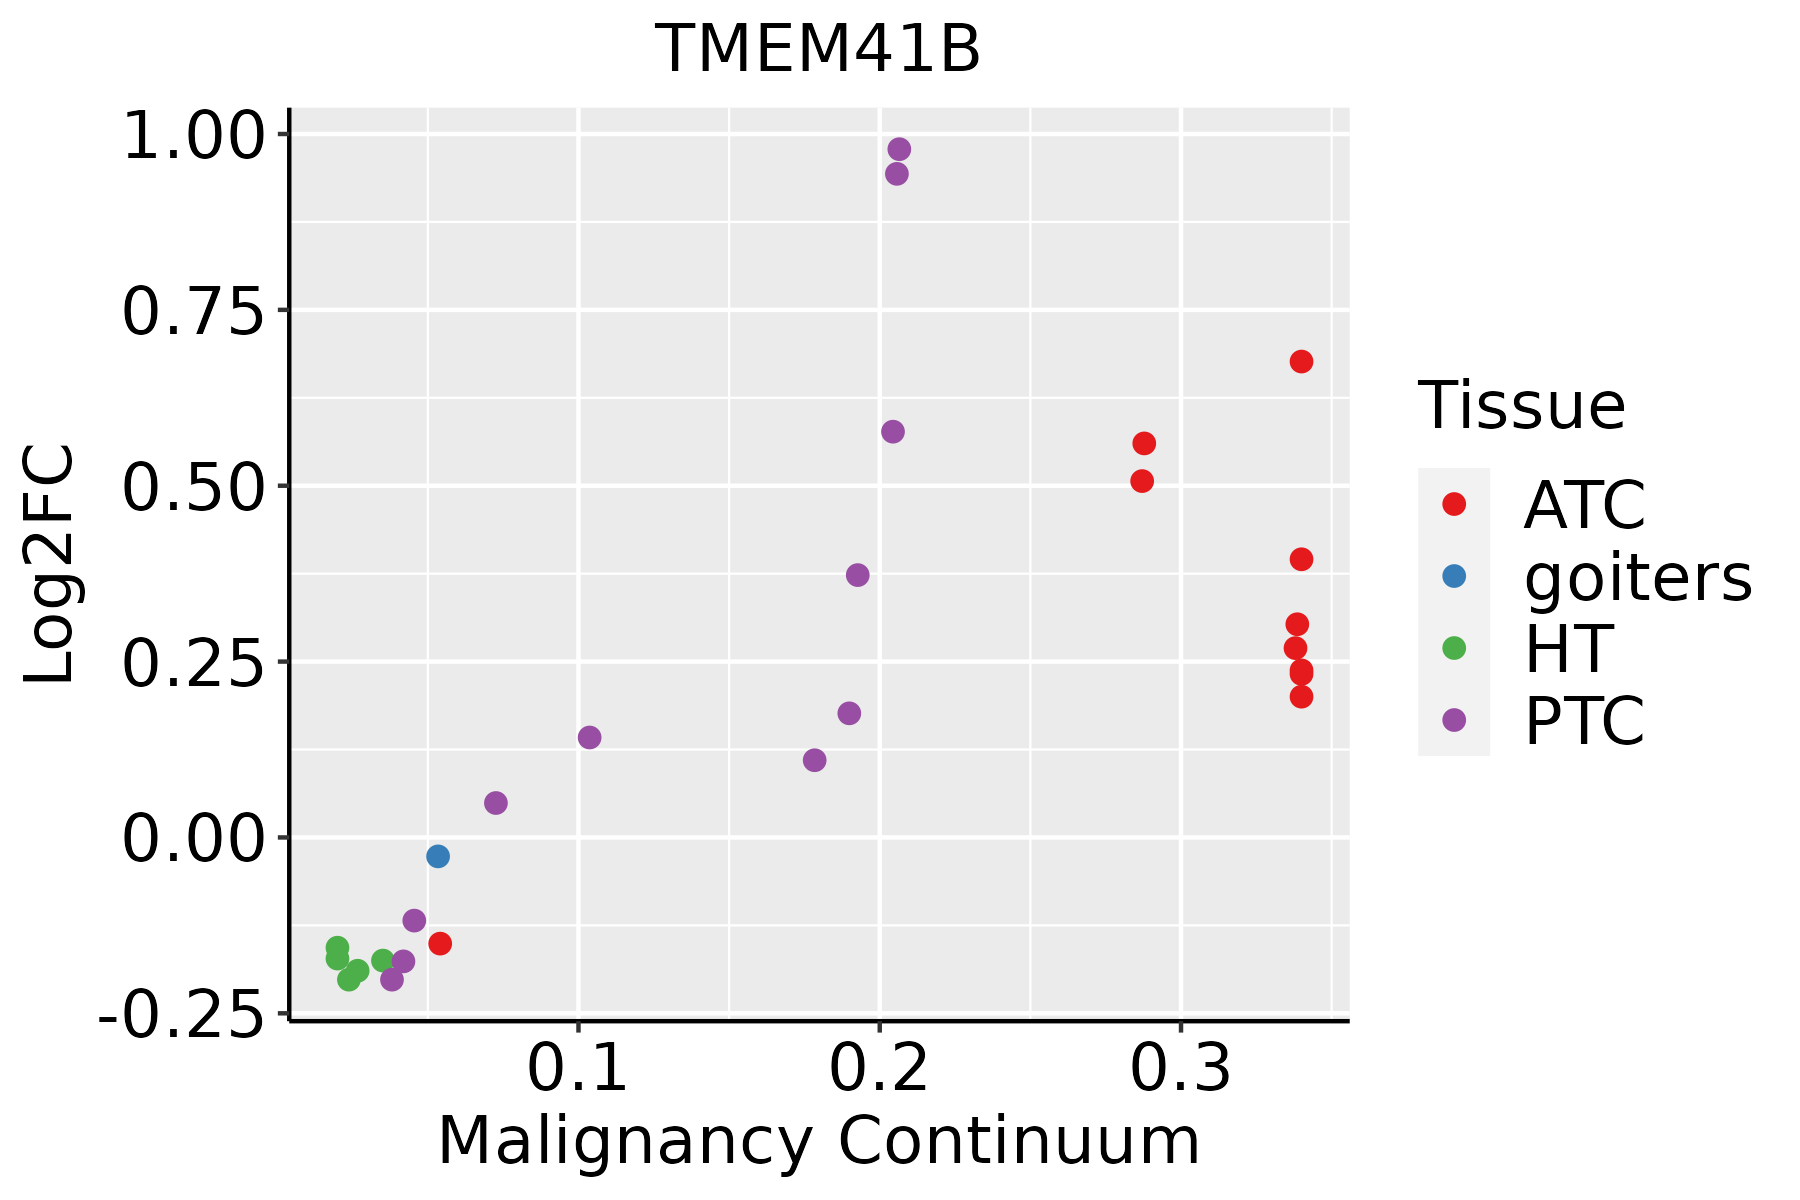 | ATC: Anaplastic thyroid cancer |
| HT: Hashimoto's thyroiditis | ||
| PTC: Papillary thyroid cancer |
| ∗log2FC in expression of this searched gene in stem-like cells from each diseased tissue sample relative to stem-like cells in normal samples in each tissue plotted against the malignancy continuum. Samples are colored based on if they are from different disease stage. |
Top |
Malignant transformation related pathway analysis |
| Find out the enriched GO biological processes and KEGG pathways involved in transition from healthy to precancer to cancer |
| Tissue | Disease Stage | Enriched GO biological Processes |
| Colorectum | AD |  |
| Colorectum | SER |  |
| Colorectum | MSS |  |
| Colorectum | MSI-H |  |
| Colorectum | FAP |  |
| ∗Top 15 enriched GO BP terms are showed in the bar plot of each disease state in each tissue. Each row represents a significant GO biological process which is colored according to the -log10(p.adjust). |
| Page: 1 2 3 4 5 6 7 8 9 |
| GO ID | Tissue | Disease Stage | Description | Gene Ratio | Bg Ratio | pvalue | p.adjust | Count |
| GO:001623617 | Esophagus | ESCC | macroautophagy | 216/8552 | 291/18723 | 1.94e-23 | 4.57e-21 | 216 |
| GO:000703314 | Esophagus | ESCC | vacuole organization | 127/8552 | 180/18723 | 1.04e-11 | 3.85e-10 | 127 |
| GO:190503712 | Esophagus | ESCC | autophagosome organization | 73/8552 | 103/18723 | 1.88e-07 | 2.93e-06 | 73 |
| GO:000004513 | Esophagus | ESCC | autophagosome assembly | 69/8552 | 99/18723 | 1.10e-06 | 1.38e-05 | 69 |
| GO:00162365 | Liver | NAFLD | macroautophagy | 45/1882 | 291/18723 | 2.31e-03 | 2.19e-02 | 45 |
| GO:001623621 | Liver | HCC | macroautophagy | 204/7958 | 291/18723 | 8.66e-22 | 1.41e-19 | 204 |
| GO:000703311 | Liver | HCC | vacuole organization | 119/7958 | 180/18723 | 1.22e-10 | 4.25e-09 | 119 |
| GO:19050371 | Liver | HCC | autophagosome organization | 70/7958 | 103/18723 | 1.52e-07 | 2.82e-06 | 70 |
| GO:00000451 | Liver | HCC | autophagosome assembly | 67/7958 | 99/18723 | 3.56e-07 | 6.07e-06 | 67 |
| GO:00162366 | Lung | IAC | macroautophagy | 51/2061 | 291/18723 | 5.30e-04 | 7.49e-03 | 51 |
| GO:001623612 | Lung | AIS | macroautophagy | 46/1849 | 291/18723 | 9.21e-04 | 1.23e-02 | 46 |
| GO:00070333 | Lung | AIS | vacuole organization | 29/1849 | 180/18723 | 5.70e-03 | 4.80e-02 | 29 |
| GO:001623610 | Oral cavity | OSCC | macroautophagy | 192/7305 | 291/18723 | 7.01e-21 | 1.14e-18 | 192 |
| GO:00070335 | Oral cavity | OSCC | vacuole organization | 115/7305 | 180/18723 | 1.11e-11 | 4.00e-10 | 115 |
| GO:19050374 | Oral cavity | OSCC | autophagosome organization | 63/7305 | 103/18723 | 4.30e-06 | 4.98e-05 | 63 |
| GO:00000454 | Oral cavity | OSCC | autophagosome assembly | 60/7305 | 99/18723 | 1.09e-05 | 1.14e-04 | 60 |
| GO:001623615 | Oral cavity | LP | macroautophagy | 135/4623 | 291/18723 | 4.71e-16 | 6.70e-14 | 135 |
| GO:000703313 | Oral cavity | LP | vacuole organization | 79/4623 | 180/18723 | 1.26e-08 | 4.74e-07 | 79 |
| GO:190503711 | Oral cavity | LP | autophagosome organization | 47/4623 | 103/18723 | 2.88e-06 | 6.28e-05 | 47 |
| GO:000004512 | Oral cavity | LP | autophagosome assembly | 44/4623 | 99/18723 | 1.36e-05 | 2.40e-04 | 44 |
| Page: 1 2 3 |
| Pathway ID | Tissue | Disease Stage | Description | Gene Ratio | Bg Ratio | pvalue | p.adjust | qvalue | Count |
| Page: 1 |
Top |
Cell-cell communication analysis |
| Identification of potential cell-cell interactions between two cell types and their ligand-receptor pairs for different disease states |
| Ligand | Receptor | LRpair | Pathway | Tissue | Disease Stage |
| Page: 1 |
Top |
Single-cell gene regulatory network inference analysis |
| Find out the significant the regulons (TFs) and the target genes of each regulon across cell types for different disease states |
| TF | Cell Type | Tissue | Disease Stage | Target Gene | RSS | Regulon Activity |
| ∗The dot plots of a searched regulon are shown for all cell subpopulations in each disease state of each tissue based on the regulon specific score inferred using pySCENIC and by calculating the average expression. |
| Page: 1 |
Top |
Somatic mutation of malignant transformation related genes |
| Annotation of somatic variants for genes involved in malignant transformation |
| Hugo Symbol | Variant Class | Variant Classification | dbSNP RS | HGVSc | HGVSp | HGVSp Short | SWISSPROT | BIOTYPE | SIFT | PolyPhen | Tumor Sample Barcode | Tissue | Histology | Sex | Age | Stage | Therapy Types | Drugs | Outcome |
| TMEM41B | insertion | Frame_Shift_Ins | novel | c.604_605insGGAATGTTTTGCTC | p.Ile202ArgfsTer8 | p.I202Rfs*8 | Q5BJD5 | protein_coding | TCGA-A8-A09B-01 | Breast | breast invasive carcinoma | Female | <65 | III/IV | Chemotherapy | 5-fluorouracil | SD | ||
| TMEM41B | SNV | Missense_Mutation | rs775632699 | c.14G>C | p.Arg5Thr | p.R5T | Q5BJD5 | protein_coding | deleterious_low_confidence(0.05) | benign(0) | TCGA-C5-A7UH-01 | Cervix | cervical & endocervical cancer | Female | <65 | III/IV | Chemotherapy | cisplatin | SD |
| TMEM41B | deletion | Frame_Shift_Del | c.690delT | p.Phe230LeufsTer6 | p.F230Lfs*6 | Q5BJD5 | protein_coding | TCGA-EA-A410-01 | Cervix | cervical & endocervical cancer | Female | <65 | I/II | Unknown | Unknown | SD | |||
| TMEM41B | SNV | Missense_Mutation | novel | c.703N>A | p.Leu235Ile | p.L235I | Q5BJD5 | protein_coding | tolerated(0.43) | benign(0.03) | TCGA-AG-A002-01 | Colorectum | rectum adenocarcinoma | Male | <65 | I/II | Unknown | Unknown | SD |
| TMEM41B | SNV | Missense_Mutation | c.353N>A | p.Phe118Tyr | p.F118Y | Q5BJD5 | protein_coding | deleterious(0) | possibly_damaging(0.885) | TCGA-EI-6881-01 | Colorectum | rectum adenocarcinoma | Male | <65 | III/IV | Chemotherapy | 5 | SD | |
| TMEM41B | SNV | Missense_Mutation | novel | c.736A>C | p.Lys246Gln | p.K246Q | Q5BJD5 | protein_coding | tolerated(1) | benign(0.012) | TCGA-F5-6814-01 | Colorectum | rectum adenocarcinoma | Male | <65 | I/II | Unknown | Unknown | SD |
| TMEM41B | SNV | Missense_Mutation | novel | c.366N>G | p.Ile122Met | p.I122M | Q5BJD5 | protein_coding | deleterious(0) | possibly_damaging(0.863) | TCGA-AP-A1E0-01 | Endometrium | uterine corpus endometrioid carcinoma | Female | <65 | III/IV | Chemotherapy | paclitaxel | SD |
| TMEM41B | SNV | Missense_Mutation | novel | c.271G>T | p.Asp91Tyr | p.D91Y | Q5BJD5 | protein_coding | deleterious(0) | possibly_damaging(0.897) | TCGA-B5-A1MR-01 | Endometrium | uterine corpus endometrioid carcinoma | Female | >=65 | III/IV | Unknown | Unknown | SD |
| TMEM41B | SNV | Missense_Mutation | novel | c.109N>A | p.Asp37Asn | p.D37N | Q5BJD5 | protein_coding | tolerated(0.47) | benign(0.023) | TCGA-BG-A222-01 | Endometrium | uterine corpus endometrioid carcinoma | Female | <65 | I/II | Unknown | Unknown | SD |
| TMEM41B | SNV | Missense_Mutation | novel | c.392N>A | p.Gly131Asp | p.G131D | Q5BJD5 | protein_coding | deleterious(0) | probably_damaging(1) | TCGA-DF-A2KU-01 | Endometrium | uterine corpus endometrioid carcinoma | Female | Unknown | I/II | Unknown | Unknown | SD |
| Page: 1 2 |
Top |
Related drugs of malignant transformation related genes |
| Identification of chemicals and drugs interact with genes involved in malignant transfromation |
| (DGIdb 4.0) |
| Entrez ID | Symbol | Category | Interaction Types | Drug Claim Name | Drug Name | PMIDs |
| Page: 1 |

Copyright 2023-Present -The University of Texas Health Science Center at Houston |