
|
|||||
|
 | |
| |
| |
| |
| |
| |
|
Gene: TMEM39A |
Gene summary for TMEM39A |
| Gene information | Species | Human | Gene symbol | TMEM39A | Gene ID | 55254 |
| Gene name | transmembrane protein 39A | |
| Gene Alias | SUSR2 | |
| Cytomap | 3q13.33 | |
| Gene Type | protein-coding | GO ID | GO:0000045 | UniProtAcc | Q9NV64 |
Top |
Malignant transformation analysis |
| Identification of the aberrant gene expression in precancerous and cancerous lesions by comparing the gene expression of stem-like cells in diseased tissues with normal stem cells |
| Entrez ID | Symbol | Replicates | Species | Organ | Tissue | Adj P-value | Log2FC | Malignancy |
| 55254 | TMEM39A | LZE4T | Human | Esophagus | ESCC | 3.18e-07 | 2.04e-01 | 0.0811 |
| 55254 | TMEM39A | LZE5T | Human | Esophagus | ESCC | 4.78e-02 | 2.96e-01 | 0.0514 |
| 55254 | TMEM39A | LZE7T | Human | Esophagus | ESCC | 9.82e-10 | 6.82e-01 | 0.0667 |
| 55254 | TMEM39A | LZE8T | Human | Esophagus | ESCC | 1.12e-07 | 2.29e-01 | 0.067 |
| 55254 | TMEM39A | LZE24T | Human | Esophagus | ESCC | 5.23e-19 | 4.56e-01 | 0.0596 |
| 55254 | TMEM39A | LZE6T | Human | Esophagus | ESCC | 4.64e-04 | 1.84e-01 | 0.0845 |
| 55254 | TMEM39A | P2T-E | Human | Esophagus | ESCC | 9.01e-20 | 3.13e-01 | 0.1177 |
| 55254 | TMEM39A | P4T-E | Human | Esophagus | ESCC | 2.82e-13 | 3.54e-01 | 0.1323 |
| 55254 | TMEM39A | P5T-E | Human | Esophagus | ESCC | 2.65e-16 | 2.73e-01 | 0.1327 |
| 55254 | TMEM39A | P8T-E | Human | Esophagus | ESCC | 5.39e-35 | 6.58e-01 | 0.0889 |
| 55254 | TMEM39A | P9T-E | Human | Esophagus | ESCC | 1.22e-19 | 4.23e-01 | 0.1131 |
| 55254 | TMEM39A | P10T-E | Human | Esophagus | ESCC | 1.68e-41 | 9.09e-01 | 0.116 |
| 55254 | TMEM39A | P11T-E | Human | Esophagus | ESCC | 1.07e-14 | 3.86e-01 | 0.1426 |
| 55254 | TMEM39A | P12T-E | Human | Esophagus | ESCC | 1.26e-21 | 3.06e-01 | 0.1122 |
| 55254 | TMEM39A | P15T-E | Human | Esophagus | ESCC | 8.37e-31 | 6.35e-01 | 0.1149 |
| 55254 | TMEM39A | P16T-E | Human | Esophagus | ESCC | 2.55e-30 | 6.73e-01 | 0.1153 |
| 55254 | TMEM39A | P17T-E | Human | Esophagus | ESCC | 1.06e-08 | 2.62e-01 | 0.1278 |
| 55254 | TMEM39A | P19T-E | Human | Esophagus | ESCC | 3.50e-09 | 4.51e-01 | 0.1662 |
| 55254 | TMEM39A | P20T-E | Human | Esophagus | ESCC | 1.60e-22 | 3.55e-01 | 0.1124 |
| 55254 | TMEM39A | P21T-E | Human | Esophagus | ESCC | 2.44e-21 | 4.72e-01 | 0.1617 |
| Page: 1 2 3 4 5 |
| Tissue | Expression Dynamics | Abbreviation |
| Esophagus |  | ESCC: Esophageal squamous cell carcinoma |
| HGIN: High-grade intraepithelial neoplasias | ||
| LGIN: Low-grade intraepithelial neoplasias | ||
| Liver | 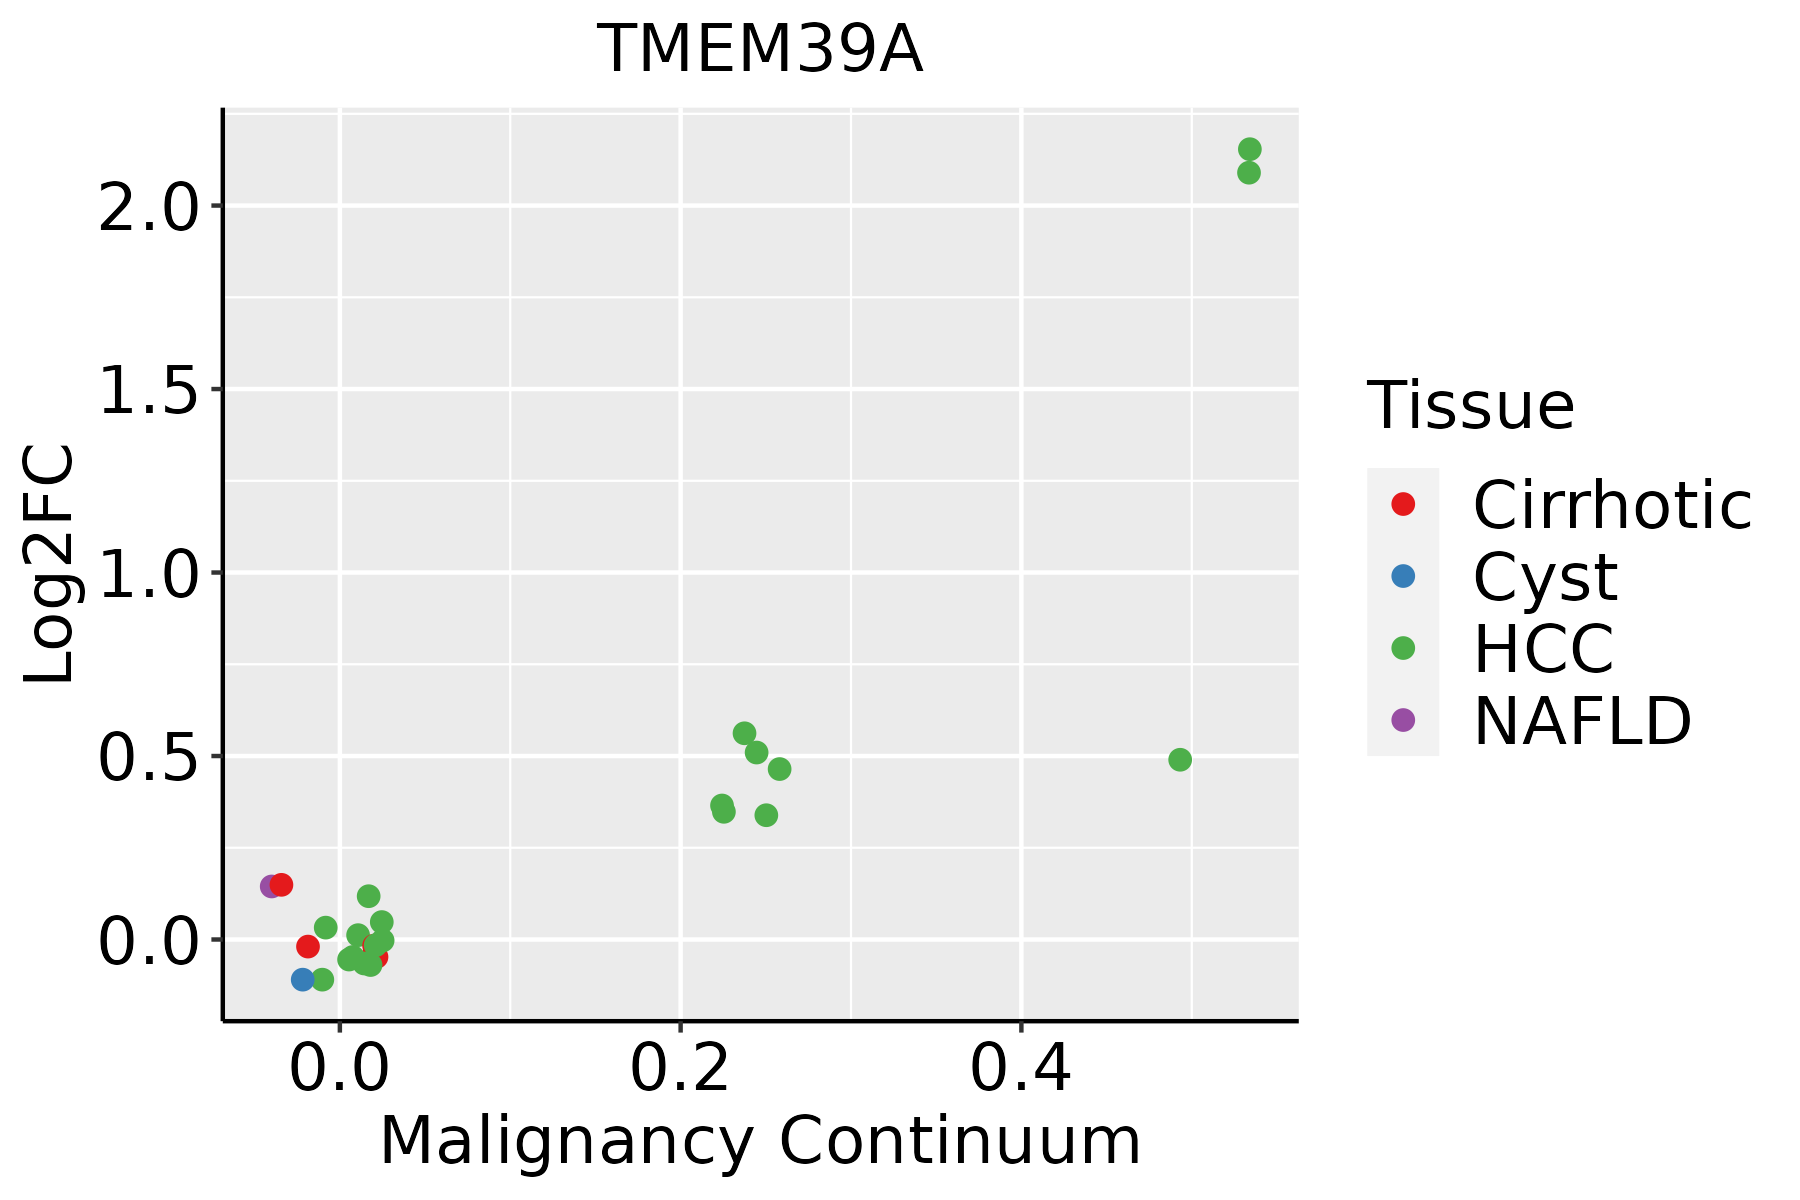 | HCC: Hepatocellular carcinoma |
| NAFLD: Non-alcoholic fatty liver disease | ||
| Oral Cavity | 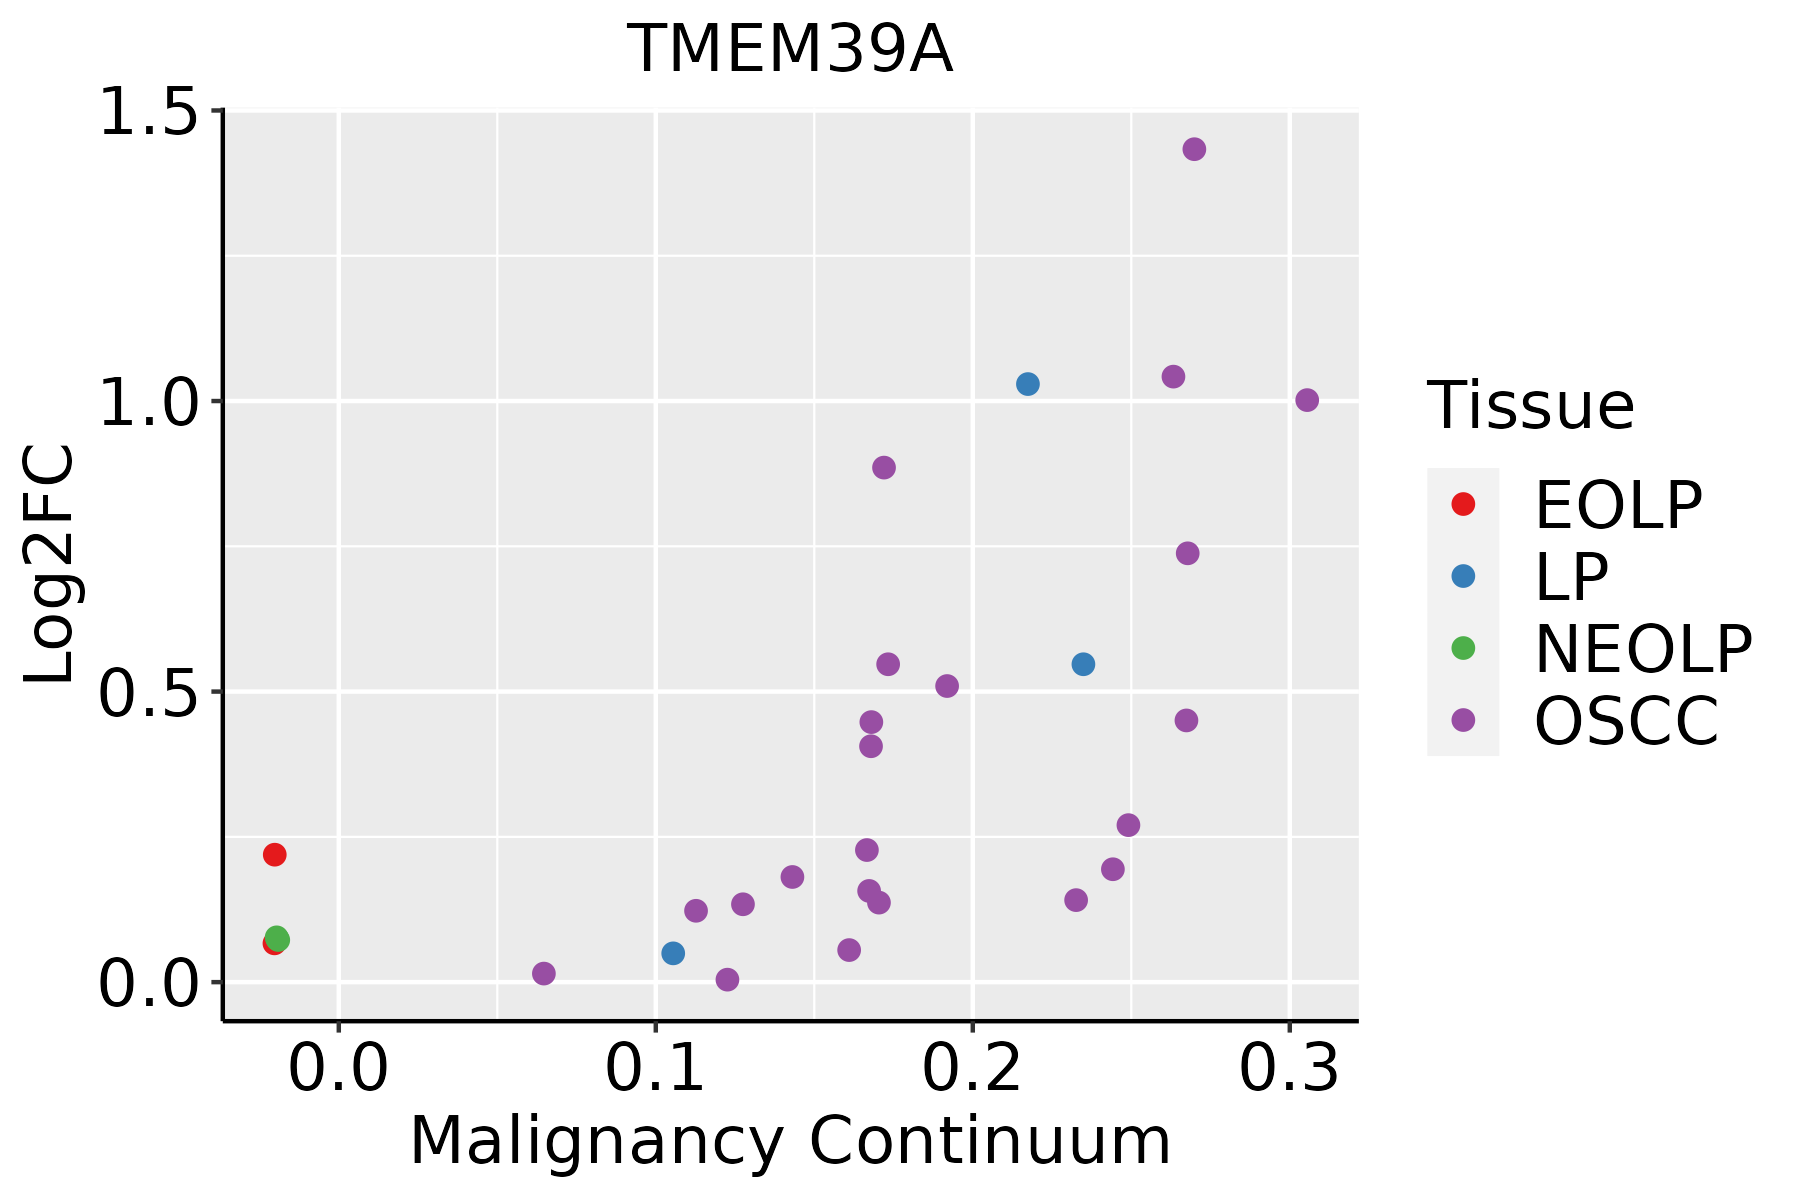 | EOLP: Erosive Oral lichen planus |
| LP: leukoplakia | ||
| NEOLP: Non-erosive oral lichen planus | ||
| OSCC: Oral squamous cell carcinoma |
| ∗log2FC in expression of this searched gene in stem-like cells from each diseased tissue sample relative to stem-like cells in normal samples in each tissue plotted against the malignancy continuum. Samples are colored based on if they are from different disease stage. |
Top |
Malignant transformation related pathway analysis |
| Find out the enriched GO biological processes and KEGG pathways involved in transition from healthy to precancer to cancer |
| Tissue | Disease Stage | Enriched GO biological Processes |
| Colorectum | AD |  |
| Colorectum | SER |  |
| Colorectum | MSS |  |
| Colorectum | MSI-H |  |
| Colorectum | FAP |  |
| ∗Top 15 enriched GO BP terms are showed in the bar plot of each disease state in each tissue. Each row represents a significant GO biological process which is colored according to the -log10(p.adjust). |
| Page: 1 2 3 4 5 6 7 8 9 |
| GO ID | Tissue | Disease Stage | Description | Gene Ratio | Bg Ratio | pvalue | p.adjust | Count |
| GO:0016032111 | Esophagus | ESCC | viral process | 301/8552 | 415/18723 | 3.34e-29 | 1.32e-26 | 301 |
| GO:001623617 | Esophagus | ESCC | macroautophagy | 216/8552 | 291/18723 | 1.94e-23 | 4.57e-21 | 216 |
| GO:0022411111 | Esophagus | ESCC | cellular component disassembly | 305/8552 | 443/18723 | 1.94e-23 | 4.57e-21 | 305 |
| GO:0019058111 | Esophagus | ESCC | viral life cycle | 226/8552 | 317/18723 | 1.17e-20 | 1.76e-18 | 226 |
| GO:001050617 | Esophagus | ESCC | regulation of autophagy | 220/8552 | 317/18723 | 6.72e-18 | 6.36e-16 | 220 |
| GO:0019079111 | Esophagus | ESCC | viral genome replication | 102/8552 | 131/18723 | 4.31e-14 | 2.19e-12 | 102 |
| GO:0050792111 | Esophagus | ESCC | regulation of viral process | 119/8552 | 164/18723 | 2.19e-12 | 9.03e-11 | 119 |
| GO:000703314 | Esophagus | ESCC | vacuole organization | 127/8552 | 180/18723 | 1.04e-11 | 3.85e-10 | 127 |
| GO:003298416 | Esophagus | ESCC | protein-containing complex disassembly | 151/8552 | 224/18723 | 3.45e-11 | 1.15e-09 | 151 |
| GO:001624114 | Esophagus | ESCC | regulation of macroautophagy | 102/8552 | 141/18723 | 1.09e-10 | 3.27e-09 | 102 |
| GO:1903900111 | Esophagus | ESCC | regulation of viral life cycle | 106/8552 | 148/18723 | 1.26e-10 | 3.72e-09 | 106 |
| GO:0045069110 | Esophagus | ESCC | regulation of viral genome replication | 67/8552 | 85/18723 | 3.81e-10 | 1.04e-08 | 67 |
| GO:0009895111 | Esophagus | ESCC | negative regulation of catabolic process | 201/8552 | 320/18723 | 3.88e-10 | 1.05e-08 | 201 |
| GO:0010639110 | Esophagus | ESCC | negative regulation of organelle organization | 215/8552 | 348/18723 | 8.20e-10 | 2.01e-08 | 215 |
| GO:0031330111 | Esophagus | ESCC | negative regulation of cellular catabolic process | 166/8552 | 262/18723 | 5.17e-09 | 1.08e-07 | 166 |
| GO:0048524110 | Esophagus | ESCC | positive regulation of viral process | 52/8552 | 65/18723 | 1.41e-08 | 2.77e-07 | 52 |
| GO:190503712 | Esophagus | ESCC | autophagosome organization | 73/8552 | 103/18723 | 1.88e-07 | 2.93e-06 | 73 |
| GO:000004513 | Esophagus | ESCC | autophagosome assembly | 69/8552 | 99/18723 | 1.10e-06 | 1.38e-05 | 69 |
| GO:190211514 | Esophagus | ESCC | regulation of organelle assembly | 116/8552 | 186/18723 | 3.15e-06 | 3.53e-05 | 116 |
| GO:00973523 | Esophagus | ESCC | autophagosome maturation | 31/8552 | 40/18723 | 4.04e-05 | 3.26e-04 | 31 |
| Page: 1 2 3 4 5 6 7 |
| Pathway ID | Tissue | Disease Stage | Description | Gene Ratio | Bg Ratio | pvalue | p.adjust | qvalue | Count |
| Page: 1 |
Top |
Cell-cell communication analysis |
| Identification of potential cell-cell interactions between two cell types and their ligand-receptor pairs for different disease states |
| Ligand | Receptor | LRpair | Pathway | Tissue | Disease Stage |
| Page: 1 |
Top |
Single-cell gene regulatory network inference analysis |
| Find out the significant the regulons (TFs) and the target genes of each regulon across cell types for different disease states |
| TF | Cell Type | Tissue | Disease Stage | Target Gene | RSS | Regulon Activity |
| ∗The dot plots of a searched regulon are shown for all cell subpopulations in each disease state of each tissue based on the regulon specific score inferred using pySCENIC and by calculating the average expression. |
| Page: 1 |
Top |
Somatic mutation of malignant transformation related genes |
| Annotation of somatic variants for genes involved in malignant transformation |
| Hugo Symbol | Variant Class | Variant Classification | dbSNP RS | HGVSc | HGVSp | HGVSp Short | SWISSPROT | BIOTYPE | SIFT | PolyPhen | Tumor Sample Barcode | Tissue | Histology | Sex | Age | Stage | Therapy Types | Drugs | Outcome |
| TMEM39A | insertion | Frame_Shift_Ins | novel | c.766_767insT | p.Thr256IlefsTer18 | p.T256Ifs*18 | Q9NV64 | protein_coding | TCGA-A7-A26I-01 | Breast | breast invasive carcinoma | Female | >=65 | I/II | Chemotherapy | cytoxan | SD | ||
| TMEM39A | insertion | Frame_Shift_Ins | novel | c.765_766insTGCCTCCCTACTGT | p.Thr256CysfsTer24 | p.T256Cfs*24 | Q9NV64 | protein_coding | TCGA-A7-A26I-01 | Breast | breast invasive carcinoma | Female | >=65 | I/II | Chemotherapy | cytoxan | SD | ||
| TMEM39A | deletion | Frame_Shift_Del | c.239delN | p.Phe80SerfsTer33 | p.F80Sfs*33 | Q9NV64 | protein_coding | TCGA-AN-A0AK-01 | Breast | breast invasive carcinoma | Female | >=65 | I/II | Unknown | Unknown | SD | |||
| TMEM39A | insertion | Frame_Shift_Ins | novel | c.750_751insATACC | p.Gln251IlefsTer26 | p.Q251Ifs*26 | Q9NV64 | protein_coding | TCGA-AR-A0U0-01 | Breast | breast invasive carcinoma | Female | >=65 | I/II | Unknown | Unknown | SD | ||
| TMEM39A | deletion | Frame_Shift_Del | c.1185delN | p.Pro396LeufsTer23 | p.P396Lfs*23 | Q9NV64 | protein_coding | TCGA-E2-A14W-01 | Breast | breast invasive carcinoma | Male | >=65 | I/II | Chemotherapy | cytoxan | SD | |||
| TMEM39A | SNV | Missense_Mutation | novel | c.812G>A | p.Arg271His | p.R271H | Q9NV64 | protein_coding | deleterious(0.04) | probably_damaging(0.995) | TCGA-2W-A8YY-01 | Cervix | cervical & endocervical cancer | Female | <65 | I/II | Chemotherapy | cisplatin | CR |
| TMEM39A | SNV | Missense_Mutation | rs559521023 | c.536N>A | p.Arg179Gln | p.R179Q | Q9NV64 | protein_coding | tolerated(0.06) | benign(0.147) | TCGA-AA-3510-01 | Colorectum | colon adenocarcinoma | Male | >=65 | I/II | Unknown | Unknown | SD |
| TMEM39A | SNV | Missense_Mutation | novel | c.146C>A | p.Pro49His | p.P49H | Q9NV64 | protein_coding | deleterious(0.01) | possibly_damaging(0.888) | TCGA-AA-3950-01 | Colorectum | colon adenocarcinoma | Female | >=65 | I/II | Unknown | Unknown | SD |
| TMEM39A | SNV | Missense_Mutation | c.121N>G | p.Ser41Gly | p.S41G | Q9NV64 | protein_coding | tolerated(0.09) | benign(0.067) | TCGA-AU-6004-01 | Colorectum | colon adenocarcinoma | Female | >=65 | I/II | Unknown | Unknown | SD | |
| TMEM39A | deletion | Frame_Shift_Del | c.239delN | p.Phe80SerfsTer33 | p.F80Sfs*33 | Q9NV64 | protein_coding | TCGA-A6-2686-01 | Colorectum | colon adenocarcinoma | Female | >=65 | I/II | Unknown | Unknown | SD |
| Page: 1 2 3 4 5 6 |
Top |
Related drugs of malignant transformation related genes |
| Identification of chemicals and drugs interact with genes involved in malignant transfromation |
| (DGIdb 4.0) |
| Entrez ID | Symbol | Category | Interaction Types | Drug Claim Name | Drug Name | PMIDs |
| Page: 1 |

Copyright 2023-Present -The University of Texas Health Science Center at Houston |