
|
|||||
|
 | |
| |
| |
| |
| |
| |
|
Gene: TMEM38B |
Gene summary for TMEM38B |
| Gene information | Species | Human | Gene symbol | TMEM38B | Gene ID | 55151 |
| Gene name | transmembrane protein 38B | |
| Gene Alias | C9orf87 | |
| Cytomap | 9q31.2 | |
| Gene Type | protein-coding | GO ID | GO:0001501 | UniProtAcc | Q9NVV0 |
Top |
Malignant transformation analysis |
| Identification of the aberrant gene expression in precancerous and cancerous lesions by comparing the gene expression of stem-like cells in diseased tissues with normal stem cells |
| Entrez ID | Symbol | Replicates | Species | Organ | Tissue | Adj P-value | Log2FC | Malignancy |
| 55151 | TMEM38B | LZE2T | Human | Esophagus | ESCC | 2.91e-02 | 2.92e-01 | 0.082 |
| 55151 | TMEM38B | LZE4T | Human | Esophagus | ESCC | 2.82e-02 | 1.81e-01 | 0.0811 |
| 55151 | TMEM38B | LZE7T | Human | Esophagus | ESCC | 6.73e-10 | 6.79e-01 | 0.0667 |
| 55151 | TMEM38B | LZE24T | Human | Esophagus | ESCC | 2.98e-19 | 5.17e-01 | 0.0596 |
| 55151 | TMEM38B | P1T-E | Human | Esophagus | ESCC | 1.53e-02 | 1.14e-01 | 0.0875 |
| 55151 | TMEM38B | P2T-E | Human | Esophagus | ESCC | 3.93e-47 | 7.82e-01 | 0.1177 |
| 55151 | TMEM38B | P4T-E | Human | Esophagus | ESCC | 9.56e-16 | 3.73e-01 | 0.1323 |
| 55151 | TMEM38B | P5T-E | Human | Esophagus | ESCC | 3.69e-19 | 3.97e-01 | 0.1327 |
| 55151 | TMEM38B | P8T-E | Human | Esophagus | ESCC | 1.20e-06 | 4.71e-02 | 0.0889 |
| 55151 | TMEM38B | P9T-E | Human | Esophagus | ESCC | 1.05e-05 | 7.87e-02 | 0.1131 |
| 55151 | TMEM38B | P10T-E | Human | Esophagus | ESCC | 1.76e-15 | 1.72e-01 | 0.116 |
| 55151 | TMEM38B | P11T-E | Human | Esophagus | ESCC | 1.28e-02 | 1.81e-01 | 0.1426 |
| 55151 | TMEM38B | P12T-E | Human | Esophagus | ESCC | 1.70e-37 | 5.83e-01 | 0.1122 |
| 55151 | TMEM38B | P15T-E | Human | Esophagus | ESCC | 3.26e-23 | 5.17e-01 | 0.1149 |
| 55151 | TMEM38B | P16T-E | Human | Esophagus | ESCC | 1.10e-17 | 1.22e-01 | 0.1153 |
| 55151 | TMEM38B | P20T-E | Human | Esophagus | ESCC | 1.22e-07 | 1.97e-01 | 0.1124 |
| 55151 | TMEM38B | P21T-E | Human | Esophagus | ESCC | 2.84e-09 | 1.77e-01 | 0.1617 |
| 55151 | TMEM38B | P22T-E | Human | Esophagus | ESCC | 2.03e-18 | 1.32e-01 | 0.1236 |
| 55151 | TMEM38B | P23T-E | Human | Esophagus | ESCC | 1.15e-04 | 1.44e-01 | 0.108 |
| 55151 | TMEM38B | P24T-E | Human | Esophagus | ESCC | 2.29e-11 | 2.27e-01 | 0.1287 |
| Page: 1 2 3 4 |
| Tissue | Expression Dynamics | Abbreviation |
| Esophagus | 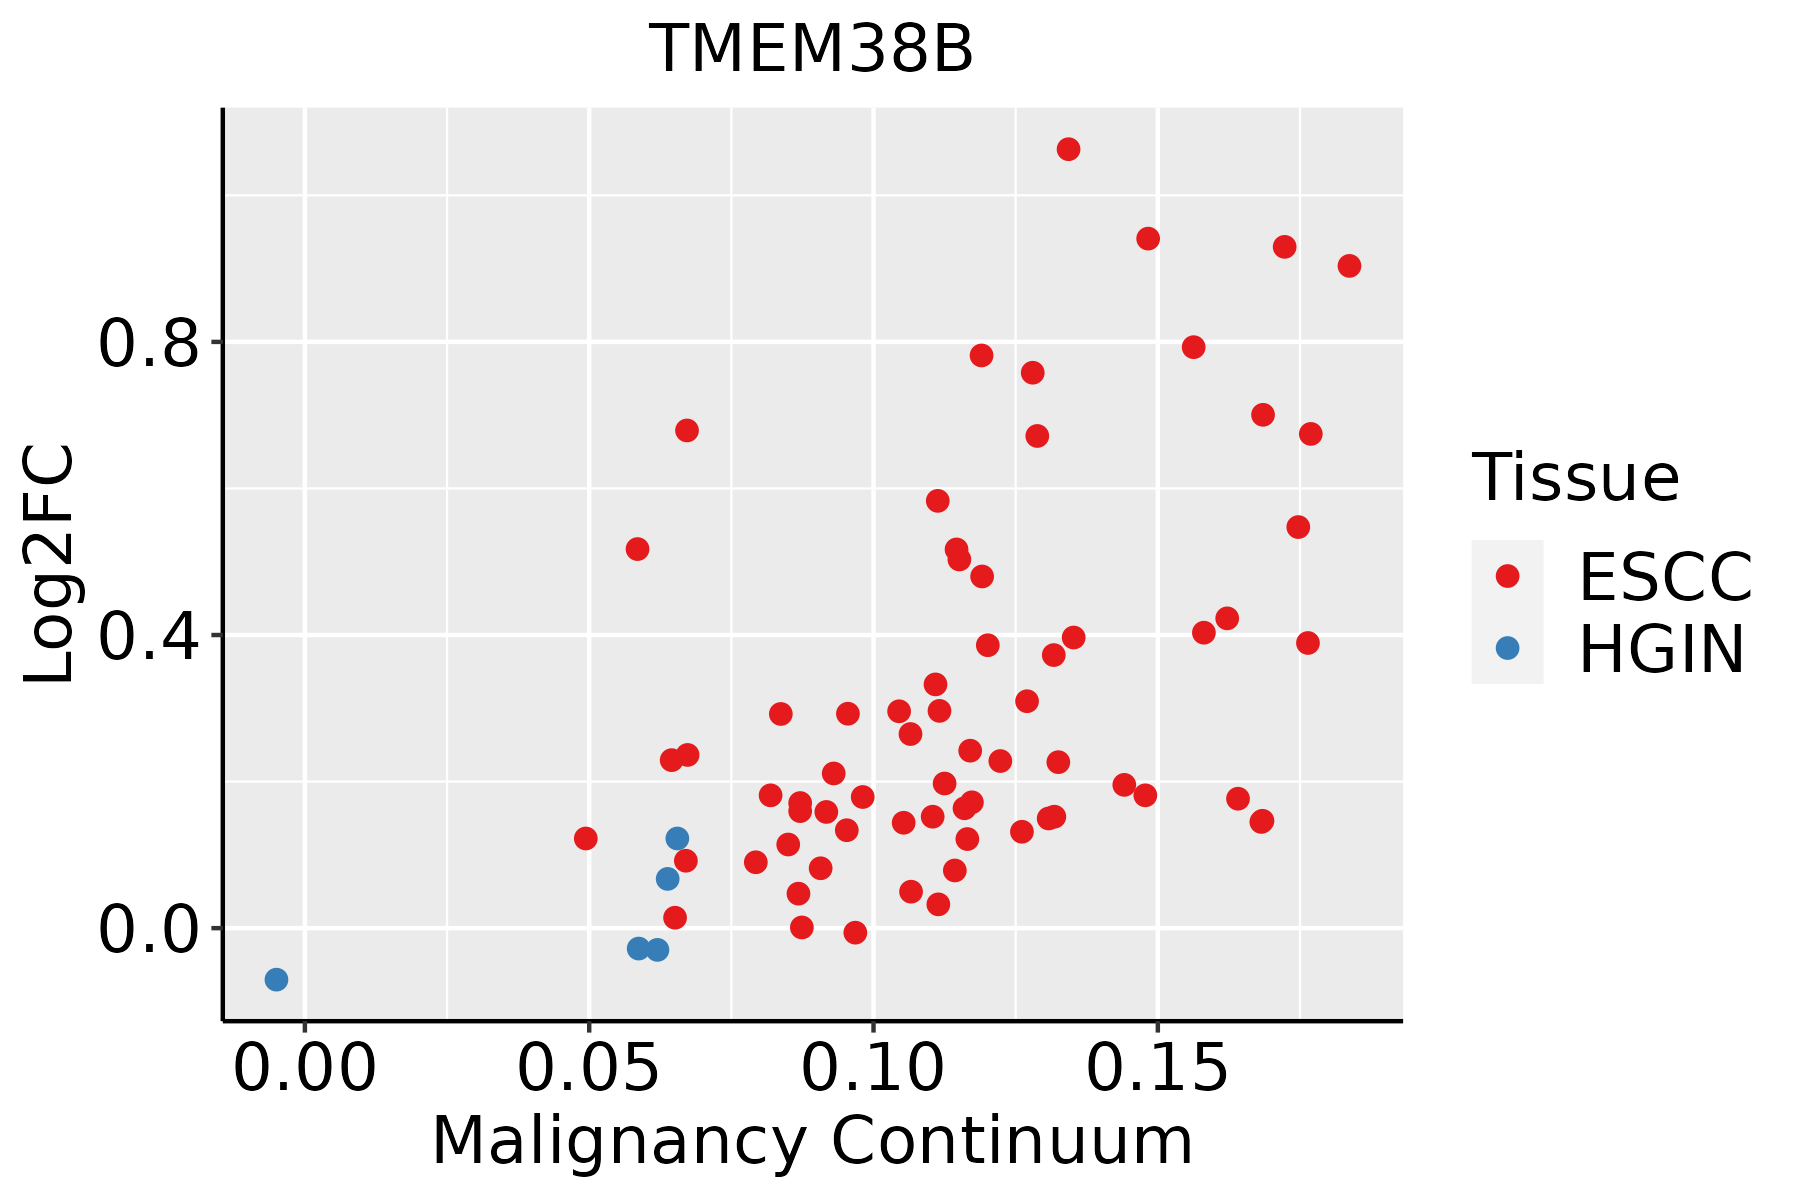 | ESCC: Esophageal squamous cell carcinoma |
| HGIN: High-grade intraepithelial neoplasias | ||
| LGIN: Low-grade intraepithelial neoplasias | ||
| Liver | 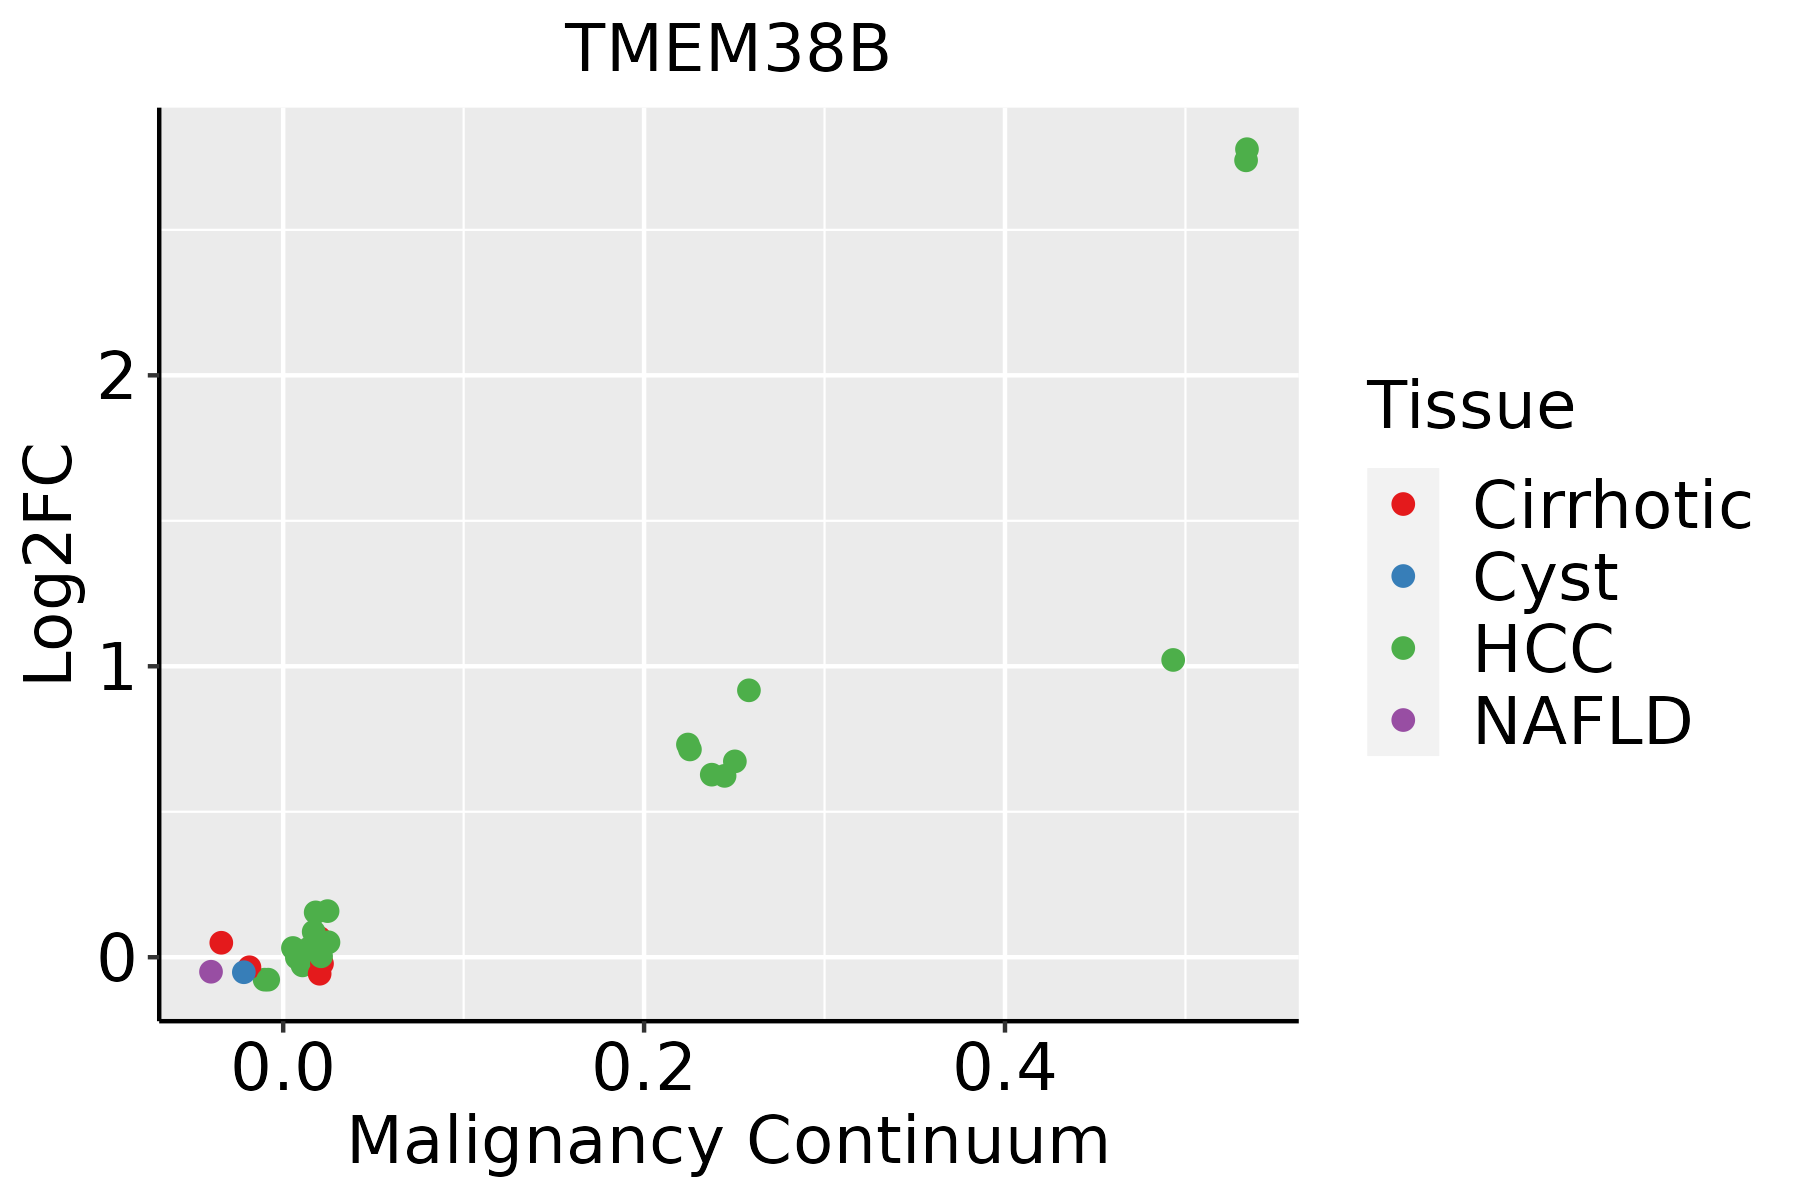 | HCC: Hepatocellular carcinoma |
| NAFLD: Non-alcoholic fatty liver disease | ||
| Oral Cavity | 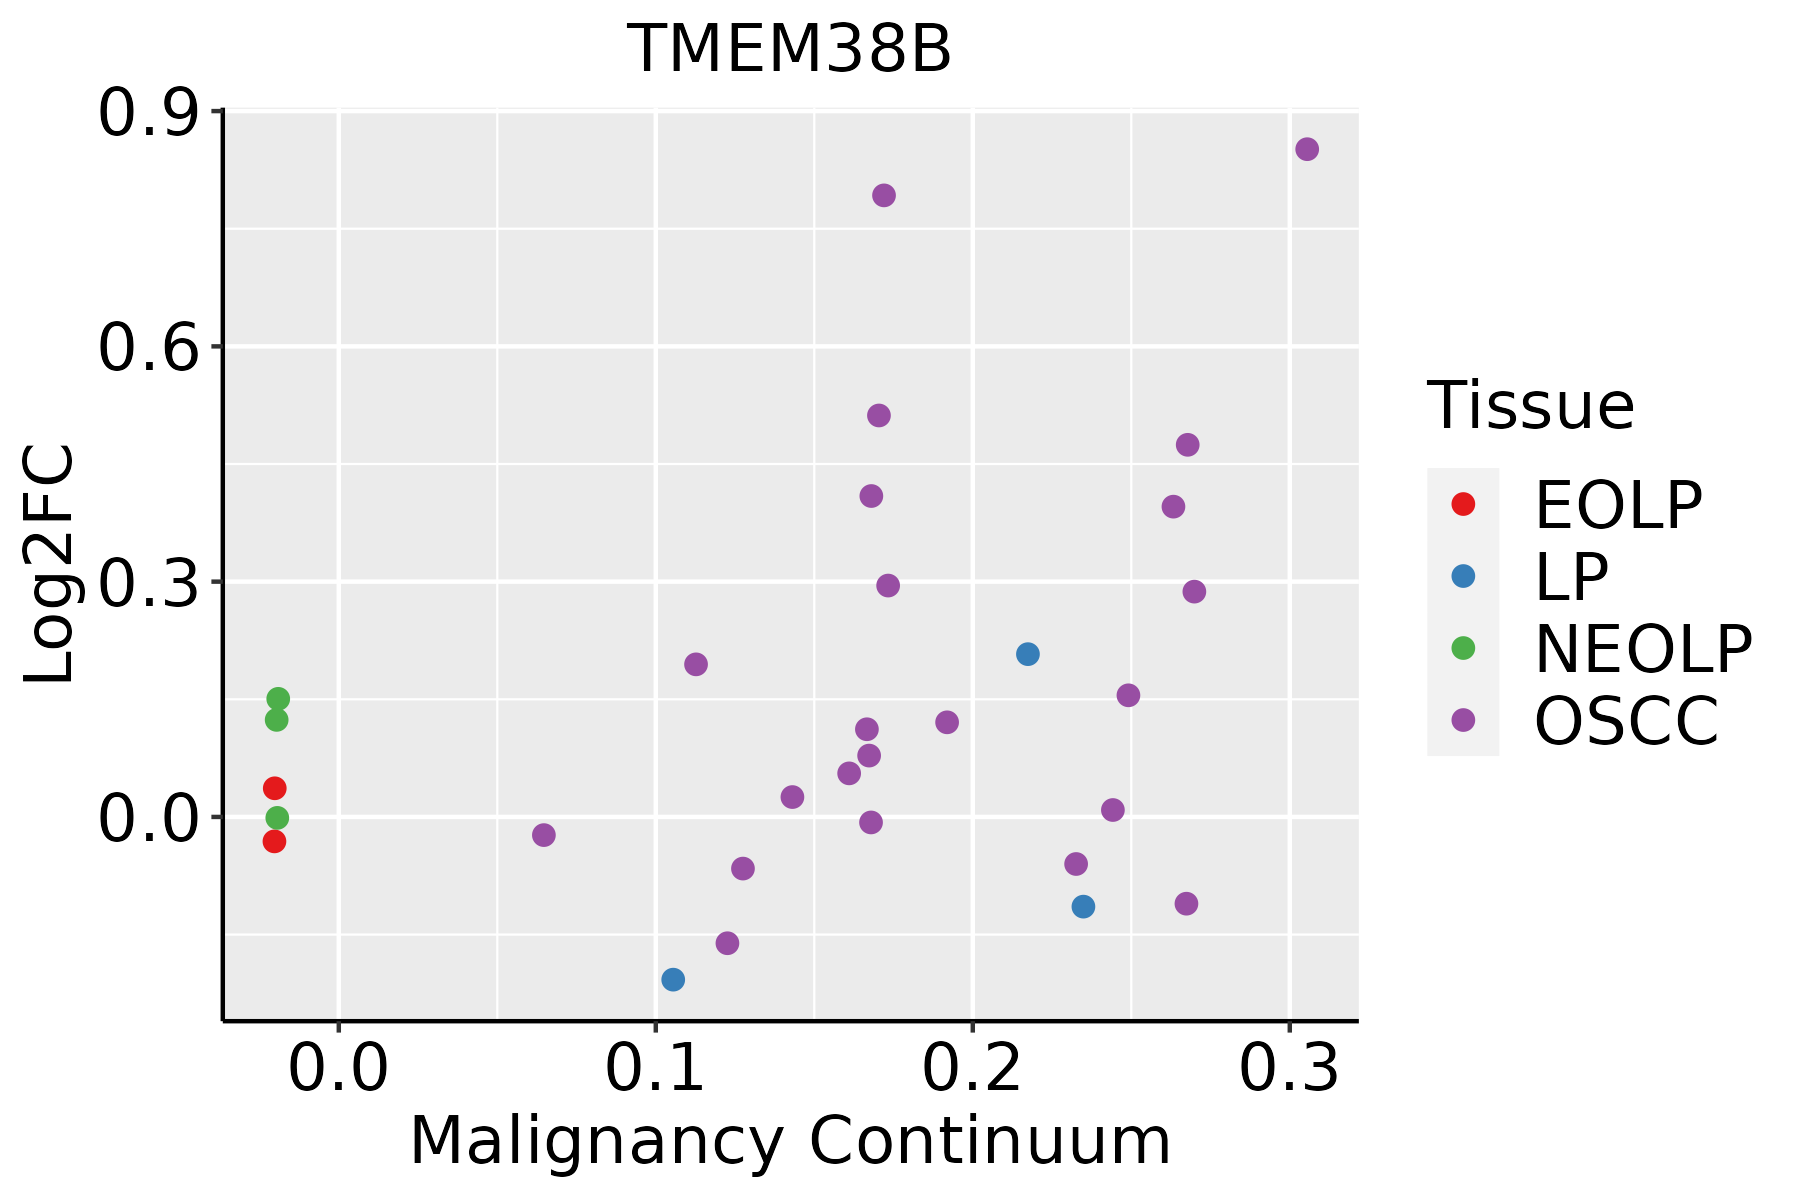 | EOLP: Erosive Oral lichen planus |
| LP: leukoplakia | ||
| NEOLP: Non-erosive oral lichen planus | ||
| OSCC: Oral squamous cell carcinoma |
| ∗log2FC in expression of this searched gene in stem-like cells from each diseased tissue sample relative to stem-like cells in normal samples in each tissue plotted against the malignancy continuum. Samples are colored based on if they are from different disease stage. |
Top |
Malignant transformation related pathway analysis |
| Find out the enriched GO biological processes and KEGG pathways involved in transition from healthy to precancer to cancer |
| Tissue | Disease Stage | Enriched GO biological Processes |
| Colorectum | AD |  |
| Colorectum | SER |  |
| Colorectum | MSS |  |
| Colorectum | MSI-H |  |
| Colorectum | FAP |  |
| ∗Top 15 enriched GO BP terms are showed in the bar plot of each disease state in each tissue. Each row represents a significant GO biological process which is colored according to the -log10(p.adjust). |
| Page: 1 2 3 4 5 6 7 8 9 |
| GO ID | Tissue | Disease Stage | Description | Gene Ratio | Bg Ratio | pvalue | p.adjust | Count |
| GO:00086544 | Esophagus | ESCC | phospholipid biosynthetic process | 162/8552 | 253/18723 | 2.59e-09 | 5.73e-08 | 162 |
| GO:0051235110 | Esophagus | ESCC | maintenance of location | 200/8552 | 327/18723 | 1.01e-08 | 2.02e-07 | 200 |
| GO:000702914 | Esophagus | ESCC | endoplasmic reticulum organization | 65/8552 | 87/18723 | 3.28e-08 | 6.08e-07 | 65 |
| GO:000150317 | Esophagus | ESCC | ossification | 232/8552 | 408/18723 | 3.00e-06 | 3.40e-05 | 232 |
| GO:00066446 | Esophagus | ESCC | phospholipid metabolic process | 218/8552 | 383/18723 | 5.37e-06 | 5.59e-05 | 218 |
| GO:00303239 | Esophagus | ESCC | respiratory tube development | 112/8552 | 181/18723 | 7.82e-06 | 7.69e-05 | 112 |
| GO:00605417 | Esophagus | ESCC | respiratory system development | 123/8552 | 203/18723 | 1.26e-05 | 1.15e-04 | 123 |
| GO:00303249 | Esophagus | ESCC | lung development | 109/8552 | 177/18723 | 1.40e-05 | 1.27e-04 | 109 |
| GO:00301984 | Esophagus | ESCC | extracellular matrix organization | 171/8552 | 301/18723 | 6.08e-05 | 4.67e-04 | 171 |
| GO:0051651111 | Esophagus | ESCC | maintenance of location in cell | 126/8552 | 214/18723 | 6.57e-05 | 5.00e-04 | 126 |
| GO:00430624 | Esophagus | ESCC | extracellular structure organization | 171/8552 | 302/18723 | 7.73e-05 | 5.76e-04 | 171 |
| GO:00452294 | Esophagus | ESCC | external encapsulating structure organization | 172/8552 | 304/18723 | 7.80e-05 | 5.80e-04 | 172 |
| GO:00604284 | Esophagus | ESCC | lung epithelium development | 27/8552 | 37/18723 | 7.00e-04 | 3.66e-03 | 27 |
| GO:00603485 | Esophagus | ESCC | bone development | 115/8552 | 205/18723 | 1.67e-03 | 7.72e-03 | 115 |
| GO:006047913 | Esophagus | ESCC | lung cell differentiation | 18/8552 | 24/18723 | 3.43e-03 | 1.41e-02 | 18 |
| GO:00604872 | Esophagus | ESCC | lung epithelial cell differentiation | 17/8552 | 23/18723 | 5.73e-03 | 2.13e-02 | 17 |
| GO:00070292 | Liver | Cirrhotic | endoplasmic reticulum organization | 42/4634 | 87/18723 | 1.67e-06 | 3.22e-05 | 42 |
| GO:005123511 | Liver | Cirrhotic | maintenance of location | 117/4634 | 327/18723 | 4.78e-06 | 7.86e-05 | 117 |
| GO:00303242 | Liver | Cirrhotic | lung development | 65/4634 | 177/18723 | 2.49e-04 | 2.25e-03 | 65 |
| GO:00516517 | Liver | Cirrhotic | maintenance of location in cell | 76/4634 | 214/18723 | 2.66e-04 | 2.37e-03 | 76 |
| Page: 1 2 3 |
| Pathway ID | Tissue | Disease Stage | Description | Gene Ratio | Bg Ratio | pvalue | p.adjust | qvalue | Count |
| Page: 1 |
Top |
Cell-cell communication analysis |
| Identification of potential cell-cell interactions between two cell types and their ligand-receptor pairs for different disease states |
| Ligand | Receptor | LRpair | Pathway | Tissue | Disease Stage |
| Page: 1 |
Top |
Single-cell gene regulatory network inference analysis |
| Find out the significant the regulons (TFs) and the target genes of each regulon across cell types for different disease states |
| TF | Cell Type | Tissue | Disease Stage | Target Gene | RSS | Regulon Activity |
| ∗The dot plots of a searched regulon are shown for all cell subpopulations in each disease state of each tissue based on the regulon specific score inferred using pySCENIC and by calculating the average expression. |
| Page: 1 |
Top |
Somatic mutation of malignant transformation related genes |
| Annotation of somatic variants for genes involved in malignant transformation |
| Hugo Symbol | Variant Class | Variant Classification | dbSNP RS | HGVSc | HGVSp | HGVSp Short | SWISSPROT | BIOTYPE | SIFT | PolyPhen | Tumor Sample Barcode | Tissue | Histology | Sex | Age | Stage | Therapy Types | Drugs | Outcome |
| TMEM38B | SNV | Missense_Mutation | c.317C>T | p.Ser106Leu | p.S106L | Q9NVV0 | protein_coding | deleterious(0.01) | benign(0.437) | TCGA-BH-A0B0-01 | Breast | breast invasive carcinoma | Female | <65 | I/II | Chemotherapy | adriamycin | CR | |
| TMEM38B | SNV | Missense_Mutation | rs780999389 | c.8C>T | p.Ser3Phe | p.S3F | Q9NVV0 | protein_coding | tolerated_low_confidence(0.67) | benign(0) | TCGA-LL-A9Q3-01 | Breast | breast invasive carcinoma | Female | >=65 | III/IV | Immunotherapy | herceptin | CR |
| TMEM38B | deletion | Frame_Shift_Del | c.286delT | p.Cys96AlafsTer5 | p.C96Afs*5 | Q9NVV0 | protein_coding | TCGA-A8-A09Z-01 | Breast | breast invasive carcinoma | Female | >=65 | I/II | Unknown | Unknown | SD | |||
| TMEM38B | SNV | Missense_Mutation | rs758732241 | c.409N>C | p.Tyr137His | p.Y137H | Q9NVV0 | protein_coding | deleterious(0) | probably_damaging(0.955) | TCGA-2W-A8YY-01 | Cervix | cervical & endocervical cancer | Female | <65 | I/II | Chemotherapy | cisplatin | CR |
| TMEM38B | SNV | Missense_Mutation | novel | c.199N>G | p.Leu67Val | p.L67V | Q9NVV0 | protein_coding | tolerated(0.36) | benign(0.011) | TCGA-VS-A9UD-01 | Cervix | cervical & endocervical cancer | Female | >=65 | III/IV | Chemotherapy | cisplatin | CR |
| TMEM38B | SNV | Missense_Mutation | rs533512053 | c.104N>A | p.Arg35His | p.R35H | Q9NVV0 | protein_coding | tolerated(0.42) | benign(0.001) | TCGA-A6-2675-01 | Colorectum | colon adenocarcinoma | Male | >=65 | I/II | Unknown | Unknown | SD |
| TMEM38B | SNV | Missense_Mutation | c.865A>C | p.Lys289Gln | p.K289Q | Q9NVV0 | protein_coding | deleterious(0.01) | probably_damaging(0.991) | TCGA-AA-A00N-01 | Colorectum | colon adenocarcinoma | Male | >=65 | I/II | Unknown | Unknown | PD | |
| TMEM38B | SNV | Missense_Mutation | c.670N>T | p.Met224Leu | p.M224L | Q9NVV0 | protein_coding | tolerated(0.15) | benign(0.138) | TCGA-DM-A1HB-01 | Colorectum | colon adenocarcinoma | Male | >=65 | III/IV | Unknown | Unknown | SD | |
| TMEM38B | SNV | Missense_Mutation | novel | c.772N>C | p.Ser258Arg | p.S258R | Q9NVV0 | protein_coding | tolerated(0.35) | benign(0.039) | TCGA-A5-A1OF-01 | Endometrium | uterine corpus endometrioid carcinoma | Female | <65 | I/II | Unknown | Unknown | SD |
| TMEM38B | SNV | Missense_Mutation | novel | c.781N>G | p.Lys261Glu | p.K261E | Q9NVV0 | protein_coding | tolerated(0.42) | benign(0.057) | TCGA-A5-A2K5-01 | Endometrium | uterine corpus endometrioid carcinoma | Female | >=65 | I/II | Unknown | Unknown | SD |
| Page: 1 2 3 4 |
Top |
Related drugs of malignant transformation related genes |
| Identification of chemicals and drugs interact with genes involved in malignant transfromation |
| (DGIdb 4.0) |
| Entrez ID | Symbol | Category | Interaction Types | Drug Claim Name | Drug Name | PMIDs |
| Page: 1 |

Copyright 2023-Present -The University of Texas Health Science Center at Houston |