
|
|||||
|
 | |
| |
| |
| |
| |
| |
|
Gene: TMEM33 |
Gene summary for TMEM33 |
| Gene information | Species | Human | Gene symbol | TMEM33 | Gene ID | 55161 |
| Gene name | transmembrane protein 33 | |
| Gene Alias | 1600019D15Rik | |
| Cytomap | 4p13 | |
| Gene Type | protein-coding | GO ID | GO:0006950 | UniProtAcc | A0A024R9W7 |
Top |
Malignant transformation analysis |
| Identification of the aberrant gene expression in precancerous and cancerous lesions by comparing the gene expression of stem-like cells in diseased tissues with normal stem cells |
| Entrez ID | Symbol | Replicates | Species | Organ | Tissue | Adj P-value | Log2FC | Malignancy |
| 55161 | TMEM33 | LZE2T | Human | Esophagus | ESCC | 6.92e-03 | 6.84e-01 | 0.082 |
| 55161 | TMEM33 | LZE4T | Human | Esophagus | ESCC | 1.71e-12 | 3.10e-01 | 0.0811 |
| 55161 | TMEM33 | LZE8T | Human | Esophagus | ESCC | 6.19e-04 | 2.24e-01 | 0.067 |
| 55161 | TMEM33 | LZE24T | Human | Esophagus | ESCC | 2.05e-08 | 3.07e-01 | 0.0596 |
| 55161 | TMEM33 | P2T-E | Human | Esophagus | ESCC | 1.17e-18 | 3.91e-01 | 0.1177 |
| 55161 | TMEM33 | P4T-E | Human | Esophagus | ESCC | 3.98e-18 | 5.19e-01 | 0.1323 |
| 55161 | TMEM33 | P5T-E | Human | Esophagus | ESCC | 1.18e-14 | 3.03e-01 | 0.1327 |
| 55161 | TMEM33 | P8T-E | Human | Esophagus | ESCC | 1.62e-25 | 4.24e-01 | 0.0889 |
| 55161 | TMEM33 | P9T-E | Human | Esophagus | ESCC | 4.68e-06 | 2.80e-01 | 0.1131 |
| 55161 | TMEM33 | P10T-E | Human | Esophagus | ESCC | 8.24e-25 | 5.58e-01 | 0.116 |
| 55161 | TMEM33 | P11T-E | Human | Esophagus | ESCC | 4.99e-07 | 3.55e-01 | 0.1426 |
| 55161 | TMEM33 | P12T-E | Human | Esophagus | ESCC | 5.48e-15 | 2.71e-01 | 0.1122 |
| 55161 | TMEM33 | P15T-E | Human | Esophagus | ESCC | 1.28e-17 | 2.81e-01 | 0.1149 |
| 55161 | TMEM33 | P16T-E | Human | Esophagus | ESCC | 8.33e-22 | 4.02e-01 | 0.1153 |
| 55161 | TMEM33 | P17T-E | Human | Esophagus | ESCC | 2.09e-02 | 2.43e-01 | 0.1278 |
| 55161 | TMEM33 | P19T-E | Human | Esophagus | ESCC | 1.07e-04 | 3.47e-01 | 0.1662 |
| 55161 | TMEM33 | P20T-E | Human | Esophagus | ESCC | 4.02e-12 | 2.66e-01 | 0.1124 |
| 55161 | TMEM33 | P21T-E | Human | Esophagus | ESCC | 2.50e-20 | 5.75e-01 | 0.1617 |
| 55161 | TMEM33 | P22T-E | Human | Esophagus | ESCC | 2.25e-24 | 2.63e-01 | 0.1236 |
| 55161 | TMEM33 | P23T-E | Human | Esophagus | ESCC | 6.60e-16 | 5.22e-01 | 0.108 |
| Page: 1 2 3 4 5 6 |
| Tissue | Expression Dynamics | Abbreviation |
| Esophagus | 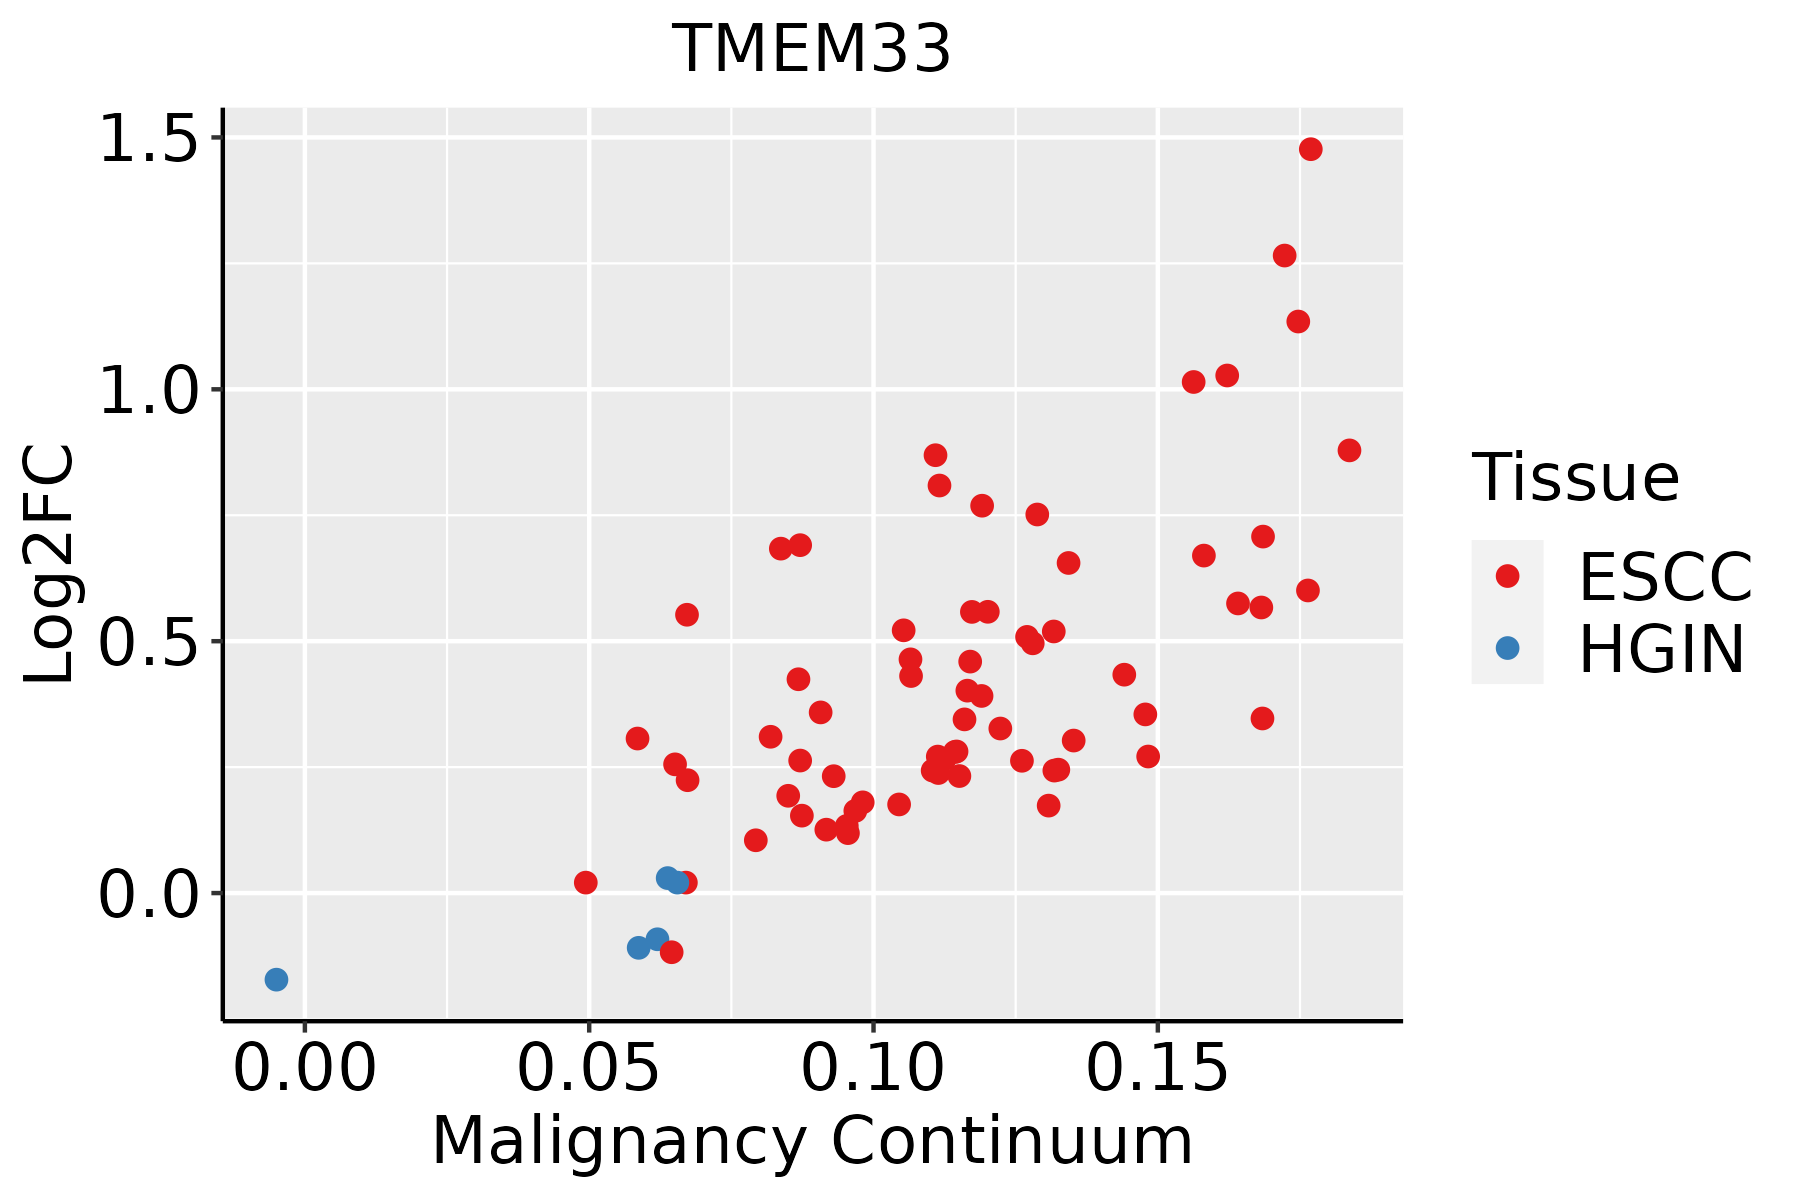 | ESCC: Esophageal squamous cell carcinoma |
| HGIN: High-grade intraepithelial neoplasias | ||
| LGIN: Low-grade intraepithelial neoplasias | ||
| Liver |  | HCC: Hepatocellular carcinoma |
| NAFLD: Non-alcoholic fatty liver disease | ||
| Oral Cavity | 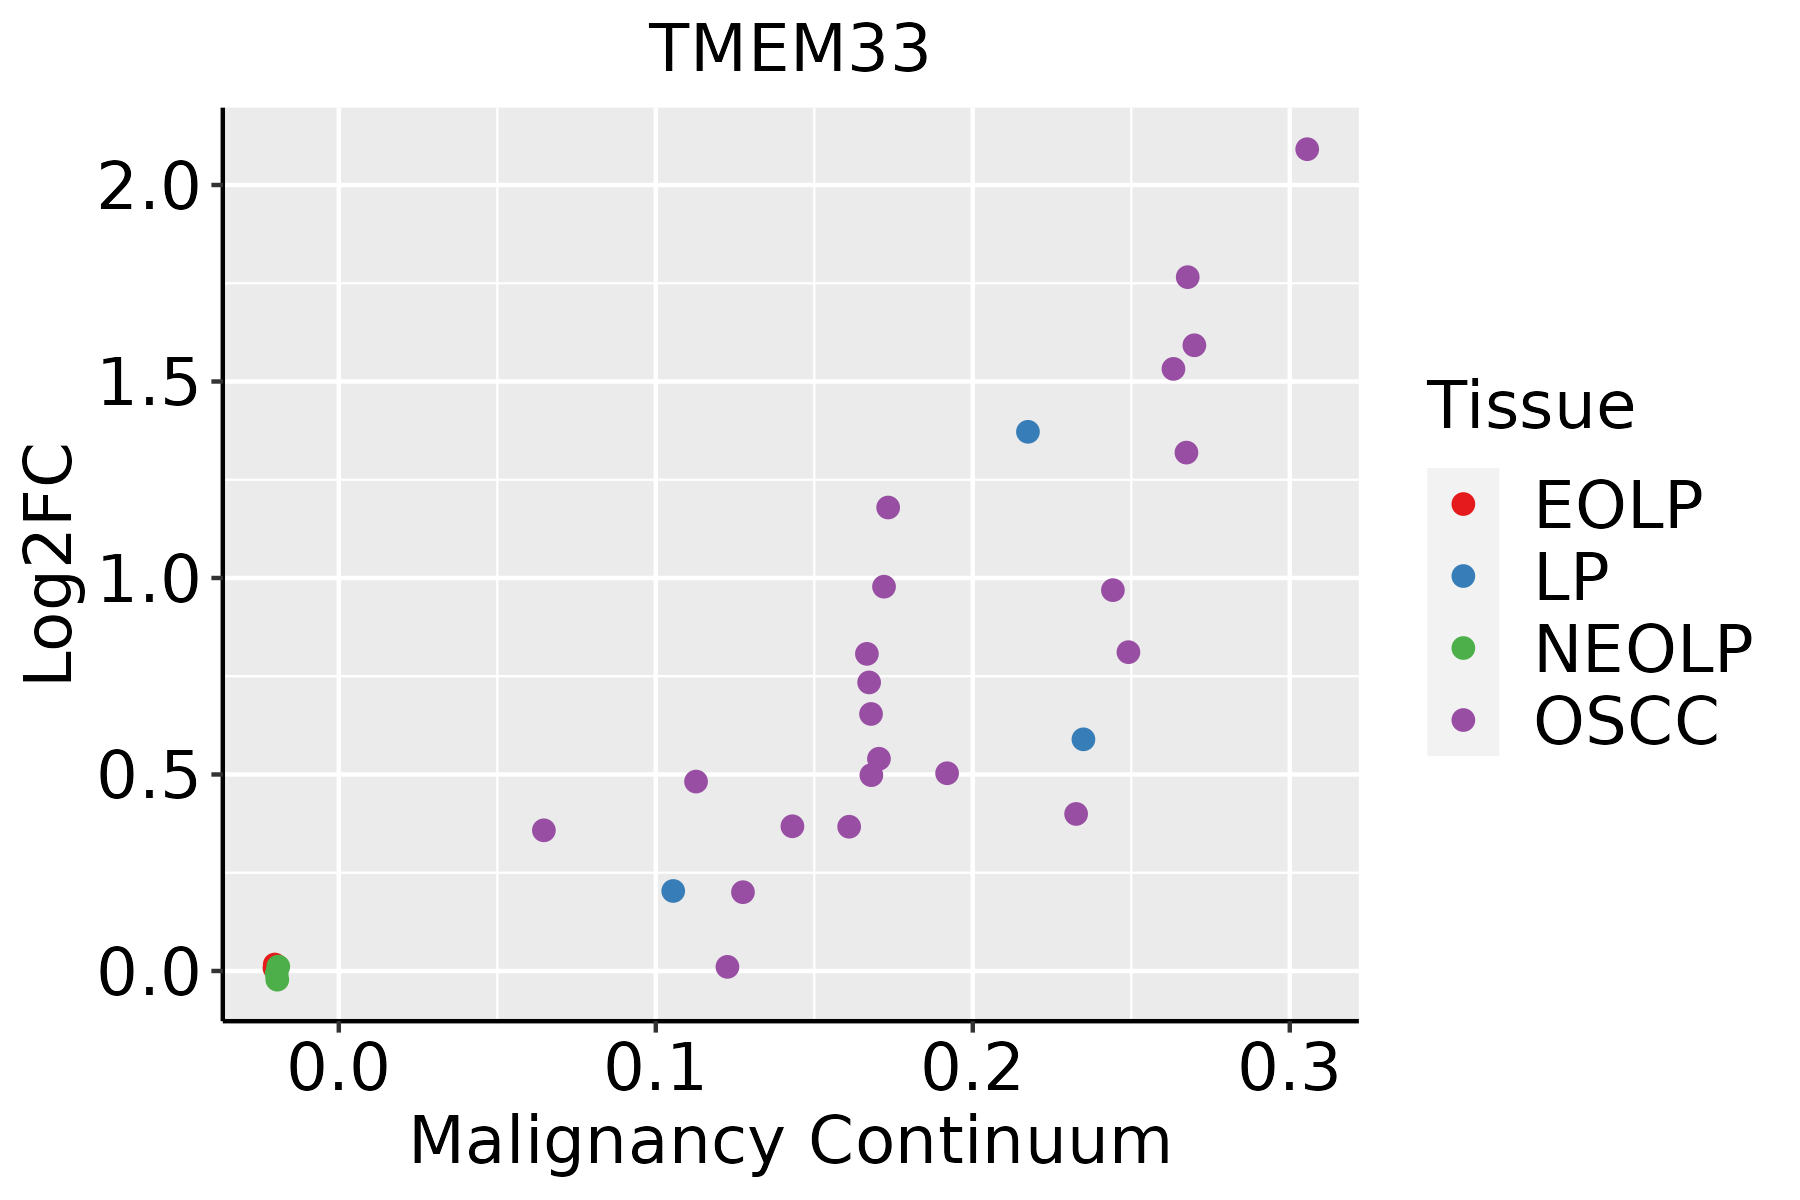 | EOLP: Erosive Oral lichen planus |
| LP: leukoplakia | ||
| NEOLP: Non-erosive oral lichen planus | ||
| OSCC: Oral squamous cell carcinoma | ||
| Skin | 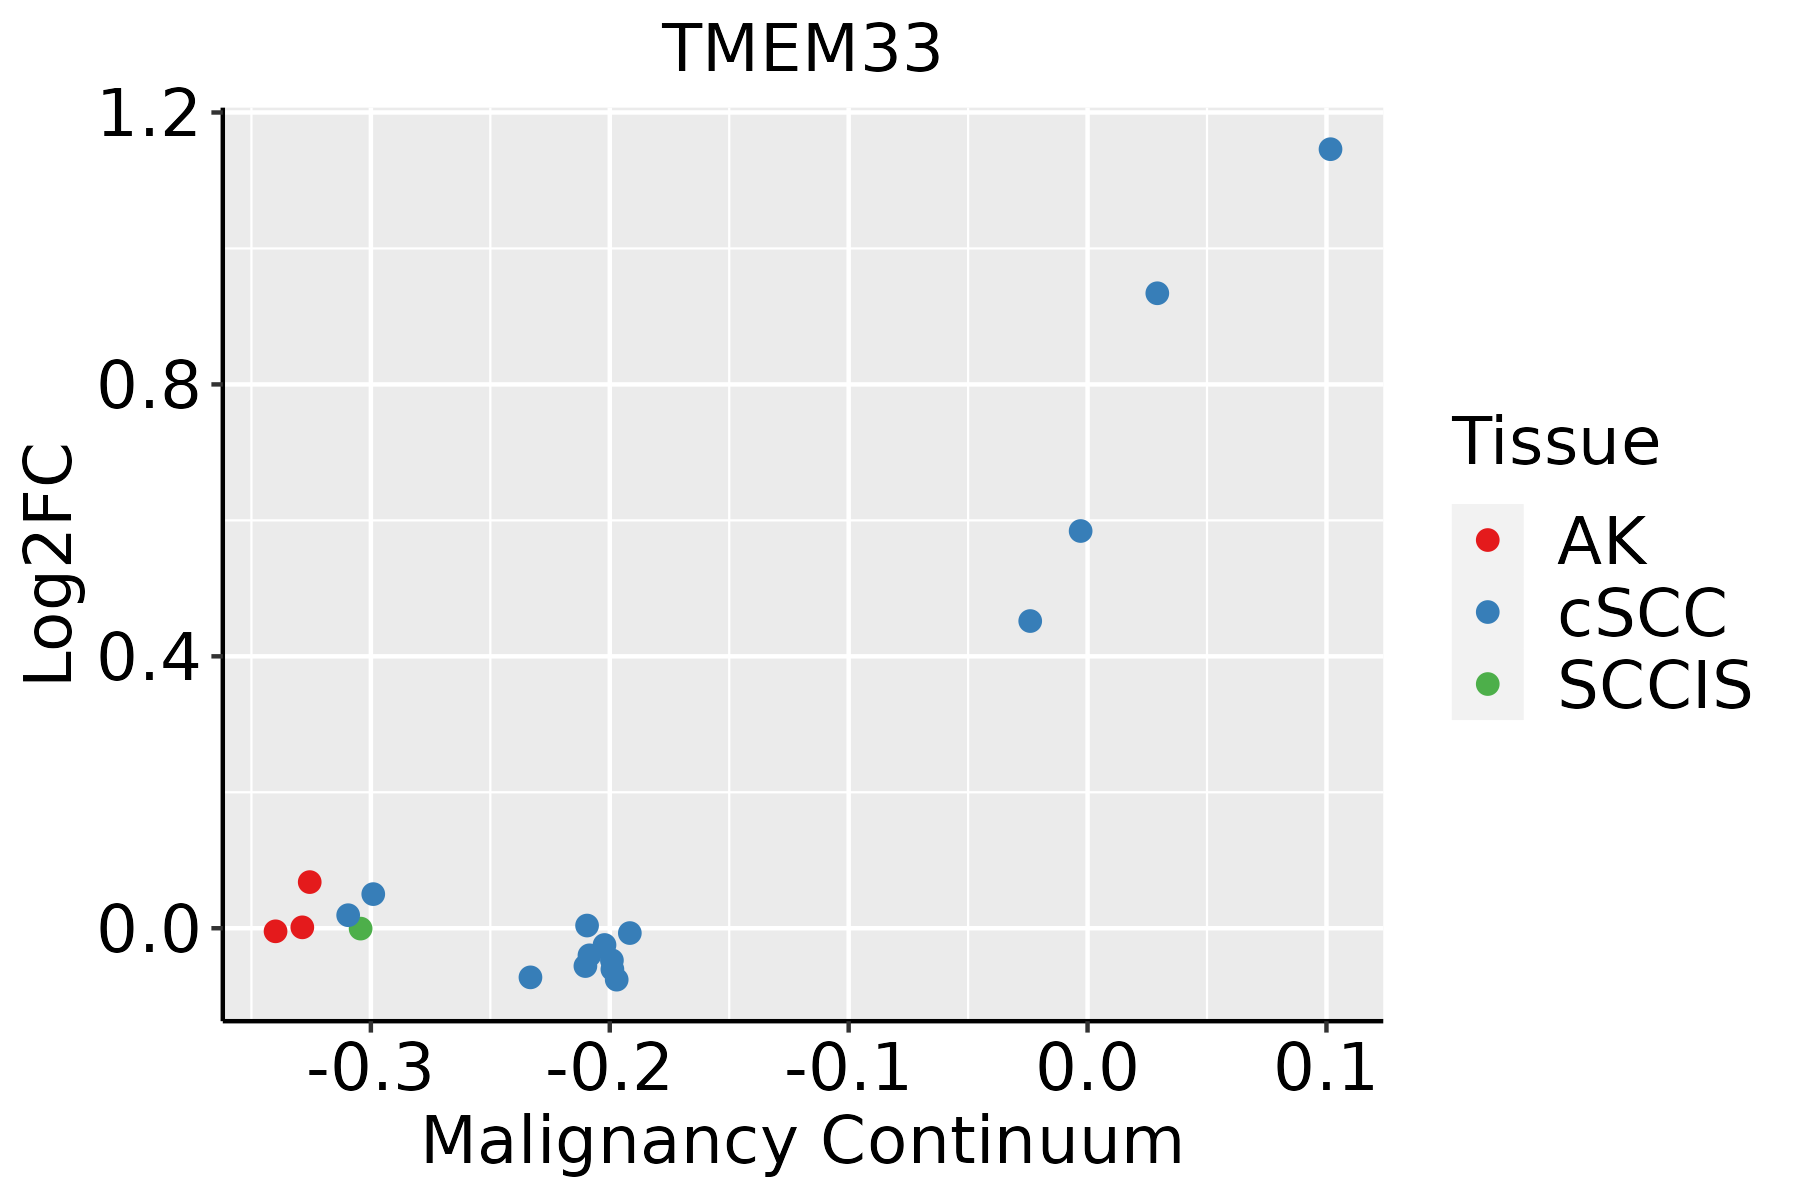 | AK: Actinic keratosis |
| cSCC: Cutaneous squamous cell carcinoma | ||
| SCCIS:squamous cell carcinoma in situ | ||
| Thyroid | 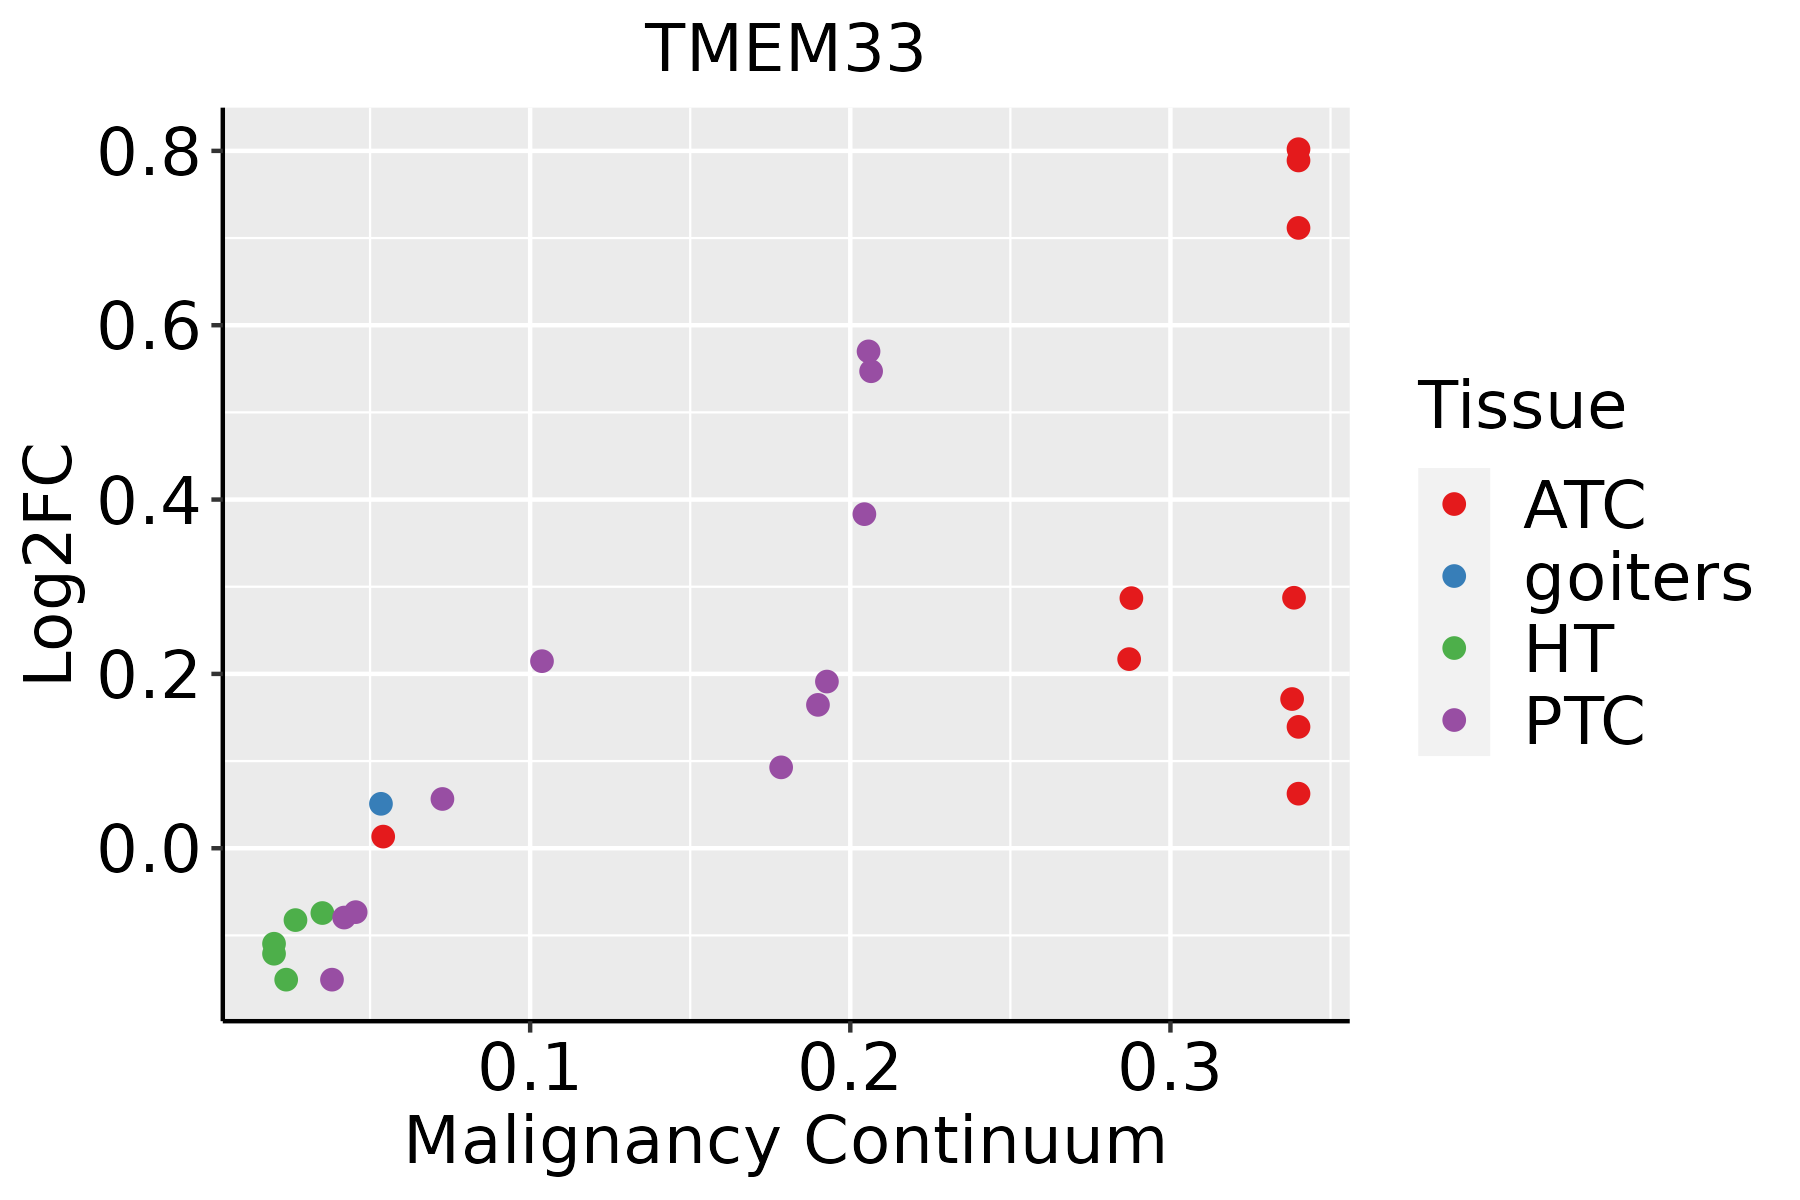 | ATC: Anaplastic thyroid cancer |
| HT: Hashimoto's thyroiditis | ||
| PTC: Papillary thyroid cancer |
| ∗log2FC in expression of this searched gene in stem-like cells from each diseased tissue sample relative to stem-like cells in normal samples in each tissue plotted against the malignancy continuum. Samples are colored based on if they are from different disease stage. |
Top |
Malignant transformation related pathway analysis |
| Find out the enriched GO biological processes and KEGG pathways involved in transition from healthy to precancer to cancer |
| Tissue | Disease Stage | Enriched GO biological Processes |
| Colorectum | AD |  |
| Colorectum | SER |  |
| Colorectum | MSS |  |
| Colorectum | MSI-H |  |
| Colorectum | FAP |  |
| ∗Top 15 enriched GO BP terms are showed in the bar plot of each disease state in each tissue. Each row represents a significant GO biological process which is colored according to the -log10(p.adjust). |
| Page: 1 2 3 4 5 6 7 8 9 |
| GO ID | Tissue | Disease Stage | Description | Gene Ratio | Bg Ratio | pvalue | p.adjust | Count |
| GO:0034976111 | Esophagus | ESCC | response to endoplasmic reticulum stress | 192/8552 | 256/18723 | 7.15e-22 | 1.30e-19 | 192 |
| GO:0035966111 | Esophagus | ESCC | response to topologically incorrect protein | 125/8552 | 159/18723 | 1.44e-17 | 1.27e-15 | 125 |
| GO:0006986111 | Esophagus | ESCC | response to unfolded protein | 107/8552 | 137/18723 | 7.01e-15 | 3.87e-13 | 107 |
| GO:0035967111 | Esophagus | ESCC | cellular response to topologically incorrect protein | 90/8552 | 116/18723 | 1.94e-12 | 8.11e-11 | 90 |
| GO:0034620111 | Esophagus | ESCC | cellular response to unfolded protein | 74/8552 | 96/18723 | 3.10e-10 | 8.66e-09 | 74 |
| GO:003096818 | Esophagus | ESCC | endoplasmic reticulum unfolded protein response | 59/8552 | 74/18723 | 1.90e-09 | 4.36e-08 | 59 |
| GO:1905897111 | Esophagus | ESCC | regulation of response to endoplasmic reticulum stress | 63/8552 | 82/18723 | 8.16e-09 | 1.66e-07 | 63 |
| GO:000702914 | Esophagus | ESCC | endoplasmic reticulum organization | 65/8552 | 87/18723 | 3.28e-08 | 6.08e-07 | 65 |
| GO:000698416 | Esophagus | ESCC | ER-nucleus signaling pathway | 38/8552 | 46/18723 | 2.70e-07 | 4.00e-06 | 38 |
| GO:190589813 | Esophagus | ESCC | positive regulation of response to endoplasmic reticulum stress | 29/8552 | 35/18723 | 6.61e-06 | 6.75e-05 | 29 |
| GO:190010110 | Esophagus | ESCC | regulation of endoplasmic reticulum unfolded protein response | 24/8552 | 30/18723 | 1.27e-04 | 8.67e-04 | 24 |
| GO:014046713 | Esophagus | ESCC | integrated stress response signaling | 18/8552 | 22/18723 | 5.69e-04 | 3.10e-03 | 18 |
| GO:19001035 | Esophagus | ESCC | positive regulation of endoplasmic reticulum unfolded protein response | 12/8552 | 13/18723 | 6.18e-04 | 3.32e-03 | 12 |
| GO:00364986 | Esophagus | ESCC | IRE1-mediated unfolded protein response | 16/8552 | 19/18723 | 6.45e-04 | 3.43e-03 | 16 |
| GO:003649913 | Esophagus | ESCC | PERK-mediated unfolded protein response | 15/8552 | 18/18723 | 1.20e-03 | 5.88e-03 | 15 |
| GO:00717865 | Esophagus | ESCC | endoplasmic reticulum tubular network organization | 15/8552 | 18/18723 | 1.20e-03 | 5.88e-03 | 15 |
| GO:19038943 | Esophagus | ESCC | regulation of IRE1-mediated unfolded protein response | 12/8552 | 14/18723 | 2.51e-03 | 1.08e-02 | 12 |
| GO:00349767 | Liver | Cirrhotic | response to endoplasmic reticulum stress | 130/4634 | 256/18723 | 1.72e-19 | 3.86e-17 | 130 |
| GO:00359667 | Liver | Cirrhotic | response to topologically incorrect protein | 91/4634 | 159/18723 | 2.07e-18 | 3.60e-16 | 91 |
| GO:00069867 | Liver | Cirrhotic | response to unfolded protein | 79/4634 | 137/18723 | 1.99e-16 | 2.49e-14 | 79 |
| Page: 1 2 3 4 5 6 7 |
| Pathway ID | Tissue | Disease Stage | Description | Gene Ratio | Bg Ratio | pvalue | p.adjust | qvalue | Count |
| hsa0301321 | Esophagus | ESCC | Nucleocytoplasmic transport | 89/4205 | 108/8465 | 1.20e-12 | 2.37e-11 | 1.21e-11 | 89 |
| hsa0301331 | Esophagus | ESCC | Nucleocytoplasmic transport | 89/4205 | 108/8465 | 1.20e-12 | 2.37e-11 | 1.21e-11 | 89 |
| hsa03013 | Liver | HCC | Nucleocytoplasmic transport | 81/4020 | 108/8465 | 4.28e-09 | 6.83e-08 | 3.80e-08 | 81 |
| hsa030131 | Liver | HCC | Nucleocytoplasmic transport | 81/4020 | 108/8465 | 4.28e-09 | 6.83e-08 | 3.80e-08 | 81 |
| hsa030136 | Oral cavity | OSCC | Nucleocytoplasmic transport | 82/3704 | 108/8465 | 7.93e-12 | 1.33e-10 | 6.77e-11 | 82 |
| hsa0301311 | Oral cavity | OSCC | Nucleocytoplasmic transport | 82/3704 | 108/8465 | 7.93e-12 | 1.33e-10 | 6.77e-11 | 82 |
| hsa030132 | Oral cavity | LP | Nucleocytoplasmic transport | 53/2418 | 108/8465 | 4.68e-06 | 4.10e-05 | 2.64e-05 | 53 |
| hsa030133 | Oral cavity | LP | Nucleocytoplasmic transport | 53/2418 | 108/8465 | 4.68e-06 | 4.10e-05 | 2.64e-05 | 53 |
| Page: 1 |
Top |
Cell-cell communication analysis |
| Identification of potential cell-cell interactions between two cell types and their ligand-receptor pairs for different disease states |
| Ligand | Receptor | LRpair | Pathway | Tissue | Disease Stage |
| Page: 1 |
Top |
Single-cell gene regulatory network inference analysis |
| Find out the significant the regulons (TFs) and the target genes of each regulon across cell types for different disease states |
| TF | Cell Type | Tissue | Disease Stage | Target Gene | RSS | Regulon Activity |
| ∗The dot plots of a searched regulon are shown for all cell subpopulations in each disease state of each tissue based on the regulon specific score inferred using pySCENIC and by calculating the average expression. |
| Page: 1 |
Top |
Somatic mutation of malignant transformation related genes |
| Annotation of somatic variants for genes involved in malignant transformation |
| Hugo Symbol | Variant Class | Variant Classification | dbSNP RS | HGVSc | HGVSp | HGVSp Short | SWISSPROT | BIOTYPE | SIFT | PolyPhen | Tumor Sample Barcode | Tissue | Histology | Sex | Age | Stage | Therapy Types | Drugs | Outcome |
| TMEM33 | SNV | Missense_Mutation | c.101N>T | p.Thr34Ile | p.T34I | P57088 | protein_coding | deleterious(0) | probably_damaging(0.999) | TCGA-BH-A0HW-01 | Breast | breast invasive carcinoma | Female | <65 | I/II | Chemotherapy | doxorubicin | SD | |
| TMEM33 | SNV | Missense_Mutation | c.160T>G | p.Phe54Val | p.F54V | P57088 | protein_coding | tolerated(0.23) | benign(0.149) | TCGA-AA-3811-01 | Colorectum | colon adenocarcinoma | Female | >=65 | III/IV | Unknown | Unknown | PD | |
| TMEM33 | SNV | Missense_Mutation | rs140993747 | c.509N>T | p.Ala170Val | p.A170V | P57088 | protein_coding | tolerated(0.68) | benign(0.109) | TCGA-AA-3984-01 | Colorectum | colon adenocarcinoma | Female | <65 | I/II | Unknown | Unknown | SD |
| TMEM33 | SNV | Missense_Mutation | c.76N>T | p.Ala26Ser | p.A26S | P57088 | protein_coding | tolerated(0.18) | probably_damaging(0.983) | TCGA-AA-A022-01 | Colorectum | colon adenocarcinoma | Female | >=65 | I/II | Unknown | Unknown | SD | |
| TMEM33 | SNV | Missense_Mutation | c.632N>C | p.Leu211Pro | p.L211P | P57088 | protein_coding | deleterious(0) | probably_damaging(0.939) | TCGA-CM-6162-01 | Colorectum | colon adenocarcinoma | Female | <65 | III/IV | Chemotherapy | oxaliplatin | SD | |
| TMEM33 | SNV | Missense_Mutation | rs745345411 | c.514G>T | p.Val172Phe | p.V172F | P57088 | protein_coding | tolerated(0.08) | possibly_damaging(0.452) | TCGA-A5-A0G2-01 | Endometrium | uterine corpus endometrioid carcinoma | Female | <65 | III/IV | Unknown | Unknown | SD |
| TMEM33 | SNV | Missense_Mutation | rs140993747 | c.509N>T | p.Ala170Val | p.A170V | P57088 | protein_coding | tolerated(0.68) | benign(0.109) | TCGA-A5-A1OF-01 | Endometrium | uterine corpus endometrioid carcinoma | Female | <65 | I/II | Unknown | Unknown | SD |
| TMEM33 | SNV | Missense_Mutation | novel | c.580N>A | p.Leu194Ile | p.L194I | P57088 | protein_coding | deleterious(0.04) | benign(0.373) | TCGA-AP-A1DK-01 | Endometrium | uterine corpus endometrioid carcinoma | Female | <65 | I/II | Unknown | Unknown | SD |
| TMEM33 | SNV | Missense_Mutation | novel | c.727N>A | p.Ala243Thr | p.A243T | P57088 | protein_coding | tolerated(0.07) | possibly_damaging(0.887) | TCGA-AX-A0J1-01 | Endometrium | uterine corpus endometrioid carcinoma | Female | >=65 | I/II | Unknown | Unknown | SD |
| TMEM33 | SNV | Missense_Mutation | c.164N>G | p.Tyr55Cys | p.Y55C | P57088 | protein_coding | deleterious(0) | probably_damaging(0.999) | TCGA-D1-A16X-01 | Endometrium | uterine corpus endometrioid carcinoma | Female | <65 | I/II | Unknown | Unknown | SD |
| Page: 1 2 |
Top |
Related drugs of malignant transformation related genes |
| Identification of chemicals and drugs interact with genes involved in malignant transfromation |
| (DGIdb 4.0) |
| Entrez ID | Symbol | Category | Interaction Types | Drug Claim Name | Drug Name | PMIDs |
| Page: 1 |

Copyright 2023-Present -The University of Texas Health Science Center at Houston |