
|
|||||
|
 | |
| |
| |
| |
| |
| |
|
Gene: TMEM30B |
Gene summary for TMEM30B |
| Gene information | Species | Human | Gene symbol | TMEM30B | Gene ID | 161291 |
| Gene name | transmembrane protein 30B | |
| Gene Alias | CDC50B | |
| Cytomap | 14q23.1 | |
| Gene Type | protein-coding | GO ID | GO:0006810 | UniProtAcc | Q3MIR4 |
Top |
Malignant transformation analysis |
| Identification of the aberrant gene expression in precancerous and cancerous lesions by comparing the gene expression of stem-like cells in diseased tissues with normal stem cells |
| Entrez ID | Symbol | Replicates | Species | Organ | Tissue | Adj P-value | Log2FC | Malignancy |
| 161291 | TMEM30B | LZE7T | Human | Esophagus | ESCC | 5.81e-05 | -2.11e-01 | 0.0667 |
| 161291 | TMEM30B | LZE8T | Human | Esophagus | ESCC | 1.04e-02 | -3.08e-01 | 0.067 |
| 161291 | TMEM30B | LZE24T | Human | Esophagus | ESCC | 1.13e-09 | 5.78e-01 | 0.0596 |
| 161291 | TMEM30B | P1T-E | Human | Esophagus | ESCC | 1.56e-03 | 1.35e-01 | 0.0875 |
| 161291 | TMEM30B | P2T-E | Human | Esophagus | ESCC | 2.32e-25 | 3.88e-02 | 0.1177 |
| 161291 | TMEM30B | P4T-E | Human | Esophagus | ESCC | 3.82e-09 | 3.93e-01 | 0.1323 |
| 161291 | TMEM30B | P5T-E | Human | Esophagus | ESCC | 1.90e-10 | -8.04e-02 | 0.1327 |
| 161291 | TMEM30B | P8T-E | Human | Esophagus | ESCC | 1.17e-20 | 6.48e-01 | 0.0889 |
| 161291 | TMEM30B | P9T-E | Human | Esophagus | ESCC | 2.43e-12 | -9.14e-02 | 0.1131 |
| 161291 | TMEM30B | P10T-E | Human | Esophagus | ESCC | 1.98e-17 | 3.87e-01 | 0.116 |
| 161291 | TMEM30B | P12T-E | Human | Esophagus | ESCC | 3.96e-17 | 5.03e-01 | 0.1122 |
| 161291 | TMEM30B | P15T-E | Human | Esophagus | ESCC | 1.07e-18 | 7.72e-01 | 0.1149 |
| 161291 | TMEM30B | P16T-E | Human | Esophagus | ESCC | 1.98e-13 | 4.72e-02 | 0.1153 |
| 161291 | TMEM30B | P19T-E | Human | Esophagus | ESCC | 4.81e-04 | -1.23e-01 | 0.1662 |
| 161291 | TMEM30B | P20T-E | Human | Esophagus | ESCC | 9.92e-08 | 2.70e-01 | 0.1124 |
| 161291 | TMEM30B | P21T-E | Human | Esophagus | ESCC | 1.21e-08 | -2.90e-01 | 0.1617 |
| 161291 | TMEM30B | P22T-E | Human | Esophagus | ESCC | 2.82e-14 | 3.88e-02 | 0.1236 |
| 161291 | TMEM30B | P23T-E | Human | Esophagus | ESCC | 7.40e-04 | 2.93e-01 | 0.108 |
| 161291 | TMEM30B | P24T-E | Human | Esophagus | ESCC | 3.70e-09 | -5.06e-02 | 0.1287 |
| 161291 | TMEM30B | P26T-E | Human | Esophagus | ESCC | 2.29e-30 | 8.44e-01 | 0.1276 |
| Page: 1 2 3 4 5 |
| Tissue | Expression Dynamics | Abbreviation |
| Esophagus | 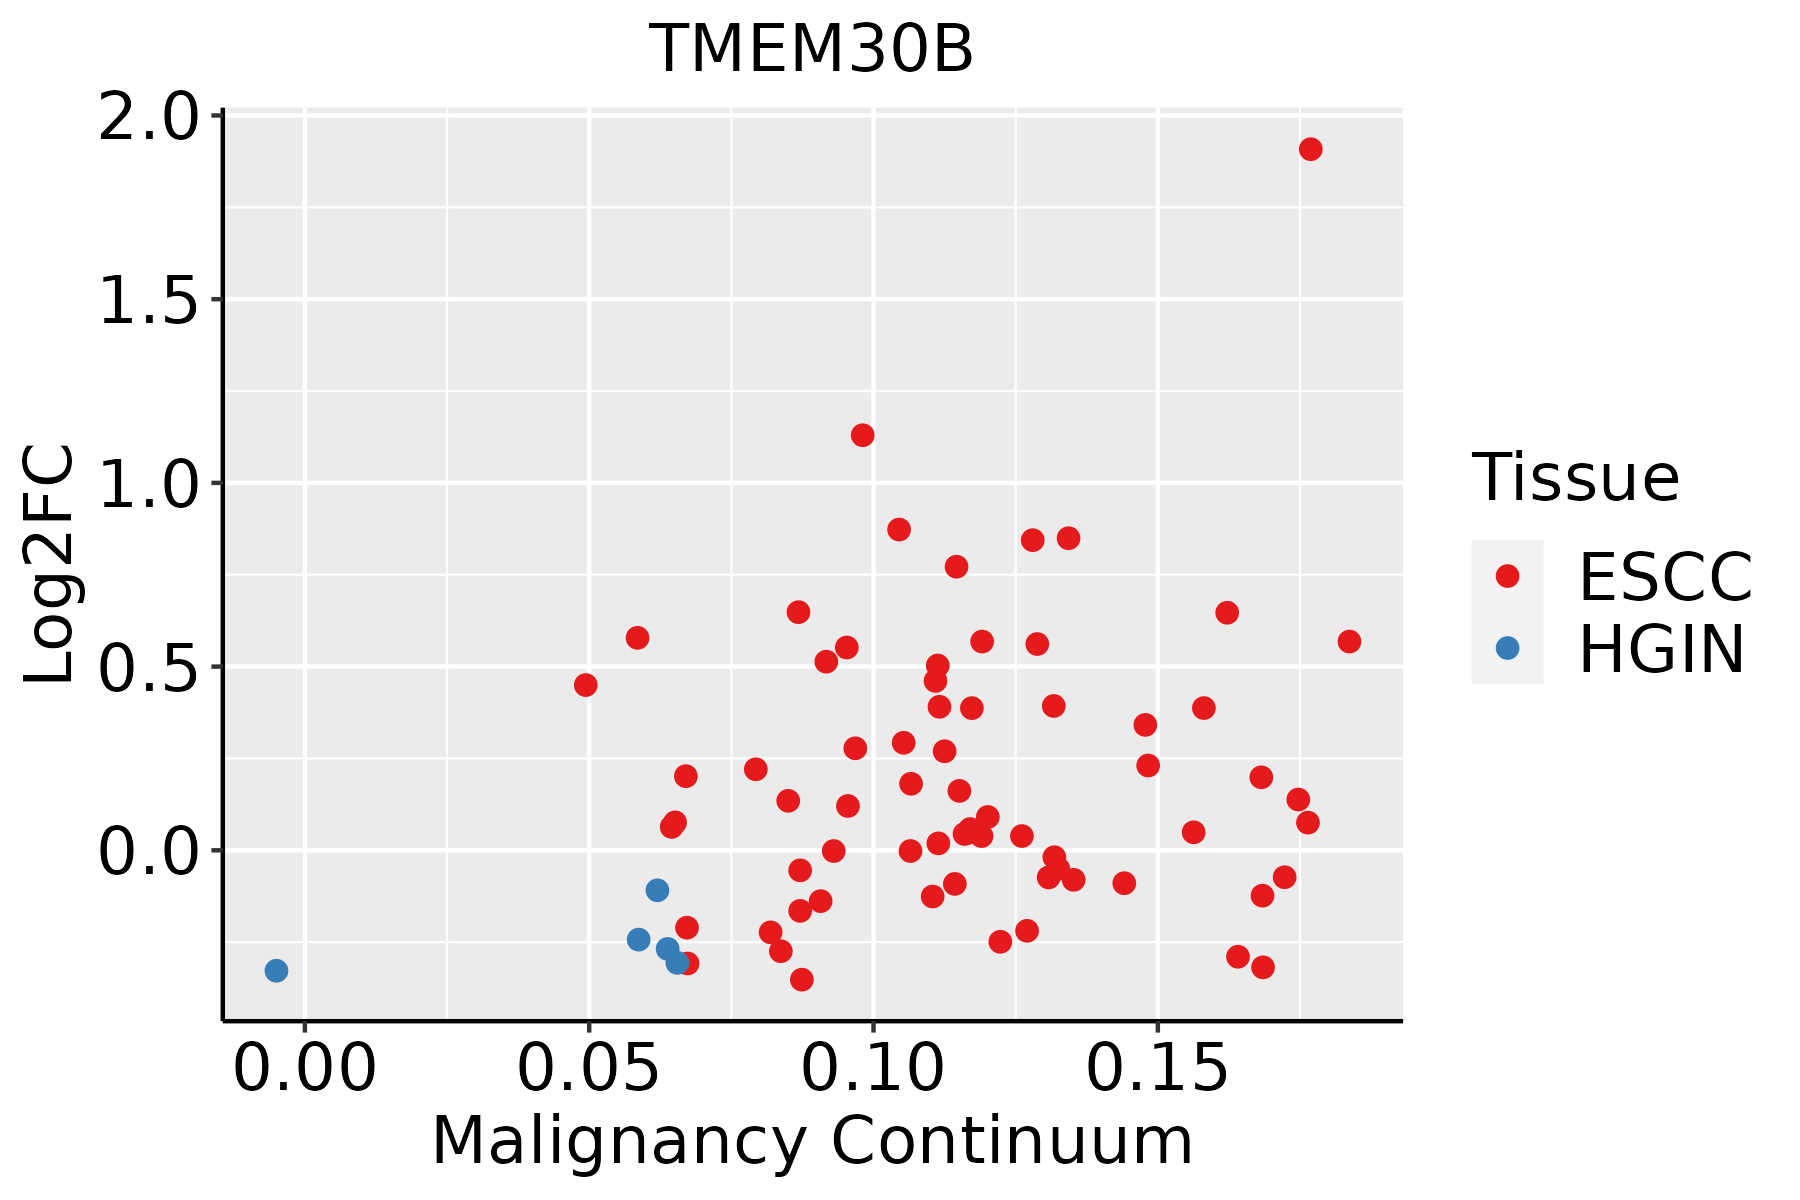 | ESCC: Esophageal squamous cell carcinoma |
| HGIN: High-grade intraepithelial neoplasias | ||
| LGIN: Low-grade intraepithelial neoplasias | ||
| Oral Cavity | 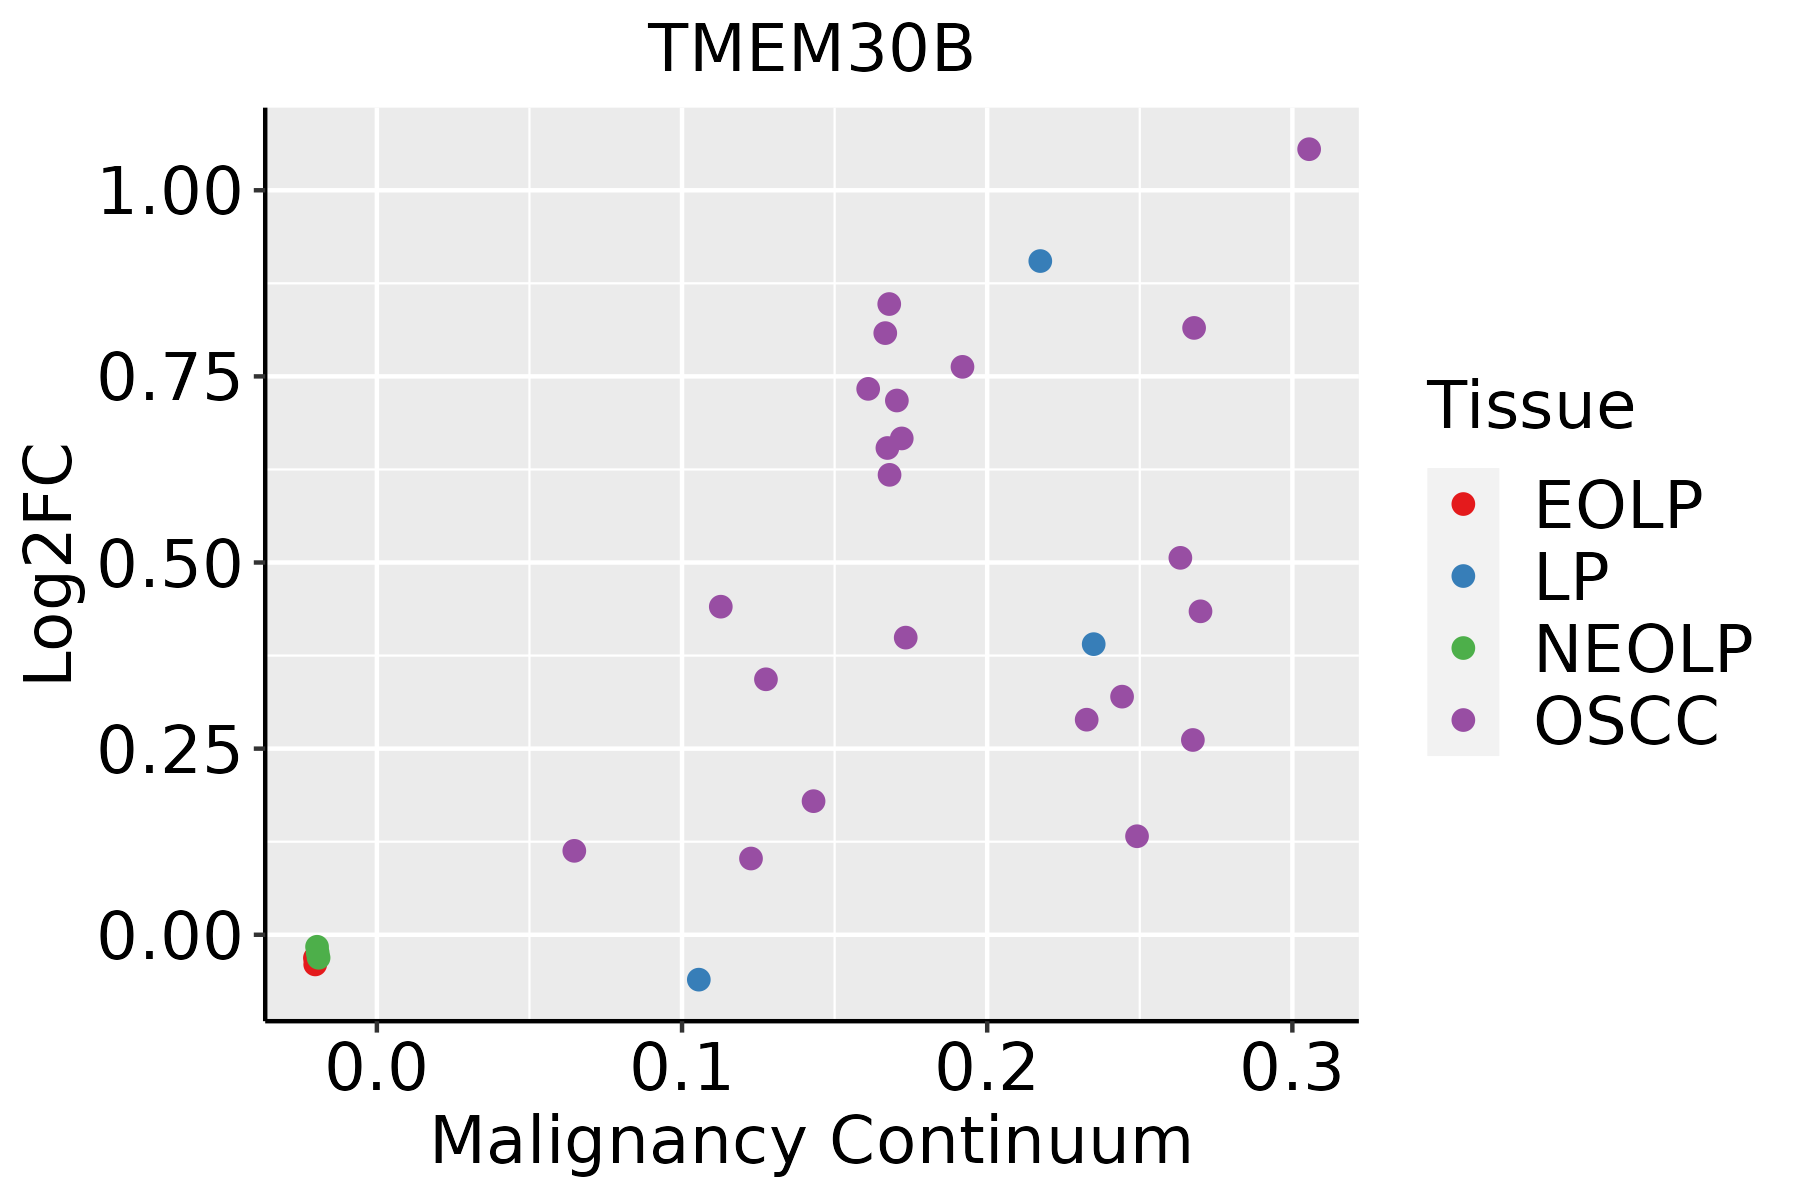 | EOLP: Erosive Oral lichen planus |
| LP: leukoplakia | ||
| NEOLP: Non-erosive oral lichen planus | ||
| OSCC: Oral squamous cell carcinoma | ||
| Thyroid |  | ATC: Anaplastic thyroid cancer |
| HT: Hashimoto's thyroiditis | ||
| PTC: Papillary thyroid cancer |
| ∗log2FC in expression of this searched gene in stem-like cells from each diseased tissue sample relative to stem-like cells in normal samples in each tissue plotted against the malignancy continuum. Samples are colored based on if they are from different disease stage. |
Top |
Malignant transformation related pathway analysis |
| Find out the enriched GO biological processes and KEGG pathways involved in transition from healthy to precancer to cancer |
| Tissue | Disease Stage | Enriched GO biological Processes |
| Colorectum | AD |  |
| Colorectum | SER |  |
| Colorectum | MSS |  |
| Colorectum | MSI-H |  |
| Colorectum | FAP |  |
| ∗Top 15 enriched GO BP terms are showed in the bar plot of each disease state in each tissue. Each row represents a significant GO biological process which is colored according to the -log10(p.adjust). |
| Page: 1 2 3 4 5 6 7 8 9 |
| GO ID | Tissue | Disease Stage | Description | Gene Ratio | Bg Ratio | pvalue | p.adjust | Count |
| GO:003238618 | Esophagus | ESCC | regulation of intracellular transport | 243/8552 | 337/18723 | 3.20e-23 | 7.25e-21 | 243 |
| GO:0033157110 | Esophagus | ESCC | regulation of intracellular protein transport | 169/8552 | 229/18723 | 3.31e-18 | 3.23e-16 | 169 |
| GO:0032388110 | Esophagus | ESCC | positive regulation of intracellular transport | 152/8552 | 202/18723 | 7.89e-18 | 7.36e-16 | 152 |
| GO:1904951111 | Esophagus | ESCC | positive regulation of establishment of protein localization | 216/8552 | 319/18723 | 1.01e-15 | 6.86e-14 | 216 |
| GO:009031617 | Esophagus | ESCC | positive regulation of intracellular protein transport | 122/8552 | 160/18723 | 2.45e-15 | 1.49e-13 | 122 |
| GO:0051222111 | Esophagus | ESCC | positive regulation of protein transport | 204/8552 | 303/18723 | 1.56e-14 | 8.38e-13 | 204 |
| GO:003252714 | Esophagus | ESCC | protein exit from endoplasmic reticulum | 37/8552 | 48/18723 | 8.99e-06 | 8.65e-05 | 37 |
| GO:00708615 | Esophagus | ESCC | regulation of protein exit from endoplasmic reticulum | 19/8552 | 27/18723 | 8.35e-03 | 2.95e-02 | 19 |
| GO:003238615 | Oral cavity | OSCC | regulation of intracellular transport | 218/7305 | 337/18723 | 6.91e-22 | 1.41e-19 | 218 |
| GO:003315718 | Oral cavity | OSCC | regulation of intracellular protein transport | 155/7305 | 229/18723 | 1.05e-18 | 1.28e-16 | 155 |
| GO:190495119 | Oral cavity | OSCC | positive regulation of establishment of protein localization | 196/7305 | 319/18723 | 2.89e-16 | 2.20e-14 | 196 |
| GO:005122219 | Oral cavity | OSCC | positive regulation of protein transport | 187/7305 | 303/18723 | 7.37e-16 | 5.49e-14 | 187 |
| GO:003238818 | Oral cavity | OSCC | positive regulation of intracellular transport | 134/7305 | 202/18723 | 2.82e-15 | 1.88e-13 | 134 |
| GO:009031610 | Oral cavity | OSCC | positive regulation of intracellular protein transport | 110/7305 | 160/18723 | 2.10e-14 | 1.19e-12 | 110 |
| GO:00325276 | Oral cavity | OSCC | protein exit from endoplasmic reticulum | 36/7305 | 48/18723 | 4.31e-07 | 6.36e-06 | 36 |
| GO:00708614 | Oral cavity | OSCC | regulation of protein exit from endoplasmic reticulum | 20/7305 | 27/18723 | 2.32e-04 | 1.51e-03 | 20 |
| GO:003238616 | Oral cavity | LP | regulation of intracellular transport | 145/4623 | 337/18723 | 8.58e-14 | 8.27e-12 | 145 |
| GO:003238819 | Oral cavity | LP | positive regulation of intracellular transport | 97/4623 | 202/18723 | 4.79e-13 | 4.30e-11 | 97 |
| GO:003315719 | Oral cavity | LP | regulation of intracellular protein transport | 106/4623 | 229/18723 | 7.85e-13 | 6.68e-11 | 106 |
| GO:1904951110 | Oral cavity | LP | positive regulation of establishment of protein localization | 132/4623 | 319/18723 | 3.06e-11 | 2.00e-09 | 132 |
| Page: 1 2 3 |
| Pathway ID | Tissue | Disease Stage | Description | Gene Ratio | Bg Ratio | pvalue | p.adjust | qvalue | Count |
| Page: 1 |
Top |
Cell-cell communication analysis |
| Identification of potential cell-cell interactions between two cell types and their ligand-receptor pairs for different disease states |
| Ligand | Receptor | LRpair | Pathway | Tissue | Disease Stage |
| Page: 1 |
Top |
Single-cell gene regulatory network inference analysis |
| Find out the significant the regulons (TFs) and the target genes of each regulon across cell types for different disease states |
| TF | Cell Type | Tissue | Disease Stage | Target Gene | RSS | Regulon Activity |
| ∗The dot plots of a searched regulon are shown for all cell subpopulations in each disease state of each tissue based on the regulon specific score inferred using pySCENIC and by calculating the average expression. |
| Page: 1 |
Top |
Somatic mutation of malignant transformation related genes |
| Annotation of somatic variants for genes involved in malignant transformation |
| Hugo Symbol | Variant Class | Variant Classification | dbSNP RS | HGVSc | HGVSp | HGVSp Short | SWISSPROT | BIOTYPE | SIFT | PolyPhen | Tumor Sample Barcode | Tissue | Histology | Sex | Age | Stage | Therapy Types | Drugs | Outcome |
| TMEM30B | SNV | Missense_Mutation | novel | c.1042N>A | p.Asp348Asn | p.D348N | Q3MIR4 | protein_coding | tolerated(0.15) | benign(0.001) | TCGA-2W-A8YY-01 | Cervix | cervical & endocervical cancer | Female | <65 | I/II | Chemotherapy | cisplatin | CR |
| TMEM30B | SNV | Missense_Mutation | c.172N>G | p.Asn58Asp | p.N58D | Q3MIR4 | protein_coding | tolerated(0.31) | benign(0.291) | TCGA-EK-A2PG-01 | Cervix | cervical & endocervical cancer | Female | >=65 | I/II | Unknown | Unknown | SD | |
| TMEM30B | SNV | Missense_Mutation | novel | c.1031A>G | p.Asp344Gly | p.D344G | Q3MIR4 | protein_coding | tolerated(0.15) | possibly_damaging(0.85) | TCGA-FU-A3HZ-01 | Cervix | cervical & endocervical cancer | Female | <65 | I/II | Chemotherapy | cisplatin | CR |
| TMEM30B | SNV | Missense_Mutation | rs756178430 | c.296N>T | p.Ser99Leu | p.S99L | Q3MIR4 | protein_coding | deleterious(0.03) | benign(0.14) | TCGA-FU-A3NI-01 | Cervix | cervical & endocervical cancer | Female | <65 | I/II | Unknown | Unknown | SD |
| TMEM30B | SNV | Missense_Mutation | c.893N>A | p.Gly298Asp | p.G298D | Q3MIR4 | protein_coding | deleterious(0) | probably_damaging(1) | TCGA-AA-3672-01 | Colorectum | colon adenocarcinoma | Female | >=65 | III/IV | Unknown | Unknown | SD | |
| TMEM30B | SNV | Missense_Mutation | novel | c.939N>T | p.Lys313Asn | p.K313N | Q3MIR4 | protein_coding | deleterious(0) | probably_damaging(0.986) | TCGA-AA-A00N-01 | Colorectum | colon adenocarcinoma | Male | >=65 | I/II | Unknown | Unknown | PD |
| TMEM30B | SNV | Missense_Mutation | c.617N>A | p.Phe206Tyr | p.F206Y | Q3MIR4 | protein_coding | tolerated(0.14) | benign(0.193) | TCGA-CK-4951-01 | Colorectum | colon adenocarcinoma | Female | >=65 | I/II | Unknown | Unknown | PD | |
| TMEM30B | SNV | Missense_Mutation | novel | c.1036N>A | p.Asp346Asn | p.D346N | Q3MIR4 | protein_coding | tolerated(1) | benign(0) | TCGA-AX-A06F-01 | Endometrium | uterine corpus endometrioid carcinoma | Female | <65 | III/IV | Chemotherapy | carboplatin | SD |
| TMEM30B | SNV | Missense_Mutation | novel | c.583N>A | p.Gly195Ser | p.G195S | Q3MIR4 | protein_coding | deleterious(0) | possibly_damaging(0.457) | TCGA-AX-A2HD-01 | Endometrium | uterine corpus endometrioid carcinoma | Female | >=65 | III/IV | Unknown | Unknown | SD |
| TMEM30B | SNV | Missense_Mutation | novel | c.812N>G | p.Gln271Arg | p.Q271R | Q3MIR4 | protein_coding | tolerated(0.28) | benign(0.001) | TCGA-BS-A0UJ-01 | Endometrium | uterine corpus endometrioid carcinoma | Female | >=65 | I/II | Unknown | Unknown | SD |
| Page: 1 2 |
Top |
Related drugs of malignant transformation related genes |
| Identification of chemicals and drugs interact with genes involved in malignant transfromation |
| (DGIdb 4.0) |
| Entrez ID | Symbol | Category | Interaction Types | Drug Claim Name | Drug Name | PMIDs |
| Page: 1 |

Copyright 2023-Present -The University of Texas Health Science Center at Houston |