
|
|||||
|
 | |
| |
| |
| |
| |
| |
|
Gene: TMEM260 |
Gene summary for TMEM260 |
| Gene information | Species | Human | Gene symbol | TMEM260 | Gene ID | 54916 |
| Gene name | transmembrane protein 260 | |
| Gene Alias | C14orf101 | |
| Cytomap | 14q22.3 | |
| Gene Type | protein-coding | GO ID | GO:0005575 | UniProtAcc | B3KN73 |
Top |
Malignant transformation analysis |
| Identification of the aberrant gene expression in precancerous and cancerous lesions by comparing the gene expression of stem-like cells in diseased tissues with normal stem cells |
| Entrez ID | Symbol | Replicates | Species | Organ | Tissue | Adj P-value | Log2FC | Malignancy |
| 54916 | TMEM260 | H2 | Human | Cervix | HSIL_HPV | 6.28e-32 | 9.74e-01 | 0.0632 |
| 54916 | TMEM260 | LZE4T | Human | Esophagus | ESCC | 2.36e-15 | 2.91e-01 | 0.0811 |
| 54916 | TMEM260 | LZE5T | Human | Esophagus | ESCC | 1.29e-02 | 2.16e-01 | 0.0514 |
| 54916 | TMEM260 | LZE24T | Human | Esophagus | ESCC | 5.14e-11 | 2.69e-01 | 0.0596 |
| 54916 | TMEM260 | LZE21T | Human | Esophagus | ESCC | 3.94e-06 | 2.64e-01 | 0.0655 |
| 54916 | TMEM260 | P2T-E | Human | Esophagus | ESCC | 1.62e-12 | 2.35e-01 | 0.1177 |
| 54916 | TMEM260 | P4T-E | Human | Esophagus | ESCC | 3.77e-18 | 3.57e-01 | 0.1323 |
| 54916 | TMEM260 | P5T-E | Human | Esophagus | ESCC | 3.52e-10 | 1.14e-01 | 0.1327 |
| 54916 | TMEM260 | P8T-E | Human | Esophagus | ESCC | 1.16e-17 | 2.66e-01 | 0.0889 |
| 54916 | TMEM260 | P9T-E | Human | Esophagus | ESCC | 2.27e-07 | 1.79e-01 | 0.1131 |
| 54916 | TMEM260 | P10T-E | Human | Esophagus | ESCC | 1.05e-26 | 5.14e-01 | 0.116 |
| 54916 | TMEM260 | P11T-E | Human | Esophagus | ESCC | 7.79e-09 | 3.14e-01 | 0.1426 |
| 54916 | TMEM260 | P12T-E | Human | Esophagus | ESCC | 3.58e-24 | 4.61e-01 | 0.1122 |
| 54916 | TMEM260 | P15T-E | Human | Esophagus | ESCC | 1.49e-32 | 6.78e-01 | 0.1149 |
| 54916 | TMEM260 | P16T-E | Human | Esophagus | ESCC | 2.29e-17 | 2.98e-01 | 0.1153 |
| 54916 | TMEM260 | P19T-E | Human | Esophagus | ESCC | 3.68e-03 | 2.47e-01 | 0.1662 |
| 54916 | TMEM260 | P20T-E | Human | Esophagus | ESCC | 5.50e-08 | 1.97e-01 | 0.1124 |
| 54916 | TMEM260 | P21T-E | Human | Esophagus | ESCC | 3.42e-12 | 2.23e-01 | 0.1617 |
| 54916 | TMEM260 | P22T-E | Human | Esophagus | ESCC | 7.21e-19 | 2.10e-01 | 0.1236 |
| 54916 | TMEM260 | P23T-E | Human | Esophagus | ESCC | 5.08e-20 | 4.38e-01 | 0.108 |
| Page: 1 2 3 |
| Tissue | Expression Dynamics | Abbreviation |
| Cervix | 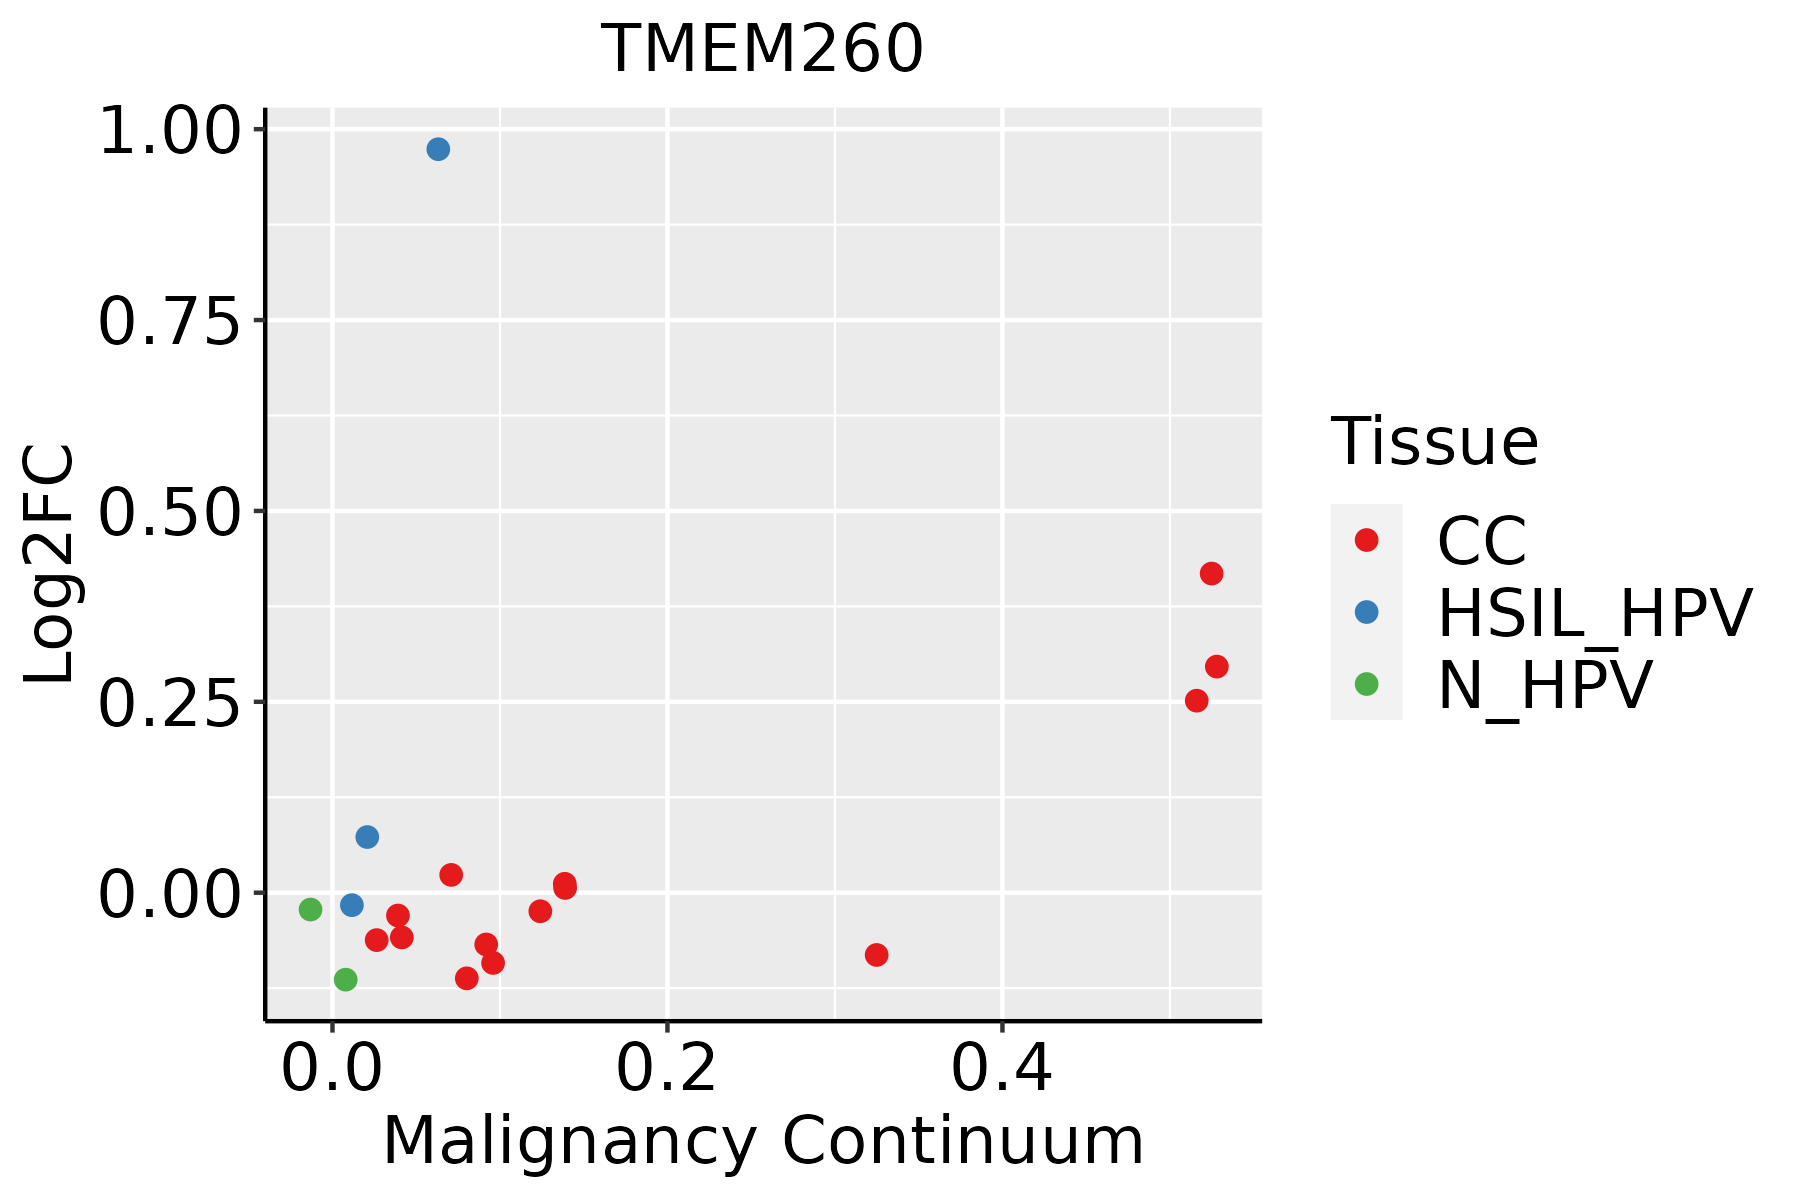 | CC: Cervix cancer |
| HSIL_HPV: HPV-infected high-grade squamous intraepithelial lesions | ||
| N_HPV: HPV-infected normal cervix | ||
| Esophagus | 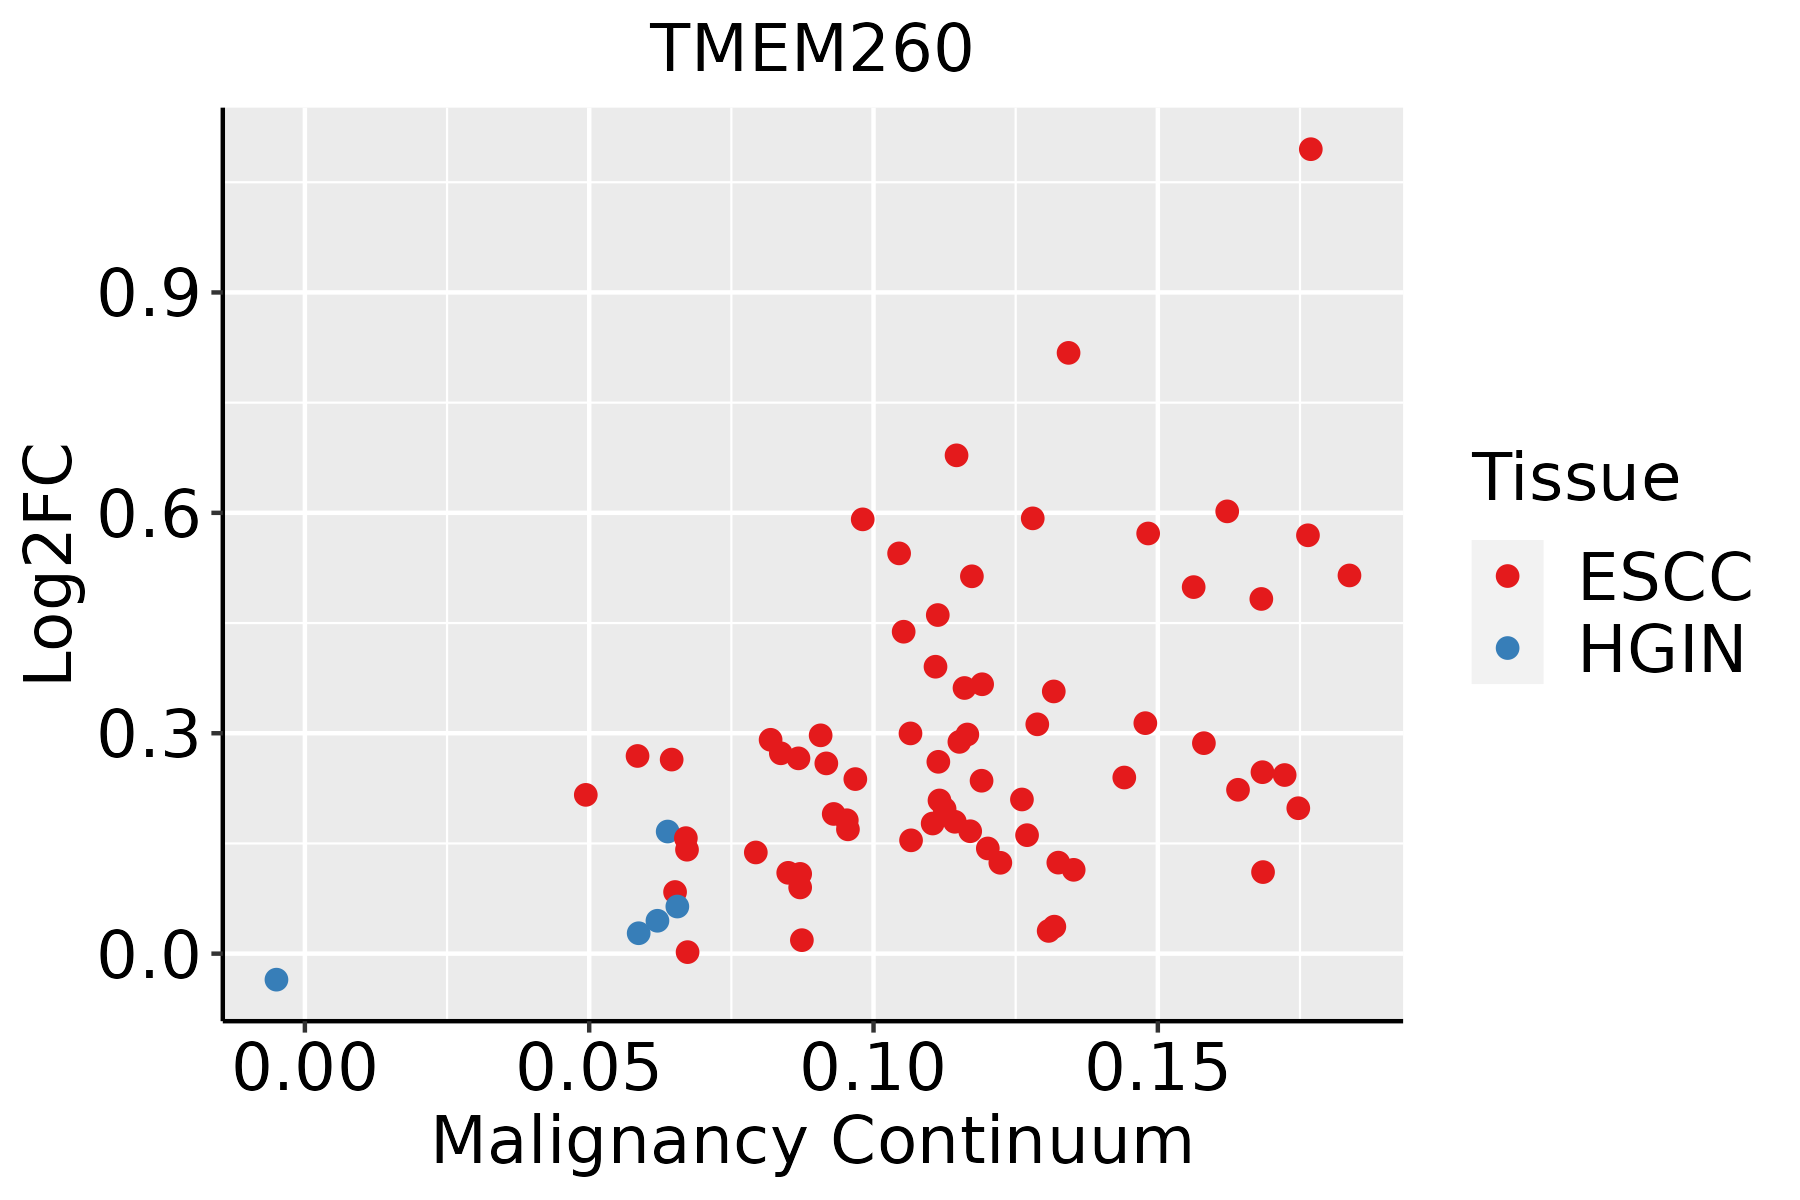 | ESCC: Esophageal squamous cell carcinoma |
| HGIN: High-grade intraepithelial neoplasias | ||
| LGIN: Low-grade intraepithelial neoplasias |
| ∗log2FC in expression of this searched gene in stem-like cells from each diseased tissue sample relative to stem-like cells in normal samples in each tissue plotted against the malignancy continuum. Samples are colored based on if they are from different disease stage. |
Top |
Malignant transformation related pathway analysis |
| Find out the enriched GO biological processes and KEGG pathways involved in transition from healthy to precancer to cancer |
| Tissue | Disease Stage | Enriched GO biological Processes |
| Colorectum | AD |  |
| Colorectum | SER |  |
| Colorectum | MSS |  |
| Colorectum | MSI-H |  |
| Colorectum | FAP |  |
| ∗Top 15 enriched GO BP terms are showed in the bar plot of each disease state in each tissue. Each row represents a significant GO biological process which is colored according to the -log10(p.adjust). |
| Page: 1 2 3 4 5 6 7 8 9 |
| GO ID | Tissue | Disease Stage | Description | Gene Ratio | Bg Ratio | pvalue | p.adjust | Count |
| Page: 1 |
| Pathway ID | Tissue | Disease Stage | Description | Gene Ratio | Bg Ratio | pvalue | p.adjust | qvalue | Count |
| Page: 1 |
Top |
Cell-cell communication analysis |
| Identification of potential cell-cell interactions between two cell types and their ligand-receptor pairs for different disease states |
| Ligand | Receptor | LRpair | Pathway | Tissue | Disease Stage |
| Page: 1 |
Top |
Single-cell gene regulatory network inference analysis |
| Find out the significant the regulons (TFs) and the target genes of each regulon across cell types for different disease states |
| TF | Cell Type | Tissue | Disease Stage | Target Gene | RSS | Regulon Activity |
| ∗The dot plots of a searched regulon are shown for all cell subpopulations in each disease state of each tissue based on the regulon specific score inferred using pySCENIC and by calculating the average expression. |
| Page: 1 |
Top |
Somatic mutation of malignant transformation related genes |
| Annotation of somatic variants for genes involved in malignant transformation |
| Hugo Symbol | Variant Class | Variant Classification | dbSNP RS | HGVSc | HGVSp | HGVSp Short | SWISSPROT | BIOTYPE | SIFT | PolyPhen | Tumor Sample Barcode | Tissue | Histology | Sex | Age | Stage | Therapy Types | Drugs | Outcome |
| TMEM260 | SNV | Missense_Mutation | novel | c.951N>T | p.Gln317His | p.Q317H | Q9NX78 | protein_coding | tolerated(0.12) | benign(0.125) | TCGA-AN-A046-01 | Breast | breast invasive carcinoma | Female | >=65 | I/II | Unknown | Unknown | SD |
| TMEM260 | SNV | Missense_Mutation | c.165A>T | p.Glu55Asp | p.E55D | Q9NX78 | protein_coding | deleterious(0.01) | probably_damaging(0.998) | TCGA-AO-A0JG-01 | Breast | breast invasive carcinoma | Female | <65 | III/IV | Chemotherapy | doxorubicin | SD | |
| TMEM260 | SNV | Missense_Mutation | rs201148915 | c.1097T>G | p.Val366Gly | p.V366G | Q9NX78 | protein_coding | deleterious(0) | possibly_damaging(0.626) | TCGA-BH-A0HO-01 | Breast | breast invasive carcinoma | Female | <65 | I/II | Chemotherapy | cyclophosphamide | SD |
| TMEM260 | SNV | Missense_Mutation | novel | c.1729N>C | p.Asp577His | p.D577H | Q9NX78 | protein_coding | tolerated(0.31) | benign(0) | TCGA-LD-A74U-01 | Breast | breast invasive carcinoma | Female | >=65 | III/IV | Chemotherapy | taxotere | SD |
| TMEM260 | SNV | Missense_Mutation | c.1307N>C | p.Ile436Thr | p.I436T | Q9NX78 | protein_coding | deleterious(0) | benign(0.177) | TCGA-EK-A2R7-01 | Cervix | cervical & endocervical cancer | Female | <65 | I/II | Unknown | Unknown | SD | |
| TMEM260 | SNV | Missense_Mutation | novel | c.690N>T | p.Leu230Phe | p.L230F | Q9NX78 | protein_coding | tolerated(0.34) | benign(0.001) | TCGA-ZJ-AAX8-01 | Cervix | cervical & endocervical cancer | Female | <65 | III/IV | Unknown | Unknown | SD |
| TMEM260 | SNV | Missense_Mutation | rs747716407 | c.280G>A | p.Val94Ile | p.V94I | Q9NX78 | protein_coding | tolerated(0.15) | benign(0.346) | TCGA-AA-3833-01 | Colorectum | colon adenocarcinoma | Female | <65 | I/II | Unknown | Unknown | SD |
| TMEM260 | SNV | Missense_Mutation | novel | c.1106N>A | p.Gly369Asp | p.G369D | Q9NX78 | protein_coding | deleterious(0) | probably_damaging(0.999) | TCGA-AA-3949-01 | Colorectum | colon adenocarcinoma | Female | >=65 | III/IV | Unknown | Unknown | SD |
| TMEM260 | SNV | Missense_Mutation | novel | c.154N>A | p.Asp52Asn | p.D52N | Q9NX78 | protein_coding | deleterious(0.05) | possibly_damaging(0.836) | TCGA-AA-3984-01 | Colorectum | colon adenocarcinoma | Female | <65 | I/II | Unknown | Unknown | SD |
| TMEM260 | SNV | Missense_Mutation | rs747674520 | c.883N>A | p.Glu295Lys | p.E295K | Q9NX78 | protein_coding | tolerated(0.11) | benign(0.026) | TCGA-AA-A00N-01 | Colorectum | colon adenocarcinoma | Male | >=65 | I/II | Unknown | Unknown | PD |
| Page: 1 2 3 4 5 6 7 8 |
Top |
Related drugs of malignant transformation related genes |
| Identification of chemicals and drugs interact with genes involved in malignant transfromation |
| (DGIdb 4.0) |
| Entrez ID | Symbol | Category | Interaction Types | Drug Claim Name | Drug Name | PMIDs |
| Page: 1 |

Copyright 2023-Present -The University of Texas Health Science Center at Houston |