
|
|||||
|
 | |
| |
| |
| |
| |
| |
|
Gene: TMEM258 |
Gene summary for TMEM258 |
| Gene information | Species | Human | Gene symbol | TMEM258 | Gene ID | 746 |
| Gene name | transmembrane protein 258 | |
| Gene Alias | C11orf10 | |
| Cytomap | 11q12.2 | |
| Gene Type | protein-coding | GO ID | GO:0006464 | UniProtAcc | P61165 |
Top |
Malignant transformation analysis |
| Identification of the aberrant gene expression in precancerous and cancerous lesions by comparing the gene expression of stem-like cells in diseased tissues with normal stem cells |
| Entrez ID | Symbol | Replicates | Species | Organ | Tissue | Adj P-value | Log2FC | Malignancy |
| 746 | TMEM258 | CA_HPV_1 | Human | Cervix | CC | 1.55e-08 | -1.38e-01 | 0.0264 |
| 746 | TMEM258 | CA_HPV_3 | Human | Cervix | CC | 5.41e-09 | -2.74e-01 | 0.0414 |
| 746 | TMEM258 | N_HPV_1 | Human | Cervix | N_HPV | 6.62e-03 | -8.58e-03 | 0.0079 |
| 746 | TMEM258 | CCI_1 | Human | Cervix | CC | 6.68e-19 | -9.81e-01 | 0.528 |
| 746 | TMEM258 | CCI_2 | Human | Cervix | CC | 6.21e-15 | -9.36e-01 | 0.5249 |
| 746 | TMEM258 | CCI_3 | Human | Cervix | CC | 2.57e-22 | -9.54e-01 | 0.516 |
| 746 | TMEM258 | CCII_1 | Human | Cervix | CC | 1.29e-32 | -9.78e-01 | 0.3249 |
| 746 | TMEM258 | sample1 | Human | Cervix | CC | 2.17e-04 | 3.20e-01 | 0.0959 |
| 746 | TMEM258 | sample3 | Human | Cervix | CC | 7.42e-03 | 7.10e-02 | 0.1387 |
| 746 | TMEM258 | L1 | Human | Cervix | CC | 6.54e-07 | -3.13e-01 | 0.0802 |
| 746 | TMEM258 | T3 | Human | Cervix | CC | 5.34e-04 | 2.65e-02 | 0.1389 |
| 746 | TMEM258 | HTA11_3410_2000001011 | Human | Colorectum | AD | 3.52e-36 | 7.92e-01 | 0.0155 |
| 746 | TMEM258 | HTA11_2487_2000001011 | Human | Colorectum | SER | 6.78e-34 | 1.14e+00 | -0.1808 |
| 746 | TMEM258 | HTA11_2951_2000001011 | Human | Colorectum | AD | 4.91e-08 | 6.83e-01 | 0.0216 |
| 746 | TMEM258 | HTA11_1938_2000001011 | Human | Colorectum | AD | 8.44e-43 | 1.34e+00 | -0.0811 |
| 746 | TMEM258 | HTA11_78_2000001011 | Human | Colorectum | AD | 5.28e-10 | 4.77e-01 | -0.1088 |
| 746 | TMEM258 | HTA11_347_2000001011 | Human | Colorectum | AD | 1.96e-56 | 1.06e+00 | -0.1954 |
| 746 | TMEM258 | HTA11_411_2000001011 | Human | Colorectum | SER | 3.95e-20 | 1.70e+00 | -0.2602 |
| 746 | TMEM258 | HTA11_2112_2000001011 | Human | Colorectum | SER | 1.27e-12 | 1.24e+00 | -0.2196 |
| 746 | TMEM258 | HTA11_3361_2000001011 | Human | Colorectum | AD | 2.27e-22 | 1.04e+00 | -0.1207 |
| Page: 1 2 3 4 5 6 7 8 9 10 11 12 13 14 15 |
| Tissue | Expression Dynamics | Abbreviation |
| Cervix | 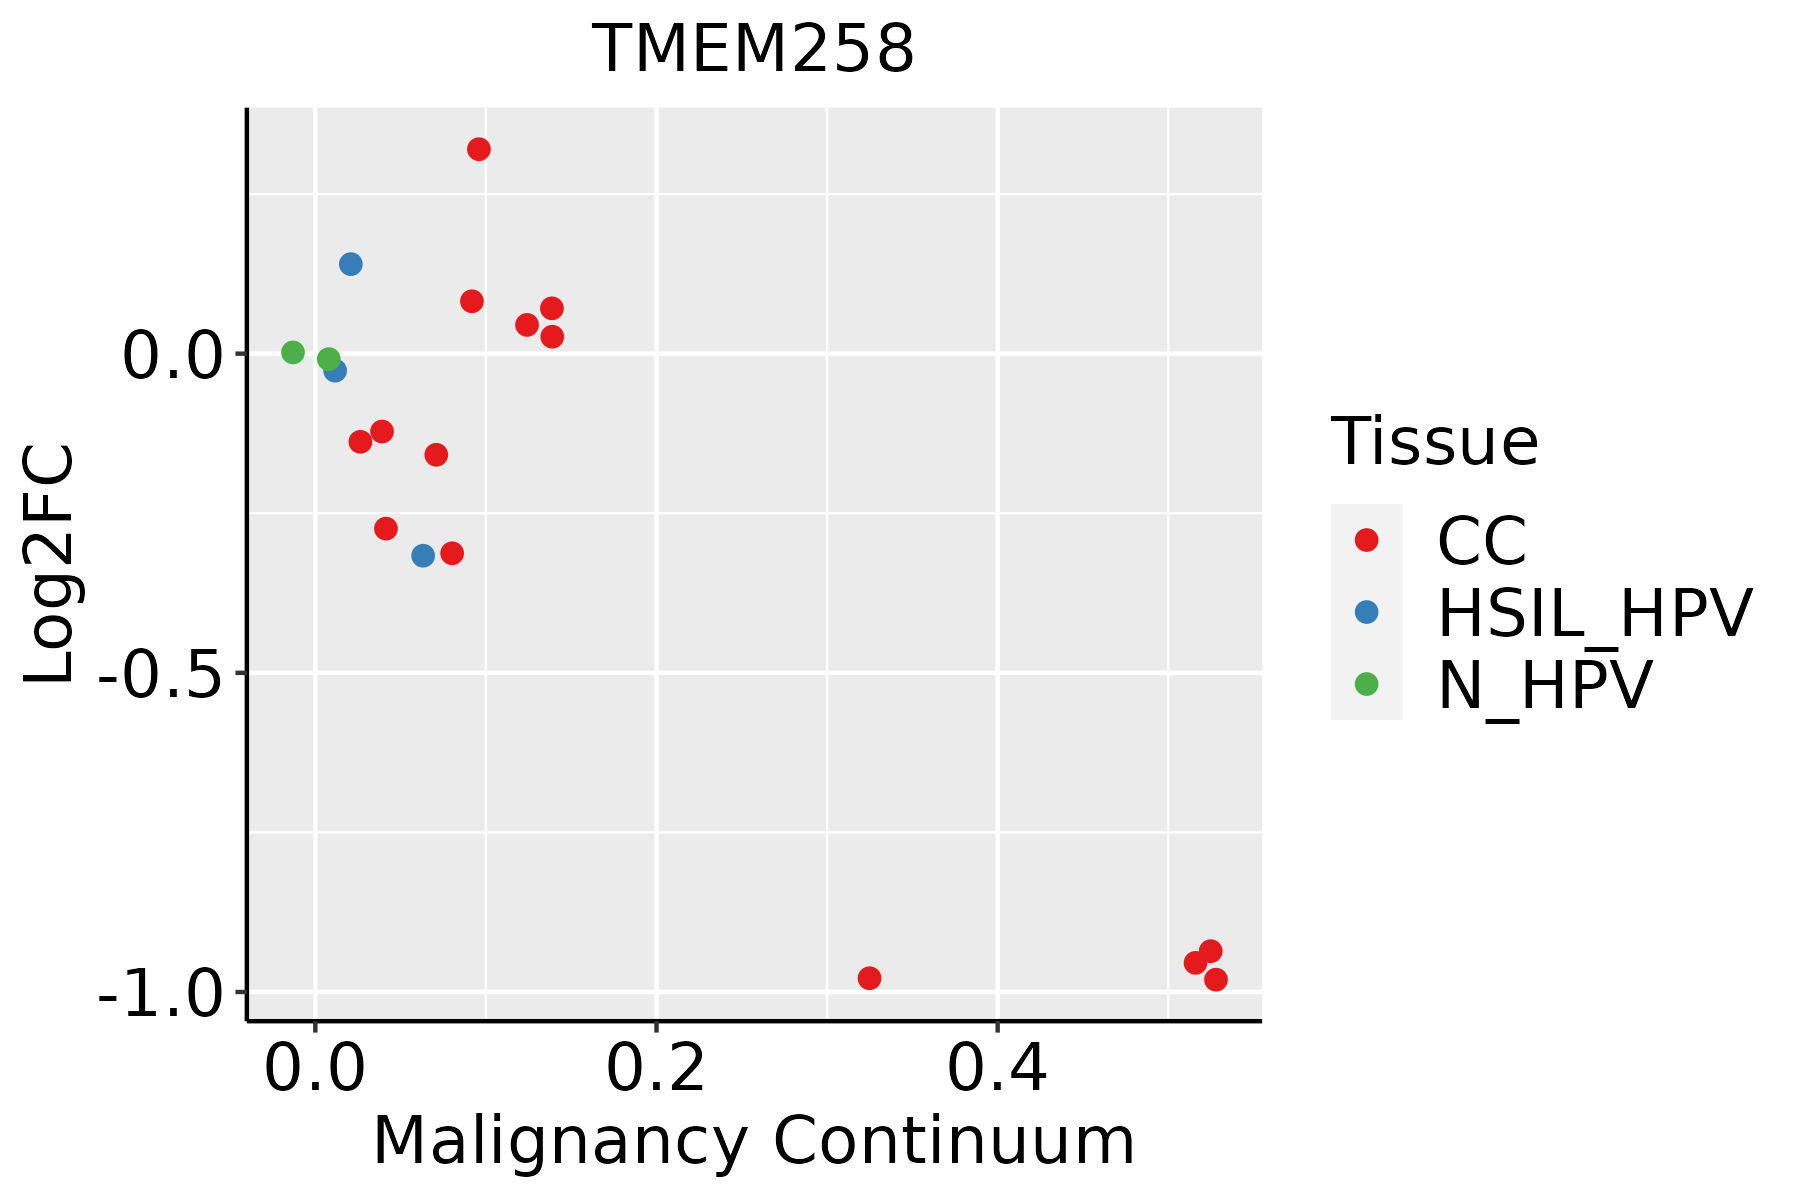 | CC: Cervix cancer |
| HSIL_HPV: HPV-infected high-grade squamous intraepithelial lesions | ||
| N_HPV: HPV-infected normal cervix | ||
| Colorectum (GSE201348) |  | FAP: Familial adenomatous polyposis |
| CRC: Colorectal cancer | ||
| Colorectum (HTA11) |  | AD: Adenomas |
| SER: Sessile serrated lesions | ||
| MSI-H: Microsatellite-high colorectal cancer | ||
| MSS: Microsatellite stable colorectal cancer | ||
| Endometrium | 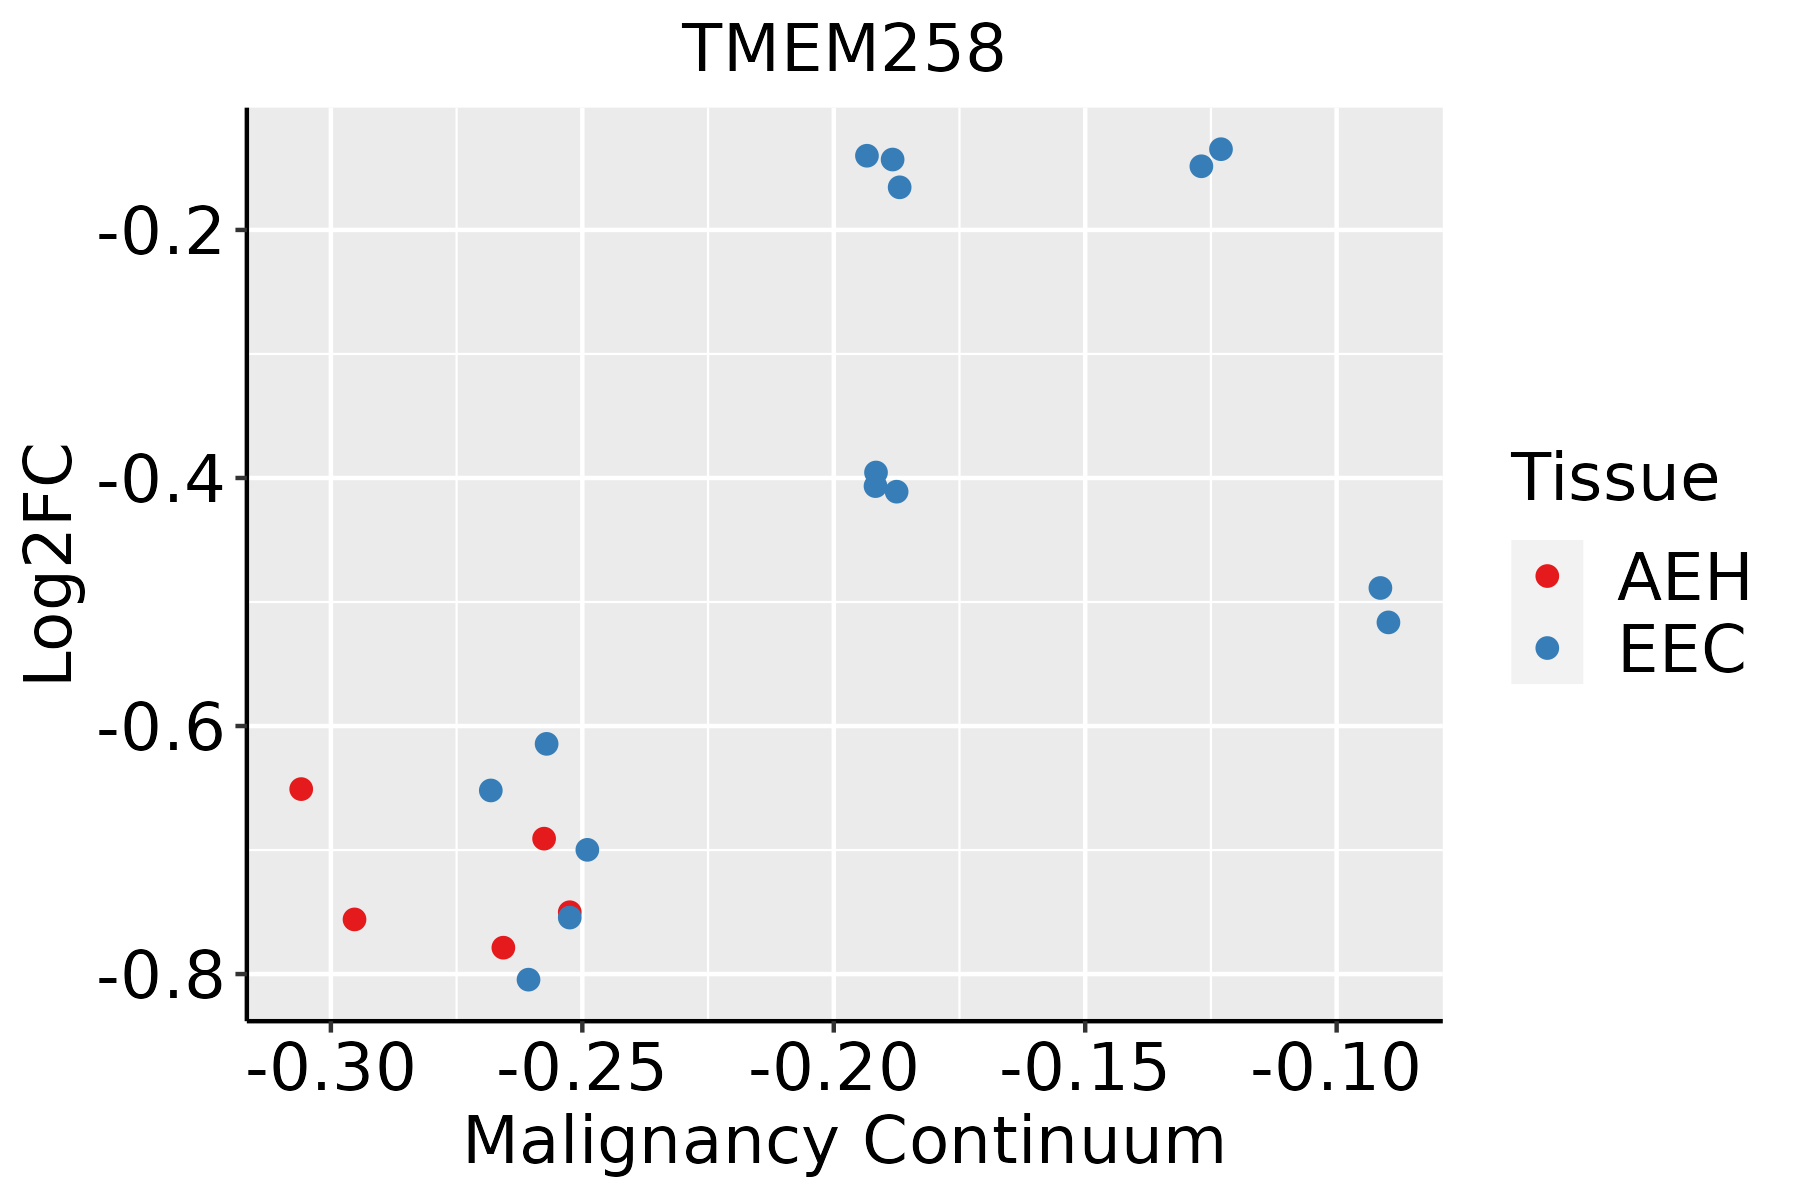 | AEH: Atypical endometrial hyperplasia |
| EEC: Endometrioid Cancer | ||
| Esophagus | 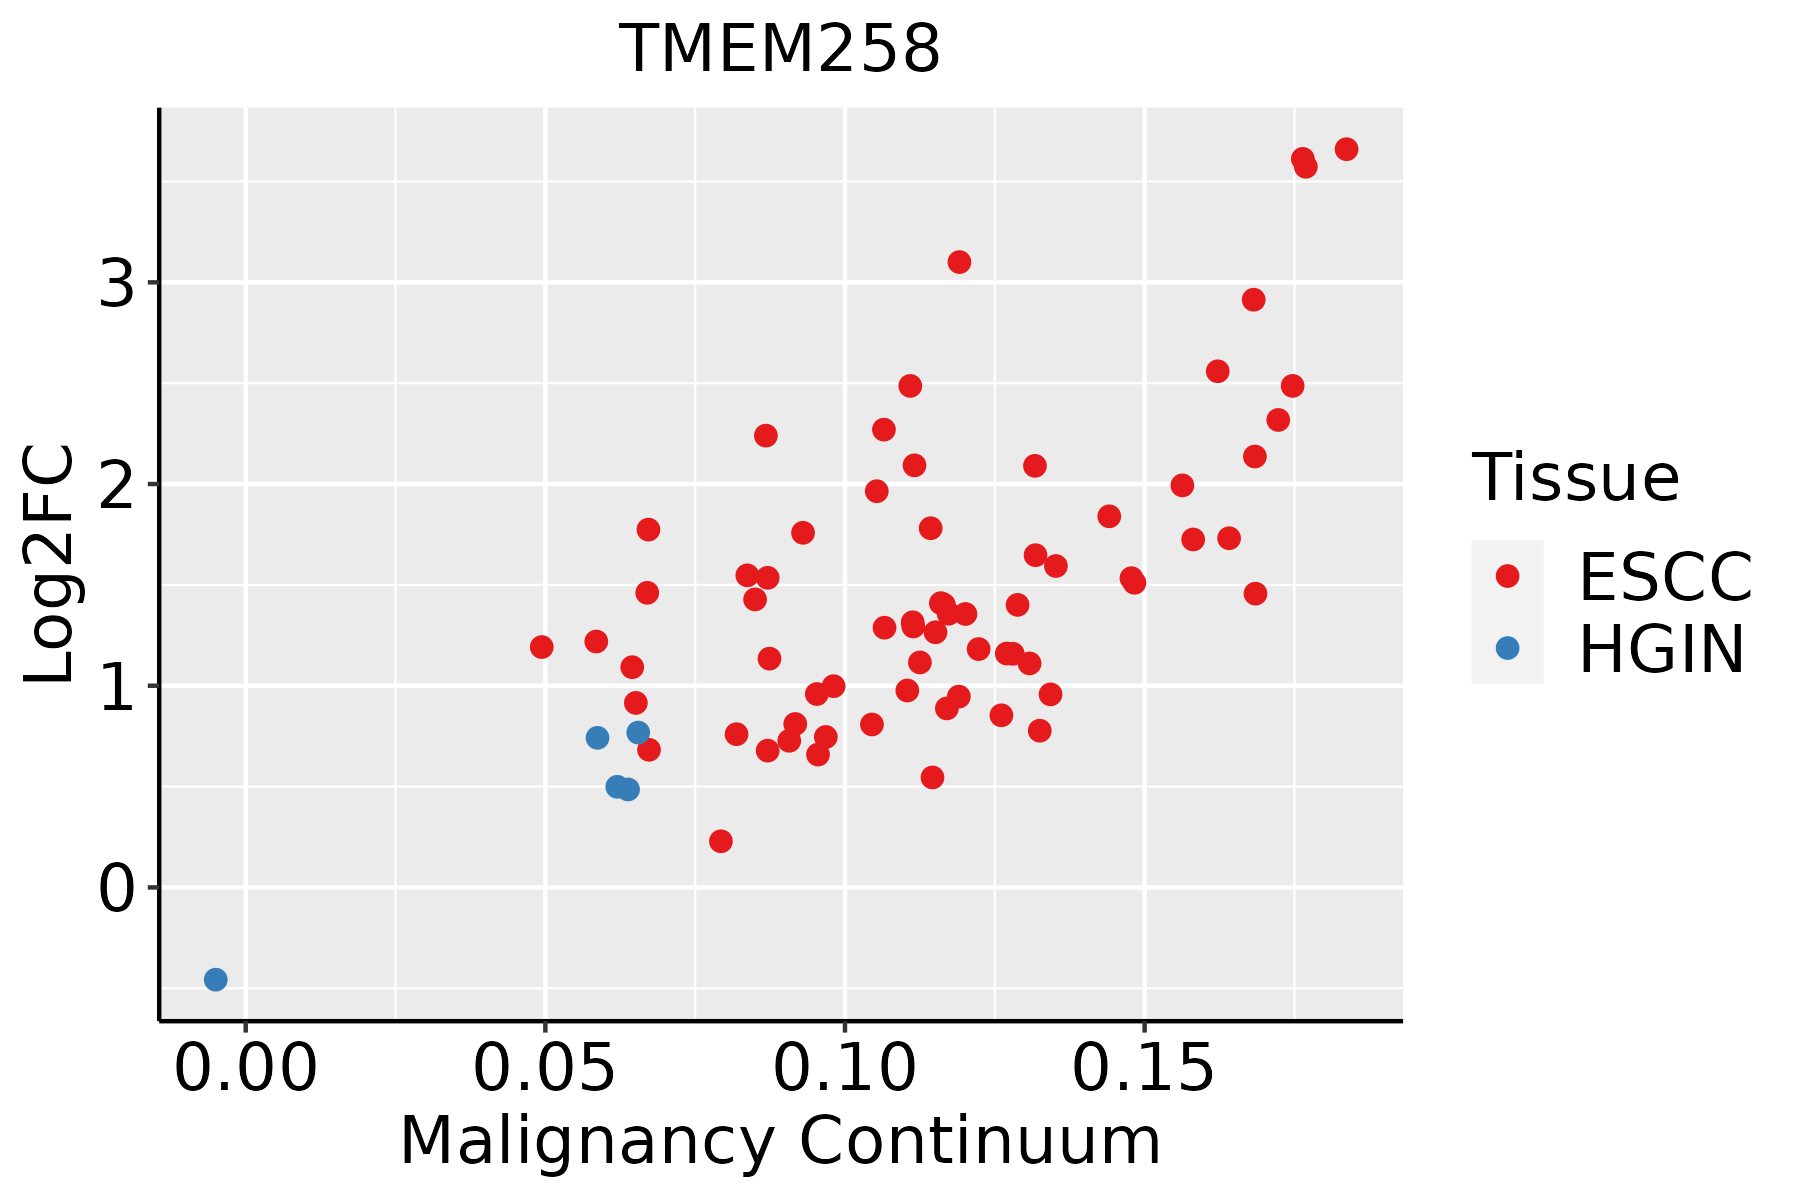 | ESCC: Esophageal squamous cell carcinoma |
| HGIN: High-grade intraepithelial neoplasias | ||
| LGIN: Low-grade intraepithelial neoplasias | ||
| GC | 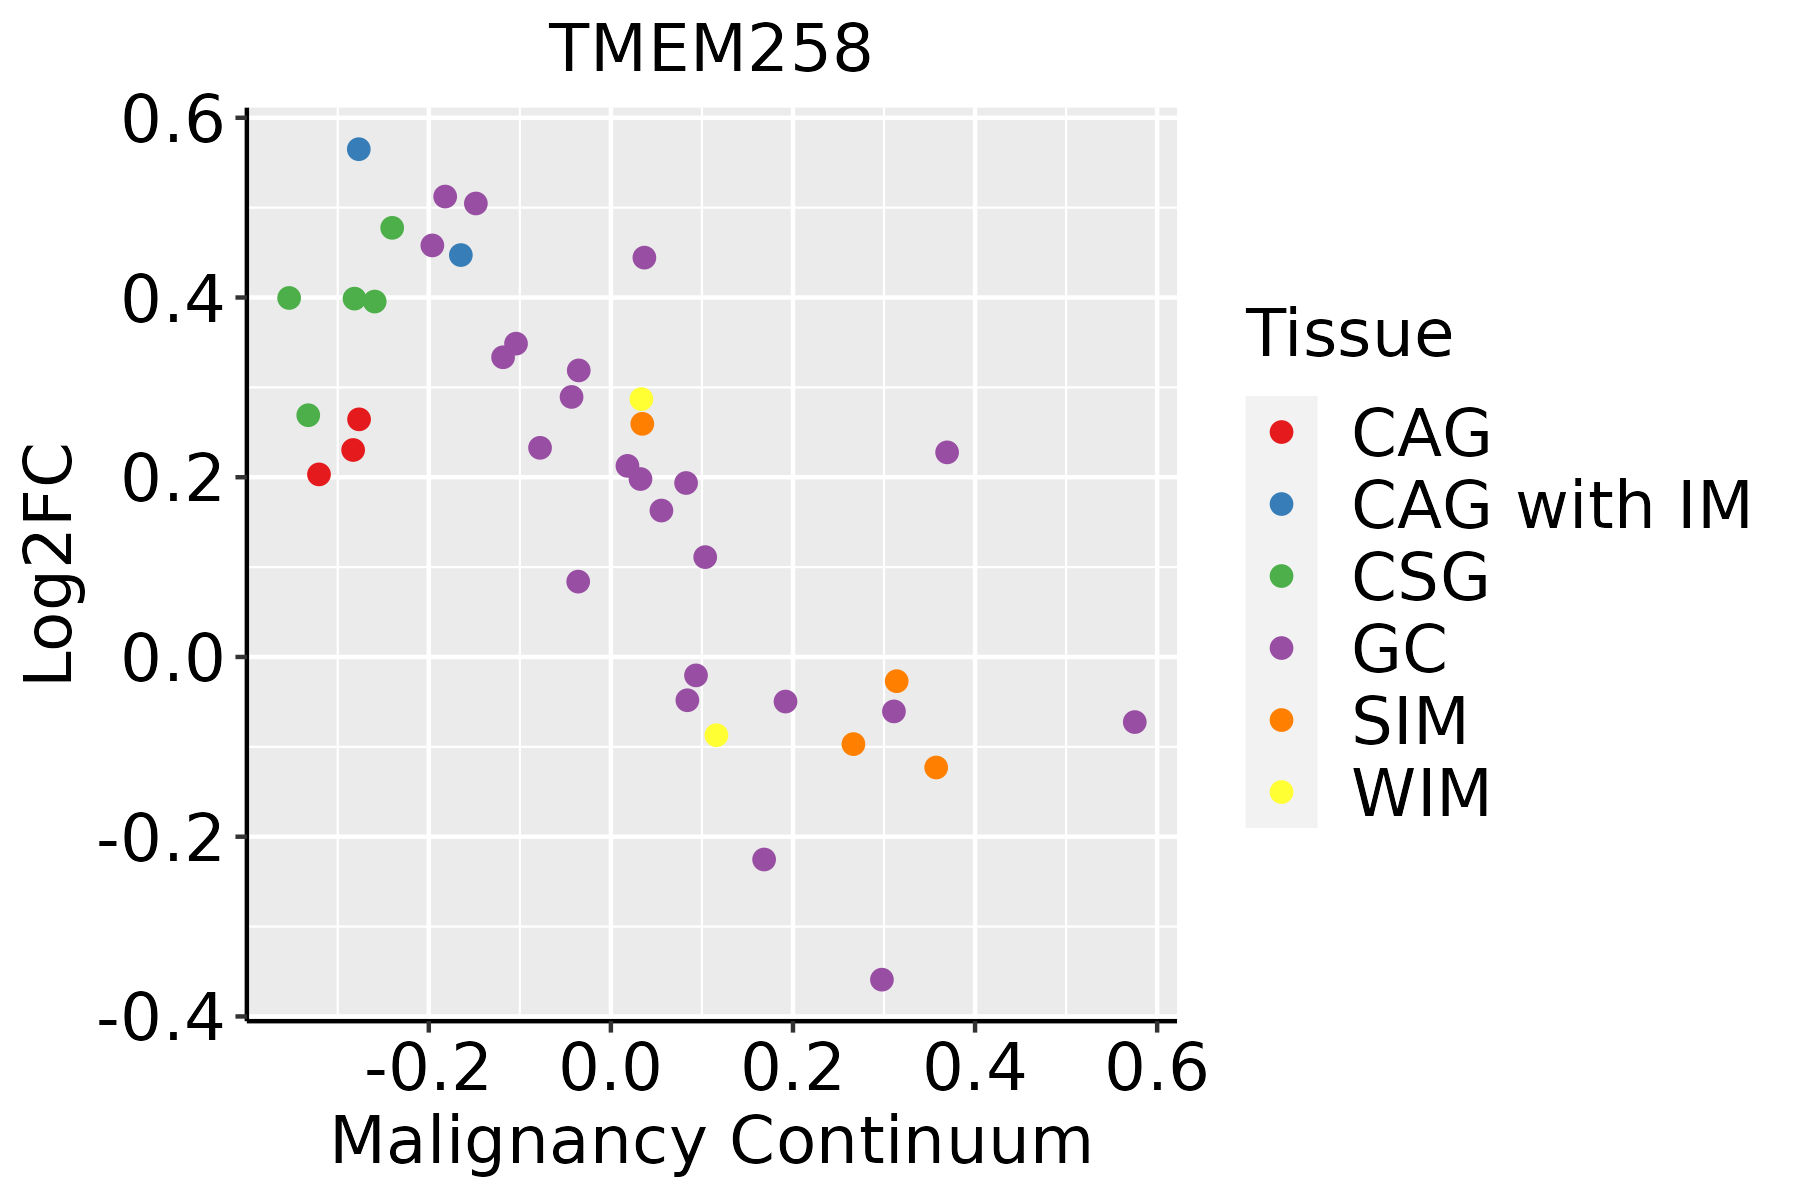 | CAG: Chronic atrophic gastritis |
| CAG with IM: Chronic atrophic gastritis with intestinal metaplasia | ||
| CSG: Chronic superficial gastritis | ||
| GC: Gastric cancer | ||
| SIM: Severe intestinal metaplasia | ||
| WIM: Wild intestinal metaplasia | ||
| Liver |  | HCC: Hepatocellular carcinoma |
| NAFLD: Non-alcoholic fatty liver disease | ||
| Lung | 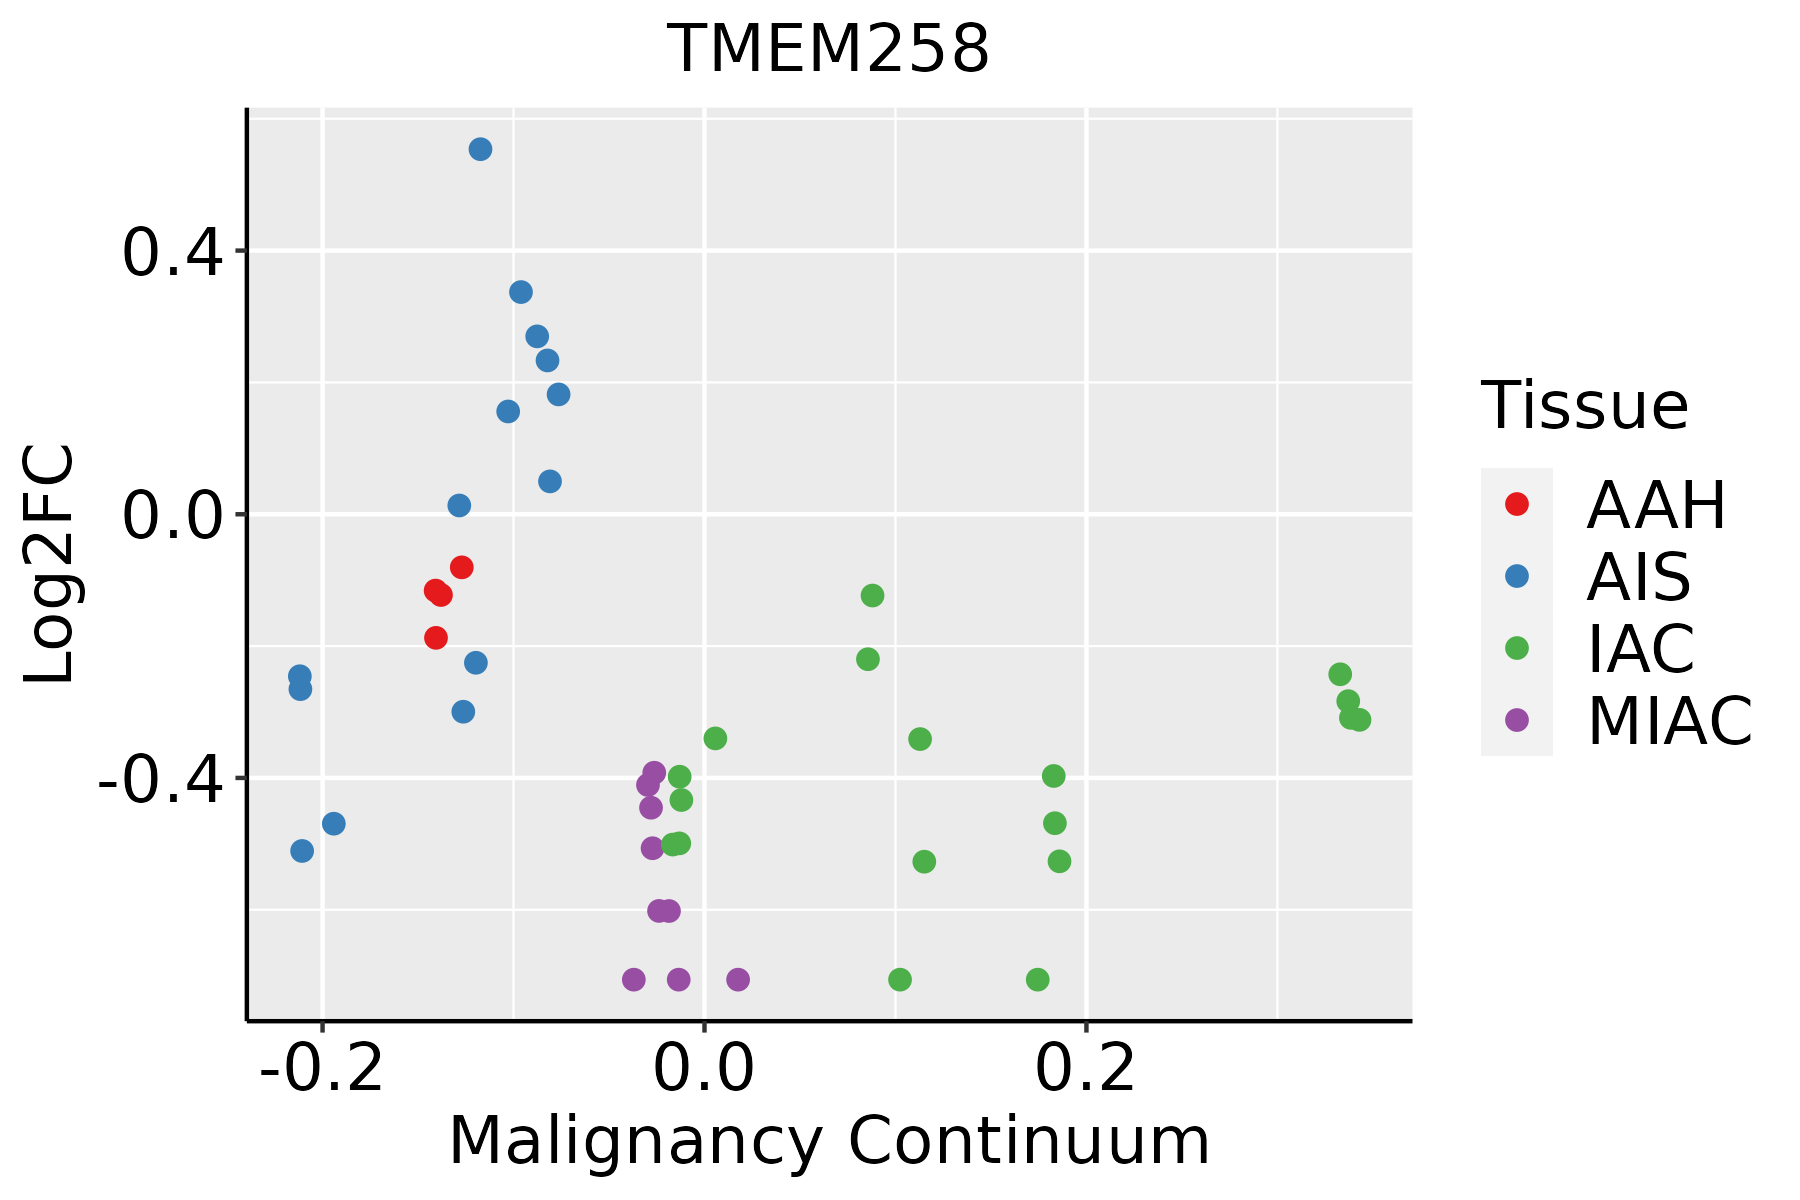 | AAH: Atypical adenomatous hyperplasia |
| AIS: Adenocarcinoma in situ | ||
| IAC: Invasive lung adenocarcinoma | ||
| MIA: Minimally invasive adenocarcinoma | ||
| Oral Cavity | 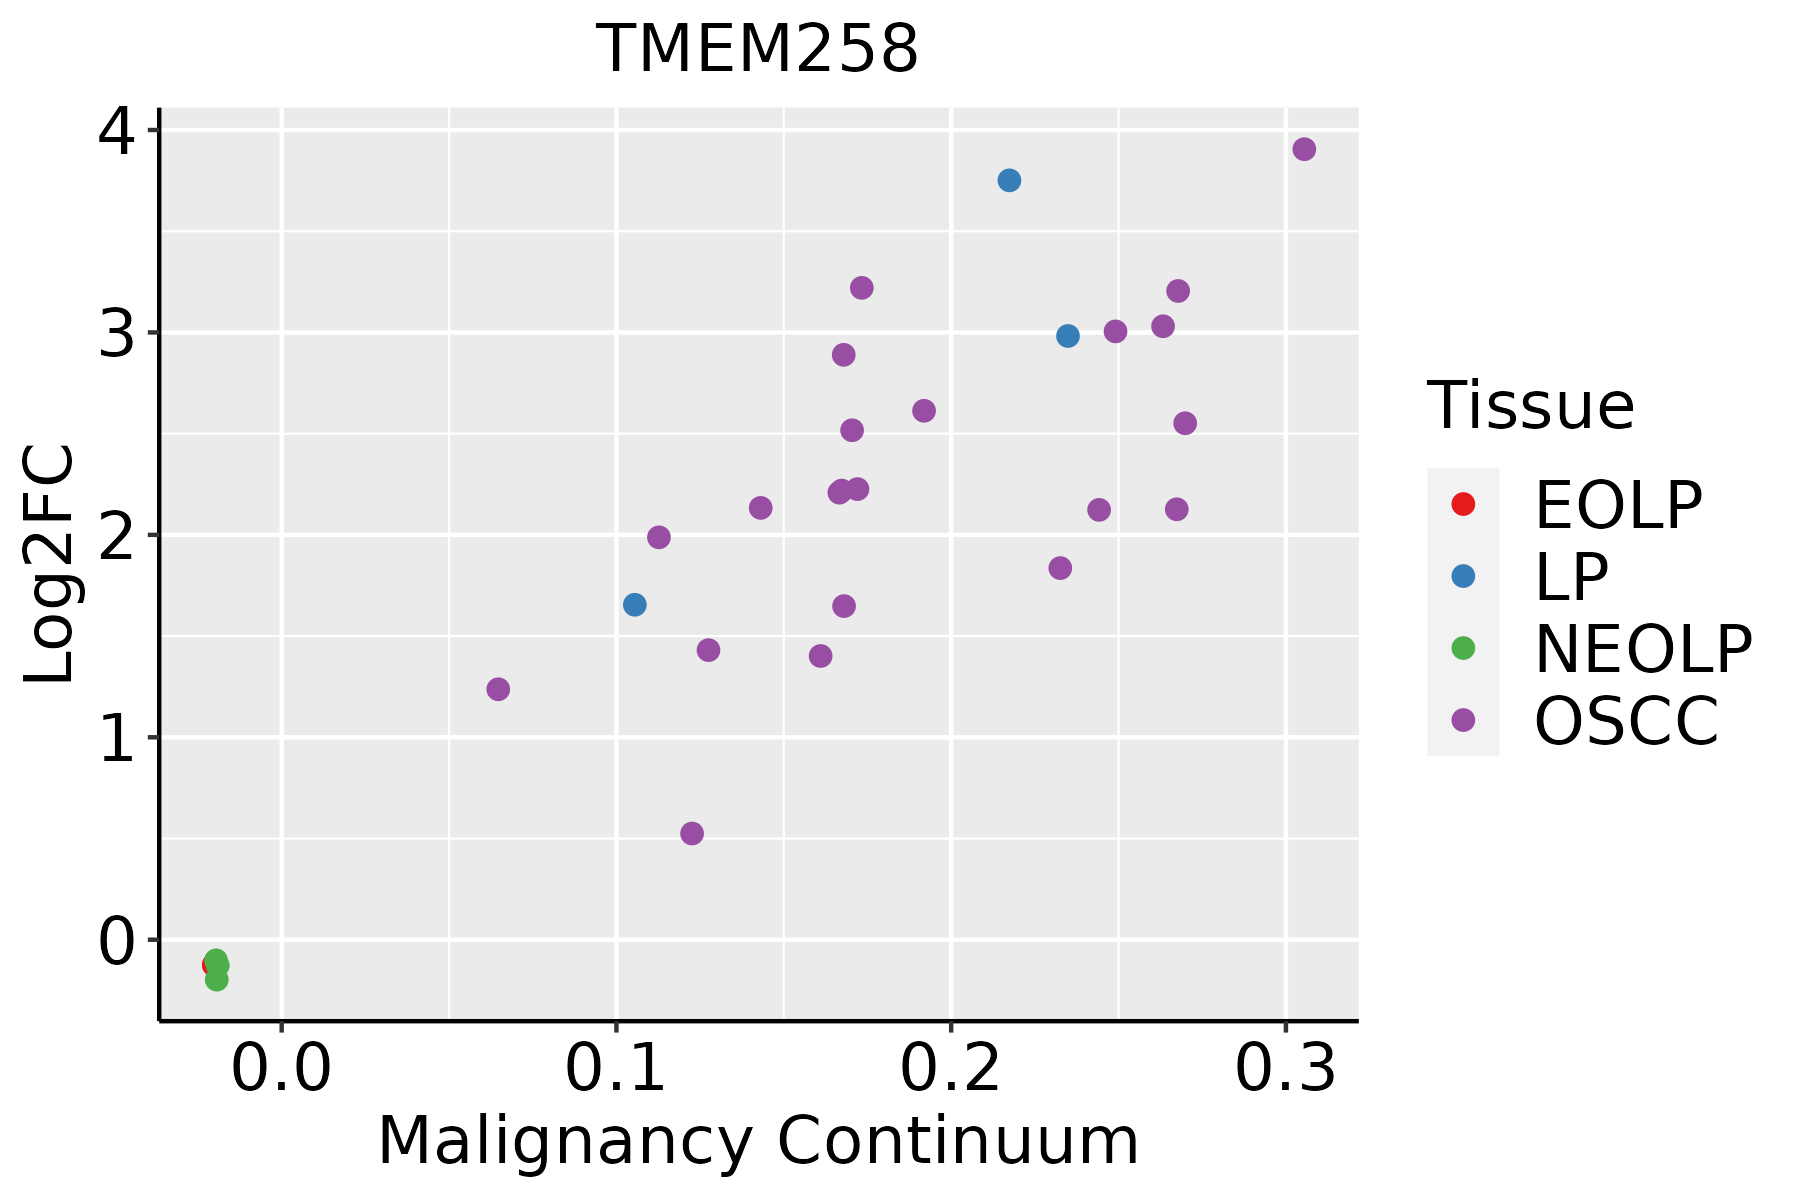 | EOLP: Erosive Oral lichen planus |
| LP: leukoplakia | ||
| NEOLP: Non-erosive oral lichen planus | ||
| OSCC: Oral squamous cell carcinoma | ||
| Prostate | 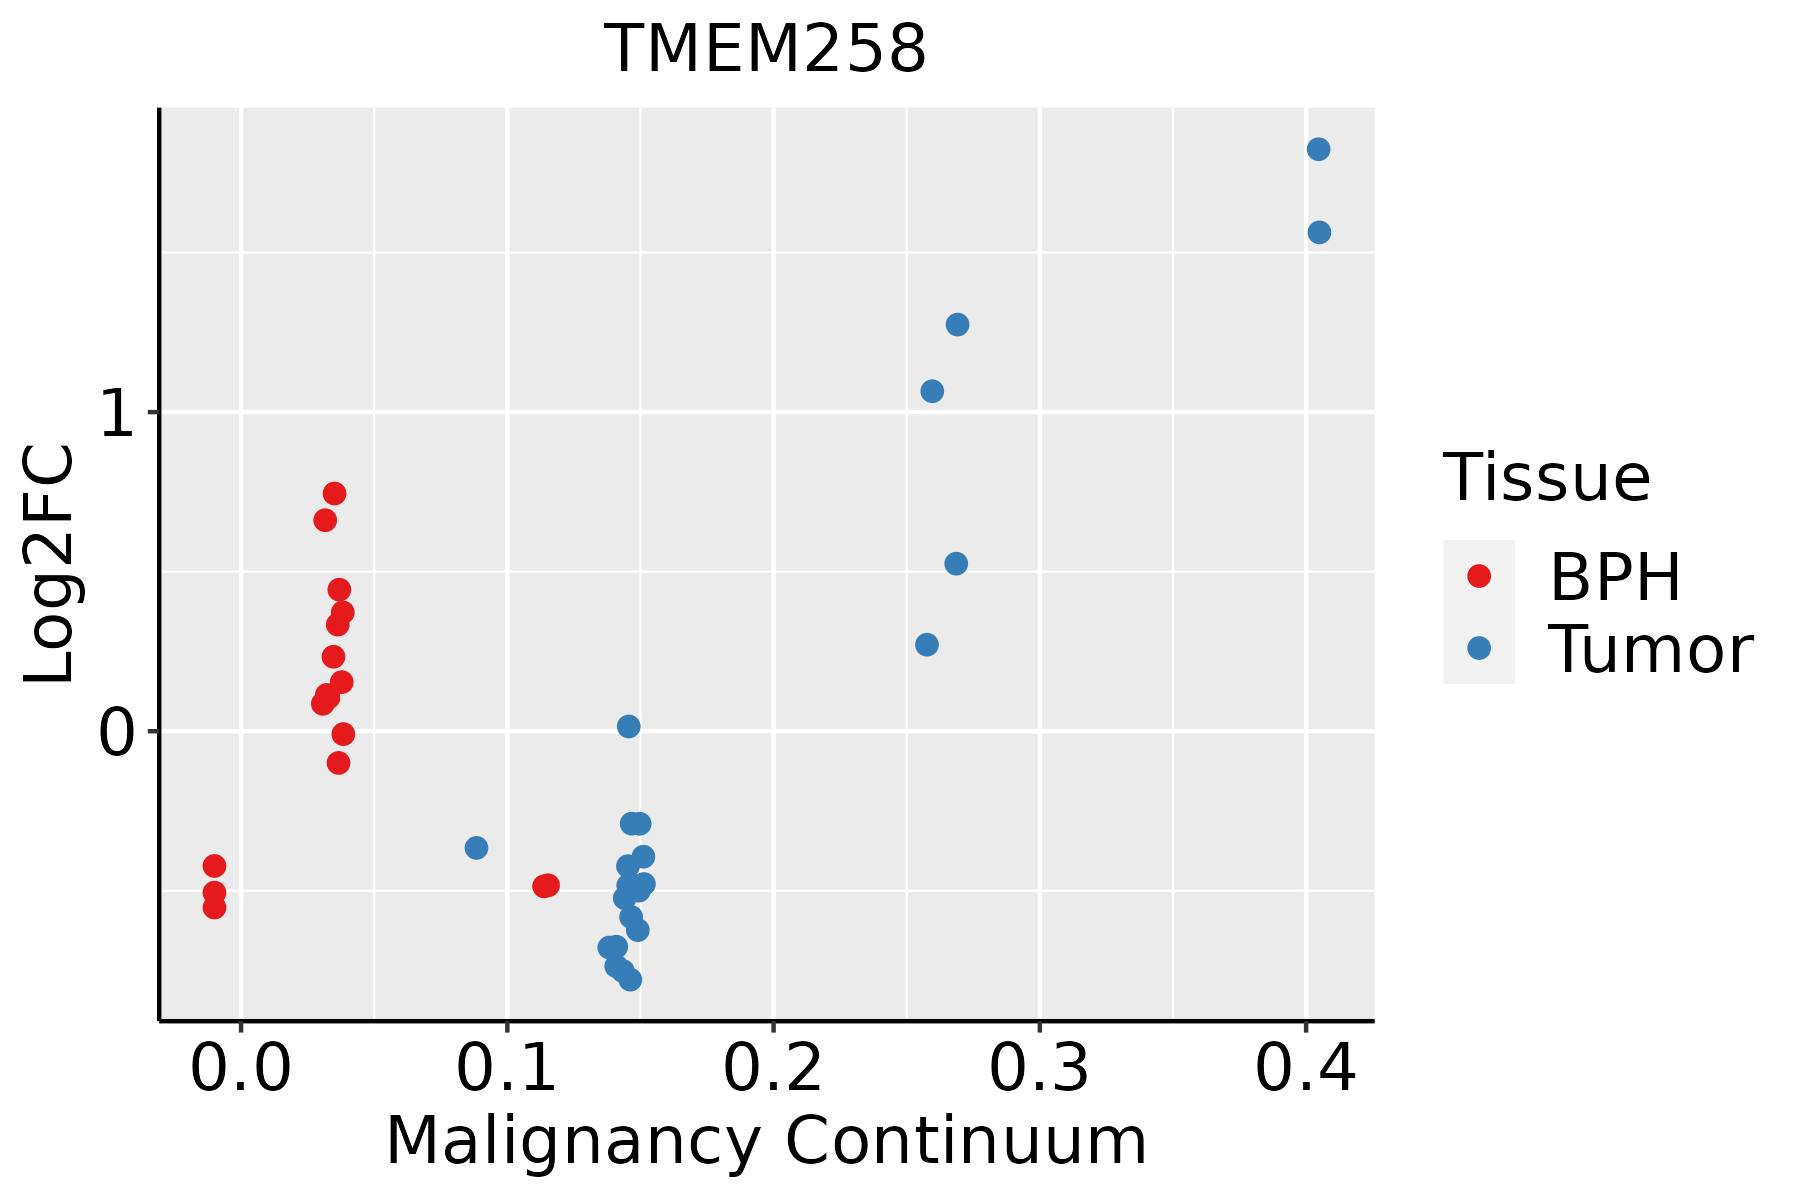 | BPH: Benign Prostatic Hyperplasia |
| Skin | 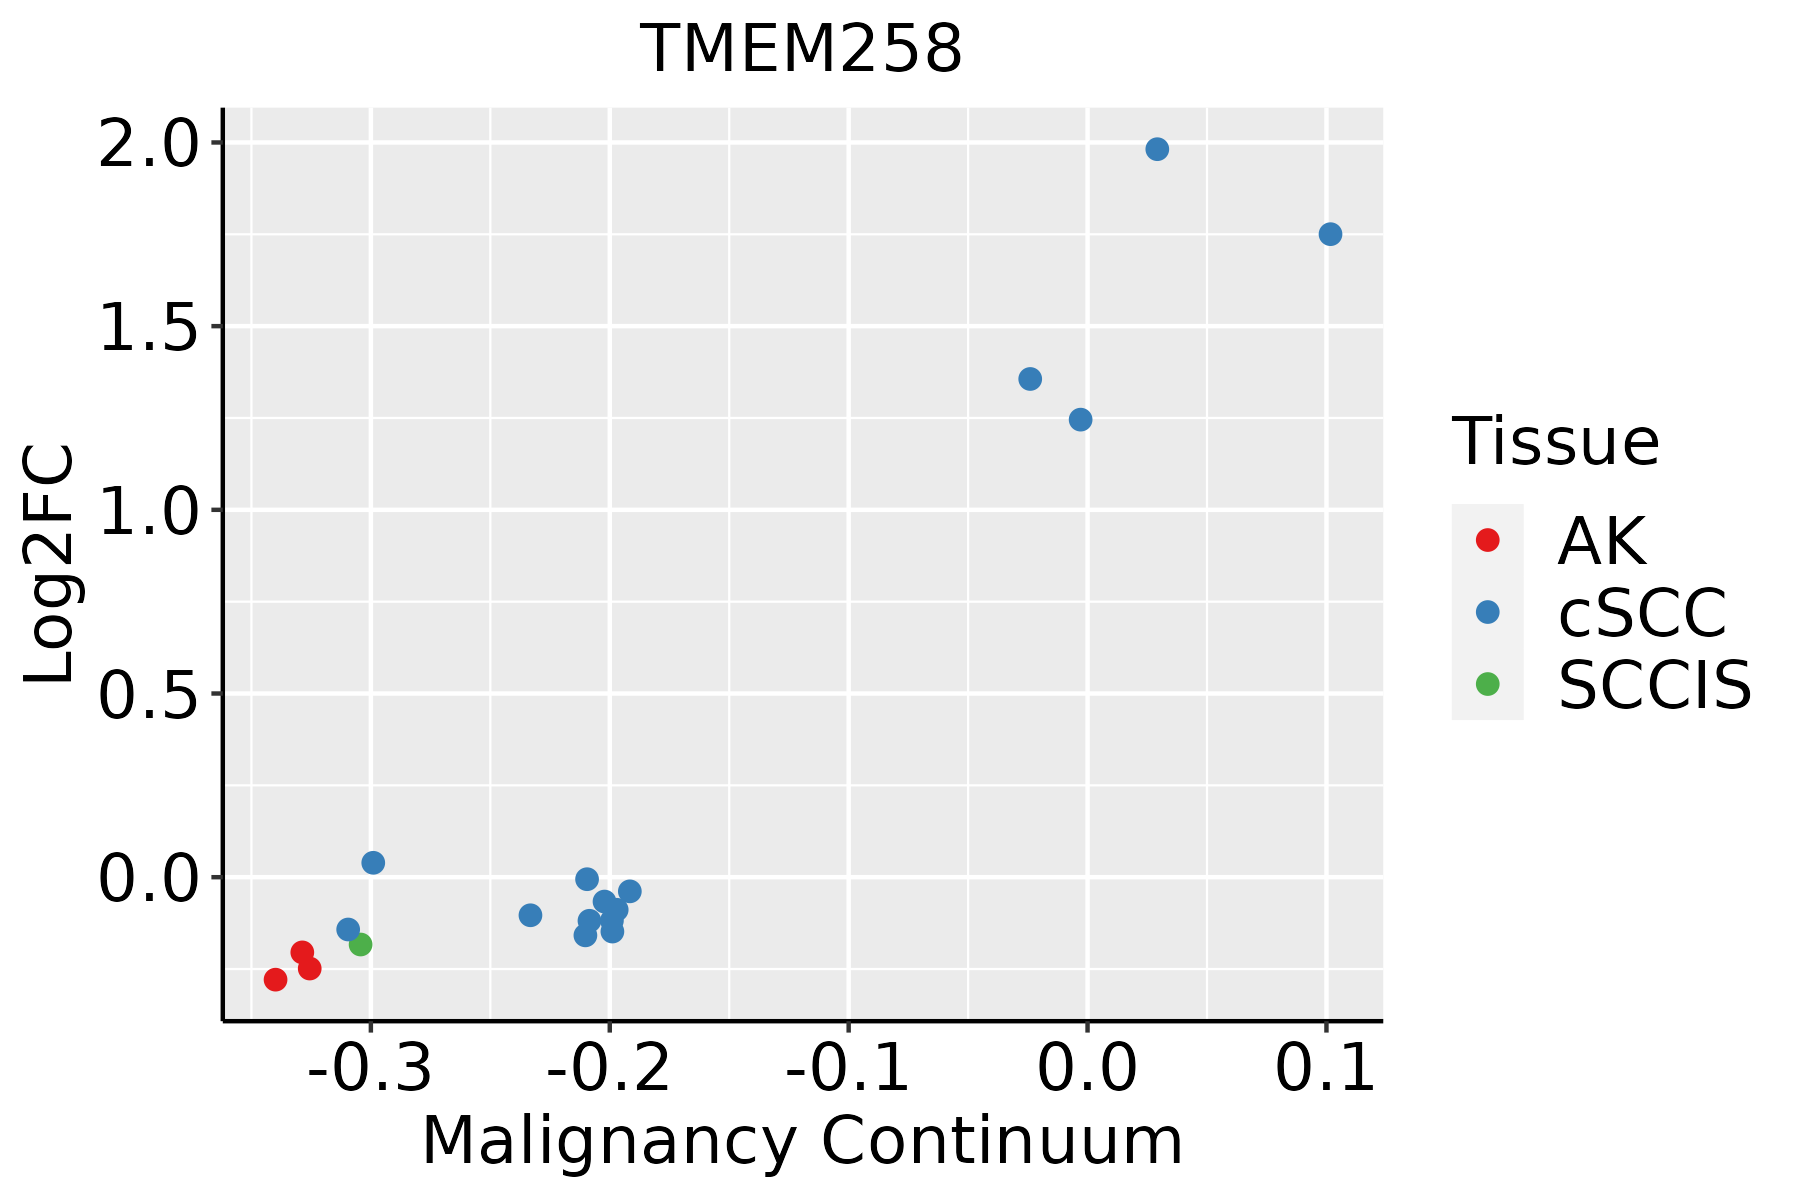 | AK: Actinic keratosis |
| cSCC: Cutaneous squamous cell carcinoma | ||
| SCCIS:squamous cell carcinoma in situ | ||
| Thyroid | 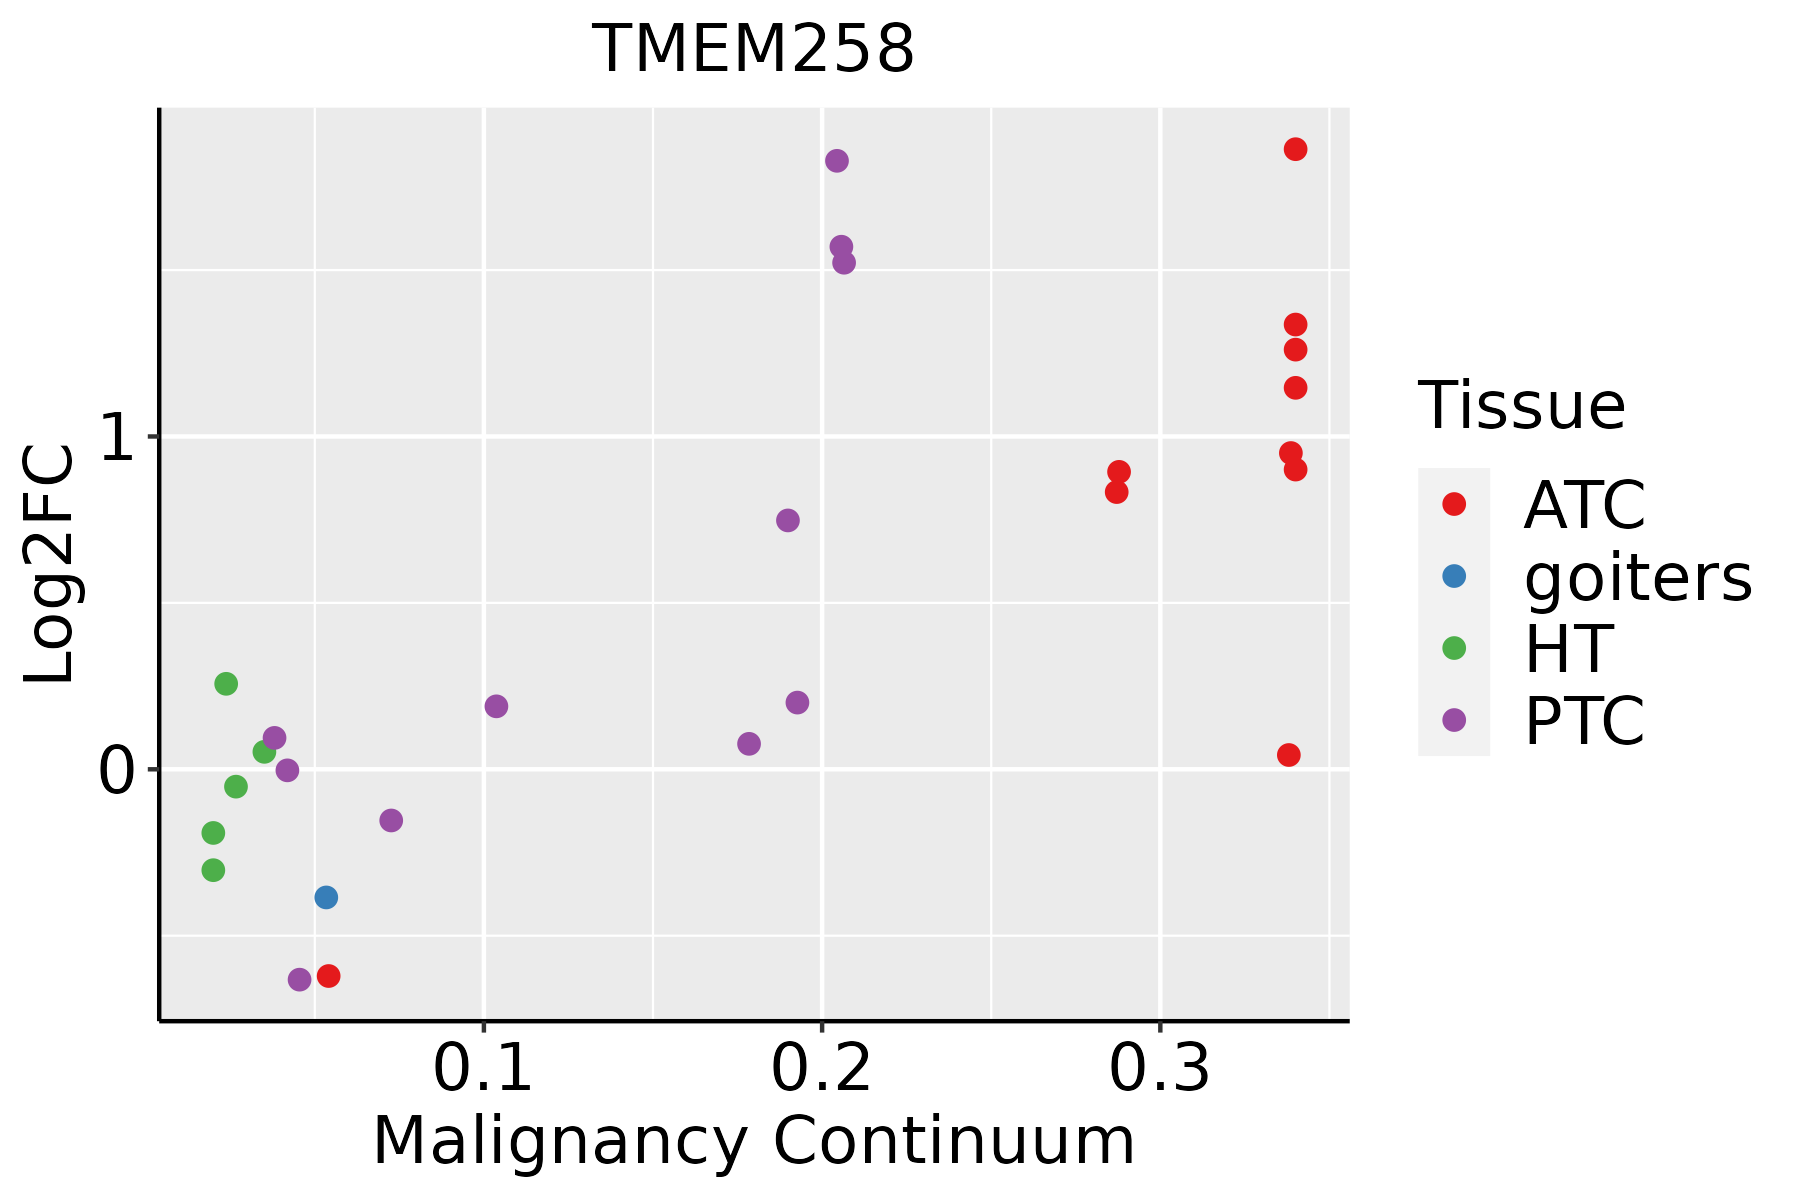 | ATC: Anaplastic thyroid cancer |
| HT: Hashimoto's thyroiditis | ||
| PTC: Papillary thyroid cancer |
| ∗log2FC in expression of this searched gene in stem-like cells from each diseased tissue sample relative to stem-like cells in normal samples in each tissue plotted against the malignancy continuum. Samples are colored based on if they are from different disease stage. |
Top |
Malignant transformation related pathway analysis |
| Find out the enriched GO biological processes and KEGG pathways involved in transition from healthy to precancer to cancer |
| Tissue | Disease Stage | Enriched GO biological Processes |
| Colorectum | AD |  |
| Colorectum | SER |  |
| Colorectum | MSS |  |
| Colorectum | MSI-H |  |
| Colorectum | FAP |  |
| ∗Top 15 enriched GO BP terms are showed in the bar plot of each disease state in each tissue. Each row represents a significant GO biological process which is colored according to the -log10(p.adjust). |
| Page: 1 2 3 4 5 6 7 8 9 |
| GO ID | Tissue | Disease Stage | Description | Gene Ratio | Bg Ratio | pvalue | p.adjust | Count |
| GO:0006487 | Colorectum | AD | protein N-linked glycosylation | 25/3918 | 65/18723 | 9.12e-04 | 8.71e-03 | 25 |
| GO:0006486 | Colorectum | AD | protein glycosylation | 64/3918 | 226/18723 | 4.86e-03 | 3.27e-02 | 64 |
| GO:0043413 | Colorectum | AD | macromolecule glycosylation | 64/3918 | 226/18723 | 4.86e-03 | 3.27e-02 | 64 |
| GO:0070085 | Colorectum | AD | glycosylation | 67/3918 | 240/18723 | 5.78e-03 | 3.67e-02 | 67 |
| GO:00064871 | Colorectum | MSS | protein N-linked glycosylation | 23/3467 | 65/18723 | 9.47e-04 | 9.54e-03 | 23 |
| GO:00064876 | Esophagus | HGIN | protein N-linked glycosylation | 17/2587 | 65/18723 | 6.04e-03 | 4.87e-02 | 17 |
| GO:000648714 | Esophagus | ESCC | protein N-linked glycosylation | 51/8552 | 65/18723 | 6.41e-08 | 1.13e-06 | 51 |
| GO:00091002 | Esophagus | ESCC | glycoprotein metabolic process | 226/8552 | 387/18723 | 2.64e-07 | 3.94e-06 | 226 |
| GO:00700854 | Esophagus | ESCC | glycosylation | 144/8552 | 240/18723 | 5.12e-06 | 5.38e-05 | 144 |
| GO:00064865 | Esophagus | ESCC | protein glycosylation | 135/8552 | 226/18723 | 1.36e-05 | 1.24e-04 | 135 |
| GO:00434135 | Esophagus | ESCC | macromolecule glycosylation | 135/8552 | 226/18723 | 1.36e-05 | 1.24e-04 | 135 |
| GO:00091012 | Esophagus | ESCC | glycoprotein biosynthetic process | 181/8552 | 317/18723 | 2.54e-05 | 2.15e-04 | 181 |
| GO:00064873 | Liver | Cirrhotic | protein N-linked glycosylation | 30/4634 | 65/18723 | 1.40e-04 | 1.36e-03 | 30 |
| GO:000648711 | Liver | HCC | protein N-linked glycosylation | 48/7958 | 65/18723 | 2.85e-07 | 5.00e-06 | 48 |
| GO:00064862 | Liver | HCC | protein glycosylation | 122/7958 | 226/18723 | 3.11e-04 | 2.21e-03 | 122 |
| GO:00434132 | Liver | HCC | macromolecule glycosylation | 122/7958 | 226/18723 | 3.11e-04 | 2.21e-03 | 122 |
| GO:00700852 | Liver | HCC | glycosylation | 128/7958 | 240/18723 | 4.35e-04 | 2.92e-03 | 128 |
| GO:0009100 | Liver | HCC | glycoprotein metabolic process | 193/7958 | 387/18723 | 1.89e-03 | 9.62e-03 | 193 |
| GO:00064863 | Lung | AIS | protein glycosylation | 35/1849 | 226/18723 | 4.93e-03 | 4.27e-02 | 35 |
| GO:00434133 | Lung | AIS | macromolecule glycosylation | 35/1849 | 226/18723 | 4.93e-03 | 4.27e-02 | 35 |
| Page: 1 2 3 |
| Pathway ID | Tissue | Disease Stage | Description | Gene Ratio | Bg Ratio | pvalue | p.adjust | qvalue | Count |
| hsa0414120 | Cervix | CC | Protein processing in endoplasmic reticulum | 55/1267 | 174/8465 | 1.74e-08 | 2.68e-07 | 1.58e-07 | 55 |
| hsa04141110 | Cervix | CC | Protein processing in endoplasmic reticulum | 55/1267 | 174/8465 | 1.74e-08 | 2.68e-07 | 1.58e-07 | 55 |
| hsa0414144 | Cervix | N_HPV | Protein processing in endoplasmic reticulum | 21/349 | 174/8465 | 8.84e-06 | 1.09e-04 | 8.55e-05 | 21 |
| hsa0414154 | Cervix | N_HPV | Protein processing in endoplasmic reticulum | 21/349 | 174/8465 | 8.84e-06 | 1.09e-04 | 8.55e-05 | 21 |
| hsa04141 | Colorectum | AD | Protein processing in endoplasmic reticulum | 80/2092 | 174/8465 | 5.96e-10 | 1.25e-08 | 7.96e-09 | 80 |
| hsa00510 | Colorectum | AD | N-Glycan biosynthesis | 21/2092 | 53/8465 | 1.15e-02 | 4.24e-02 | 2.71e-02 | 21 |
| hsa041411 | Colorectum | AD | Protein processing in endoplasmic reticulum | 80/2092 | 174/8465 | 5.96e-10 | 1.25e-08 | 7.96e-09 | 80 |
| hsa005101 | Colorectum | AD | N-Glycan biosynthesis | 21/2092 | 53/8465 | 1.15e-02 | 4.24e-02 | 2.71e-02 | 21 |
| hsa041412 | Colorectum | SER | Protein processing in endoplasmic reticulum | 60/1580 | 174/8465 | 4.20e-07 | 7.33e-06 | 5.32e-06 | 60 |
| hsa041413 | Colorectum | SER | Protein processing in endoplasmic reticulum | 60/1580 | 174/8465 | 4.20e-07 | 7.33e-06 | 5.32e-06 | 60 |
| hsa041414 | Colorectum | MSS | Protein processing in endoplasmic reticulum | 75/1875 | 174/8465 | 3.78e-10 | 8.44e-09 | 5.17e-09 | 75 |
| hsa005102 | Colorectum | MSS | N-Glycan biosynthesis | 20/1875 | 53/8465 | 7.17e-03 | 2.83e-02 | 1.73e-02 | 20 |
| hsa00513 | Colorectum | MSS | Various types of N-glycan biosynthesis | 16/1875 | 42/8465 | 1.39e-02 | 4.53e-02 | 2.77e-02 | 16 |
| hsa041415 | Colorectum | MSS | Protein processing in endoplasmic reticulum | 75/1875 | 174/8465 | 3.78e-10 | 8.44e-09 | 5.17e-09 | 75 |
| hsa005103 | Colorectum | MSS | N-Glycan biosynthesis | 20/1875 | 53/8465 | 7.17e-03 | 2.83e-02 | 1.73e-02 | 20 |
| hsa005131 | Colorectum | MSS | Various types of N-glycan biosynthesis | 16/1875 | 42/8465 | 1.39e-02 | 4.53e-02 | 2.77e-02 | 16 |
| hsa041416 | Colorectum | MSI-H | Protein processing in endoplasmic reticulum | 46/797 | 174/8465 | 4.53e-11 | 9.78e-10 | 8.19e-10 | 46 |
| hsa041417 | Colorectum | MSI-H | Protein processing in endoplasmic reticulum | 46/797 | 174/8465 | 4.53e-11 | 9.78e-10 | 8.19e-10 | 46 |
| hsa0414126 | Endometrium | AEH | Protein processing in endoplasmic reticulum | 62/1197 | 174/8465 | 5.97e-13 | 1.39e-11 | 1.01e-11 | 62 |
| hsa04141111 | Endometrium | AEH | Protein processing in endoplasmic reticulum | 62/1197 | 174/8465 | 5.97e-13 | 1.39e-11 | 1.01e-11 | 62 |
| Page: 1 2 3 4 |
Top |
Cell-cell communication analysis |
| Identification of potential cell-cell interactions between two cell types and their ligand-receptor pairs for different disease states |
| Ligand | Receptor | LRpair | Pathway | Tissue | Disease Stage |
| Page: 1 |
Top |
Single-cell gene regulatory network inference analysis |
| Find out the significant the regulons (TFs) and the target genes of each regulon across cell types for different disease states |
| TF | Cell Type | Tissue | Disease Stage | Target Gene | RSS | Regulon Activity |
| ∗The dot plots of a searched regulon are shown for all cell subpopulations in each disease state of each tissue based on the regulon specific score inferred using pySCENIC and by calculating the average expression. |
| Page: 1 |
Top |
Somatic mutation of malignant transformation related genes |
| Annotation of somatic variants for genes involved in malignant transformation |
| Hugo Symbol | Variant Class | Variant Classification | dbSNP RS | HGVSc | HGVSp | HGVSp Short | SWISSPROT | BIOTYPE | SIFT | PolyPhen | Tumor Sample Barcode | Tissue | Histology | Sex | Age | Stage | Therapy Types | Drugs | Outcome |
| TMEM258 | insertion | Nonsense_Mutation | novel | c.159_160insTCCCTGCCATAAACATAGCCACCATT | p.Leu54SerfsTer4 | p.L54Sfs*4 | P61165 | protein_coding | TCGA-AR-A0TY-01 | Breast | breast invasive carcinoma | Female | <65 | I/II | Unspecific | Paclitaxel | PD | ||
| TMEM258 | SNV | Missense_Mutation | c.227G>A | p.Gly76Asp | p.G76D | P61165 | protein_coding | deleterious(0.02) | probably_damaging(0.989) | TCGA-BG-A0M0-01 | Endometrium | uterine corpus endometrioid carcinoma | Female | >=65 | I/II | Unknown | Unknown | SD | |
| TMEM258 | SNV | Missense_Mutation | c.93N>A | p.Phe31Leu | p.F31L | P61165 | protein_coding | tolerated(0.2) | benign(0.04) | TCGA-BS-A0UV-01 | Endometrium | uterine corpus endometrioid carcinoma | Female | <65 | III/IV | Unknown | Unknown | SD | |
| TMEM258 | SNV | Missense_Mutation | novel | c.137N>G | p.Tyr46Cys | p.Y46C | P61165 | protein_coding | tolerated(0.1) | benign(0.013) | TCGA-55-8089-01 | Lung | lung adenocarcinoma | Male | <65 | I/II | Unknown | Unknown | SD |
| TMEM258 | SNV | Missense_Mutation | rs764740554 | c.67N>A | p.Val23Met | p.V23M | P61165 | protein_coding | tolerated(0.29) | benign(0.058) | TCGA-CV-5970-01 | Oral cavity | head & neck squamous cell carcinoma | Male | <65 | I/II | Unknown | Unknown | PD |
| TMEM258 | SNV | Missense_Mutation | c.112N>A | p.Val38Ile | p.V38I | P61165 | protein_coding | tolerated(0.66) | benign(0.112) | TCGA-HU-A4GQ-01 | Stomach | stomach adenocarcinoma | Male | >=65 | III/IV | Unknown | Unknown | SD |
| Page: 1 |
Top |
Related drugs of malignant transformation related genes |
| Identification of chemicals and drugs interact with genes involved in malignant transfromation |
| (DGIdb 4.0) |
| Entrez ID | Symbol | Category | Interaction Types | Drug Claim Name | Drug Name | PMIDs |
| Page: 1 |

Copyright 2023-Present -The University of Texas Health Science Center at Houston |