
|
|||||
|
 | |
| |
| |
| |
| |
| |
|
Gene: TMEM254 |
Gene summary for TMEM254 |
| Gene information | Species | Human | Gene symbol | TMEM254 | Gene ID | 80195 |
| Gene name | transmembrane protein 254 | |
| Gene Alias | C10orf57 | |
| Cytomap | 10q22.3 | |
| Gene Type | protein-coding | GO ID | GO:0005575 | UniProtAcc | B4DU43 |
Top |
Malignant transformation analysis |
| Identification of the aberrant gene expression in precancerous and cancerous lesions by comparing the gene expression of stem-like cells in diseased tissues with normal stem cells |
| Entrez ID | Symbol | Replicates | Species | Organ | Tissue | Adj P-value | Log2FC | Malignancy |
| 80195 | TMEM254 | HTA11_78_2000001011 | Human | Colorectum | AD | 1.25e-04 | 2.87e-01 | -0.1088 |
| 80195 | TMEM254 | HTA11_347_2000001011 | Human | Colorectum | AD | 4.09e-11 | 3.54e-01 | -0.1954 |
| 80195 | TMEM254 | HTA11_1391_2000001011 | Human | Colorectum | AD | 5.15e-03 | 2.40e-01 | -0.059 |
| 80195 | TMEM254 | HTA11_7862_2000001011 | Human | Colorectum | AD | 4.35e-04 | 3.43e-01 | -0.0179 |
| 80195 | TMEM254 | HTA11_7663_2000001011 | Human | Colorectum | SER | 3.24e-04 | 3.62e-01 | 0.0131 |
| 80195 | TMEM254 | HTA11_99999970781_79442 | Human | Colorectum | MSS | 8.96e-08 | 3.48e-01 | 0.294 |
| 80195 | TMEM254 | HTA11_99999965104_69814 | Human | Colorectum | MSS | 2.69e-06 | 3.14e-01 | 0.281 |
| 80195 | TMEM254 | HTA11_99999971662_82457 | Human | Colorectum | MSS | 3.38e-02 | 2.23e-01 | 0.3859 |
| 80195 | TMEM254 | LZE4T | Human | Esophagus | ESCC | 7.05e-12 | 4.00e-01 | 0.0811 |
| 80195 | TMEM254 | LZE8T | Human | Esophagus | ESCC | 5.56e-07 | 1.87e-01 | 0.067 |
| 80195 | TMEM254 | LZE24T | Human | Esophagus | ESCC | 1.06e-15 | 4.77e-01 | 0.0596 |
| 80195 | TMEM254 | P1T-E | Human | Esophagus | ESCC | 3.40e-04 | 1.66e-01 | 0.0875 |
| 80195 | TMEM254 | P2T-E | Human | Esophagus | ESCC | 2.53e-36 | 7.01e-01 | 0.1177 |
| 80195 | TMEM254 | P4T-E | Human | Esophagus | ESCC | 1.99e-27 | 6.30e-01 | 0.1323 |
| 80195 | TMEM254 | P5T-E | Human | Esophagus | ESCC | 7.24e-14 | 2.48e-01 | 0.1327 |
| 80195 | TMEM254 | P8T-E | Human | Esophagus | ESCC | 2.32e-15 | 2.06e-01 | 0.0889 |
| 80195 | TMEM254 | P9T-E | Human | Esophagus | ESCC | 7.76e-04 | 9.88e-02 | 0.1131 |
| 80195 | TMEM254 | P10T-E | Human | Esophagus | ESCC | 3.30e-18 | 2.79e-01 | 0.116 |
| 80195 | TMEM254 | P11T-E | Human | Esophagus | ESCC | 1.39e-11 | 4.93e-01 | 0.1426 |
| 80195 | TMEM254 | P12T-E | Human | Esophagus | ESCC | 5.40e-23 | 4.31e-01 | 0.1122 |
| Page: 1 2 3 4 5 |
| Tissue | Expression Dynamics | Abbreviation |
| Colorectum (GSE201348) |  | FAP: Familial adenomatous polyposis |
| CRC: Colorectal cancer | ||
| Colorectum (HTA11) |  | AD: Adenomas |
| SER: Sessile serrated lesions | ||
| MSI-H: Microsatellite-high colorectal cancer | ||
| MSS: Microsatellite stable colorectal cancer | ||
| Esophagus |  | ESCC: Esophageal squamous cell carcinoma |
| HGIN: High-grade intraepithelial neoplasias | ||
| LGIN: Low-grade intraepithelial neoplasias | ||
| Liver | 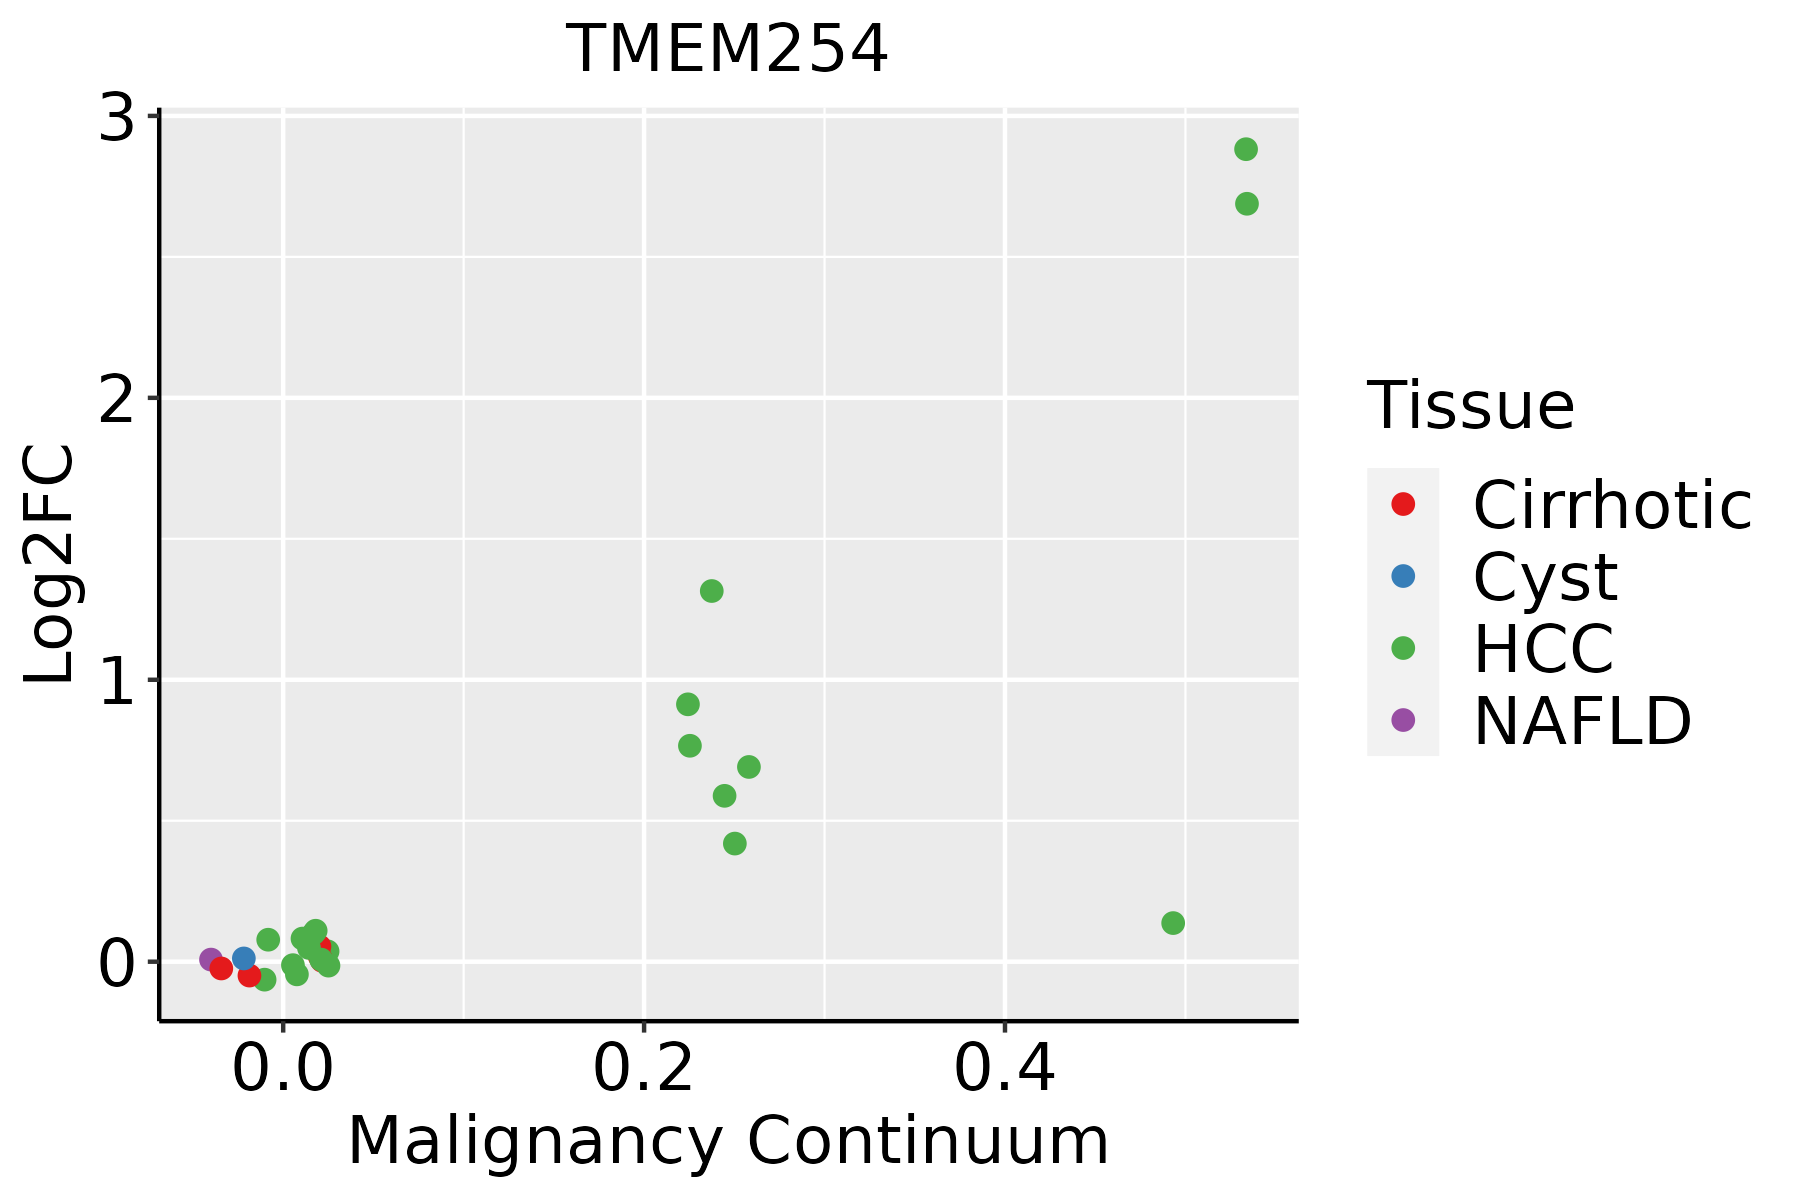 | HCC: Hepatocellular carcinoma |
| NAFLD: Non-alcoholic fatty liver disease | ||
| Oral Cavity | 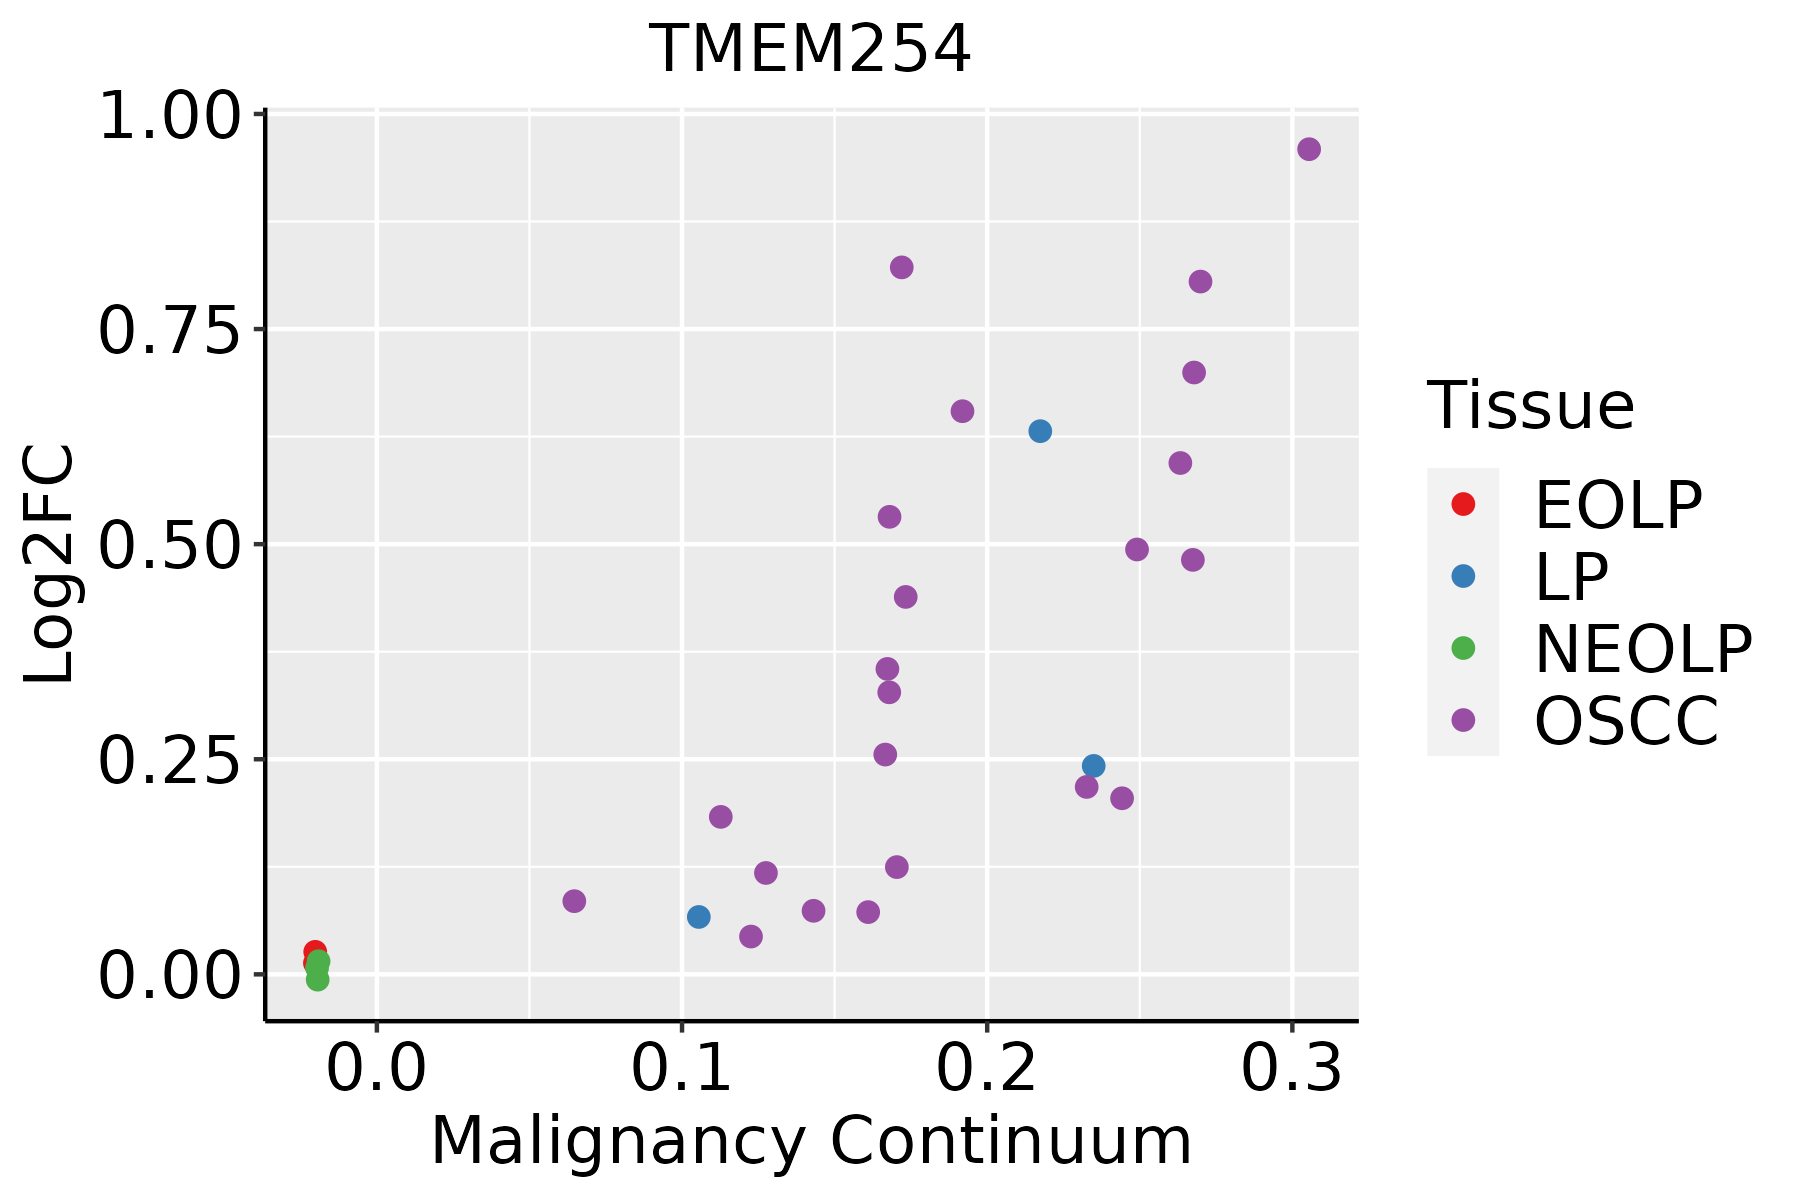 | EOLP: Erosive Oral lichen planus |
| LP: leukoplakia | ||
| NEOLP: Non-erosive oral lichen planus | ||
| OSCC: Oral squamous cell carcinoma |
| ∗log2FC in expression of this searched gene in stem-like cells from each diseased tissue sample relative to stem-like cells in normal samples in each tissue plotted against the malignancy continuum. Samples are colored based on if they are from different disease stage. |
Top |
Malignant transformation related pathway analysis |
| Find out the enriched GO biological processes and KEGG pathways involved in transition from healthy to precancer to cancer |
| Tissue | Disease Stage | Enriched GO biological Processes |
| Colorectum | AD |  |
| Colorectum | SER |  |
| Colorectum | MSS |  |
| Colorectum | MSI-H |  |
| Colorectum | FAP |  |
| ∗Top 15 enriched GO BP terms are showed in the bar plot of each disease state in each tissue. Each row represents a significant GO biological process which is colored according to the -log10(p.adjust). |
| Page: 1 2 3 4 5 6 7 8 9 |
| GO ID | Tissue | Disease Stage | Description | Gene Ratio | Bg Ratio | pvalue | p.adjust | Count |
| Page: 1 |
| Pathway ID | Tissue | Disease Stage | Description | Gene Ratio | Bg Ratio | pvalue | p.adjust | qvalue | Count |
| Page: 1 |
Top |
Cell-cell communication analysis |
| Identification of potential cell-cell interactions between two cell types and their ligand-receptor pairs for different disease states |
| Ligand | Receptor | LRpair | Pathway | Tissue | Disease Stage |
| Page: 1 |
Top |
Single-cell gene regulatory network inference analysis |
| Find out the significant the regulons (TFs) and the target genes of each regulon across cell types for different disease states |
| TF | Cell Type | Tissue | Disease Stage | Target Gene | RSS | Regulon Activity |
| ∗The dot plots of a searched regulon are shown for all cell subpopulations in each disease state of each tissue based on the regulon specific score inferred using pySCENIC and by calculating the average expression. |
| Page: 1 |
Top |
Somatic mutation of malignant transformation related genes |
| Annotation of somatic variants for genes involved in malignant transformation |
| Hugo Symbol | Variant Class | Variant Classification | dbSNP RS | HGVSc | HGVSp | HGVSp Short | SWISSPROT | BIOTYPE | SIFT | PolyPhen | Tumor Sample Barcode | Tissue | Histology | Sex | Age | Stage | Therapy Types | Drugs | Outcome |
| TMEM254 | SNV | Missense_Mutation | novel | c.64A>C | p.Thr22Pro | p.T22P | Q8TBM7 | protein_coding | deleterious(0.02) | benign(0.202) | TCGA-D8-A1JM-01 | Breast | breast invasive carcinoma | Female | <65 | I/II | ChemotherapyHormone Therapy | doxorubicine | SD |
| TMEM254 | SNV | Missense_Mutation | rs144946848 | c.349N>T | p.Arg117Trp | p.R117W | Q8TBM7 | protein_coding | deleterious(0) | benign(0.409) | TCGA-C5-A1BJ-01 | Cervix | cervical & endocervical cancer | Female | <65 | I/II | Unknown | Unknown | SD |
| TMEM254 | SNV | Missense_Mutation | rs777639712 | c.355C>T | p.Arg119Cys | p.R119C | Q8TBM7 | protein_coding | deleterious(0.04) | possibly_damaging(0.629) | TCGA-AD-6963-01 | Colorectum | colon adenocarcinoma | Male | <65 | I/II | Unknown | Unknown | SD |
| TMEM254 | SNV | Missense_Mutation | rs748149784 | c.274N>T | p.Arg92Trp | p.R92W | Q8TBM7 | protein_coding | tolerated(0.14) | benign(0.003) | TCGA-A5-A0GB-01 | Endometrium | uterine corpus endometrioid carcinoma | Female | >=65 | I/II | Unknown | Unknown | SD |
| TMEM254 | SNV | Missense_Mutation | c.136N>A | p.Leu46Met | p.L46M | Q8TBM7 | protein_coding | deleterious(0) | probably_damaging(0.999) | TCGA-AP-A059-01 | Endometrium | uterine corpus endometrioid carcinoma | Female | >=65 | I/II | Unknown | Unknown | SD | |
| TMEM254 | SNV | Missense_Mutation | rs749053952 | c.356G>A | p.Arg119His | p.R119H | Q8TBM7 | protein_coding | tolerated(0.26) | benign(0.003) | TCGA-AX-A1C9-01 | Endometrium | uterine corpus endometrioid carcinoma | Female | >=65 | I/II | Unknown | Unknown | SD |
| TMEM254 | SNV | Missense_Mutation | novel | c.134C>T | p.Pro45Leu | p.P45L | Q8TBM7 | protein_coding | tolerated(0.27) | benign(0.119) | TCGA-E6-A2P8-01 | Endometrium | uterine corpus endometrioid carcinoma | Female | <65 | III/IV | Unknown | Unknown | PD |
| TMEM254 | SNV | Missense_Mutation | c.291N>C | p.Trp97Cys | p.W97C | Q8TBM7 | protein_coding | deleterious(0) | probably_damaging(0.999) | TCGA-DD-A11C-01 | Liver | liver hepatocellular carcinoma | Male | >=65 | I/II | Unknown | Unknown | SD | |
| TMEM254 | SNV | Missense_Mutation | novel | c.40N>C | p.Ser14Arg | p.S14R | Q8TBM7 | protein_coding | tolerated(0.39) | benign(0.015) | TCGA-G3-A3CG-01 | Liver | liver hepatocellular carcinoma | Male | >=65 | I/II | Targeted Molecular therapy | sorafenib | SD |
| TMEM254 | SNV | Missense_Mutation | c.106N>G | p.Gln36Glu | p.Q36E | Q8TBM7 | protein_coding | tolerated(0.49) | benign(0.003) | TCGA-91-6848-01 | Lung | lung adenocarcinoma | Male | <65 | III/IV | Chemotherapy | cisplatin | CR |
| Page: 1 2 |
Top |
Related drugs of malignant transformation related genes |
| Identification of chemicals and drugs interact with genes involved in malignant transfromation |
| (DGIdb 4.0) |
| Entrez ID | Symbol | Category | Interaction Types | Drug Claim Name | Drug Name | PMIDs |
| Page: 1 |

Copyright 2023-Present -The University of Texas Health Science Center at Houston |