
|
|||||
|
 | |
| |
| |
| |
| |
| |
|
Gene: TMEM243 |
Gene summary for TMEM243 |
| Gene information | Species | Human | Gene symbol | TMEM243 | Gene ID | 79161 |
| Gene name | transmembrane protein 243 | |
| Gene Alias | C7orf23 | |
| Cytomap | 7q21.12 | |
| Gene Type | protein-coding | GO ID | GO:0005575 | UniProtAcc | Q9BU79 |
Top |
Malignant transformation analysis |
| Identification of the aberrant gene expression in precancerous and cancerous lesions by comparing the gene expression of stem-like cells in diseased tissues with normal stem cells |
| Entrez ID | Symbol | Replicates | Species | Organ | Tissue | Adj P-value | Log2FC | Malignancy |
| 79161 | TMEM243 | LZE4T | Human | Esophagus | ESCC | 2.51e-05 | 6.35e-02 | 0.0811 |
| 79161 | TMEM243 | LZE5T | Human | Esophagus | ESCC | 1.65e-05 | 2.92e-01 | 0.0514 |
| 79161 | TMEM243 | LZE7T | Human | Esophagus | ESCC | 1.53e-08 | 4.15e-01 | 0.0667 |
| 79161 | TMEM243 | LZE8T | Human | Esophagus | ESCC | 1.27e-07 | 9.49e-02 | 0.067 |
| 79161 | TMEM243 | LZE20T | Human | Esophagus | ESCC | 4.89e-02 | 8.04e-02 | 0.0662 |
| 79161 | TMEM243 | LZE21D1 | Human | Esophagus | HGIN | 2.98e-02 | 7.92e-02 | 0.0632 |
| 79161 | TMEM243 | LZE22T | Human | Esophagus | ESCC | 1.67e-02 | 2.92e-01 | 0.068 |
| 79161 | TMEM243 | LZE24T | Human | Esophagus | ESCC | 6.86e-19 | 5.05e-01 | 0.0596 |
| 79161 | TMEM243 | LZE22D3 | Human | Esophagus | HGIN | 1.46e-02 | 5.03e-01 | 0.0653 |
| 79161 | TMEM243 | LZE6T | Human | Esophagus | ESCC | 1.39e-04 | 1.32e-01 | 0.0845 |
| 79161 | TMEM243 | P1T-E | Human | Esophagus | ESCC | 7.87e-09 | 5.21e-01 | 0.0875 |
| 79161 | TMEM243 | P2T-E | Human | Esophagus | ESCC | 2.25e-15 | 2.43e-01 | 0.1177 |
| 79161 | TMEM243 | P4T-E | Human | Esophagus | ESCC | 2.71e-26 | 5.83e-01 | 0.1323 |
| 79161 | TMEM243 | P5T-E | Human | Esophagus | ESCC | 1.32e-13 | 2.73e-01 | 0.1327 |
| 79161 | TMEM243 | P8T-E | Human | Esophagus | ESCC | 2.47e-35 | 5.93e-01 | 0.0889 |
| 79161 | TMEM243 | P9T-E | Human | Esophagus | ESCC | 3.14e-18 | 4.03e-01 | 0.1131 |
| 79161 | TMEM243 | P10T-E | Human | Esophagus | ESCC | 7.19e-38 | 7.05e-01 | 0.116 |
| 79161 | TMEM243 | P11T-E | Human | Esophagus | ESCC | 4.40e-12 | 4.13e-01 | 0.1426 |
| 79161 | TMEM243 | P12T-E | Human | Esophagus | ESCC | 3.43e-22 | 3.72e-01 | 0.1122 |
| 79161 | TMEM243 | P15T-E | Human | Esophagus | ESCC | 1.87e-31 | 4.68e-01 | 0.1149 |
| Page: 1 2 3 4 5 6 |
| Tissue | Expression Dynamics | Abbreviation |
| Esophagus | 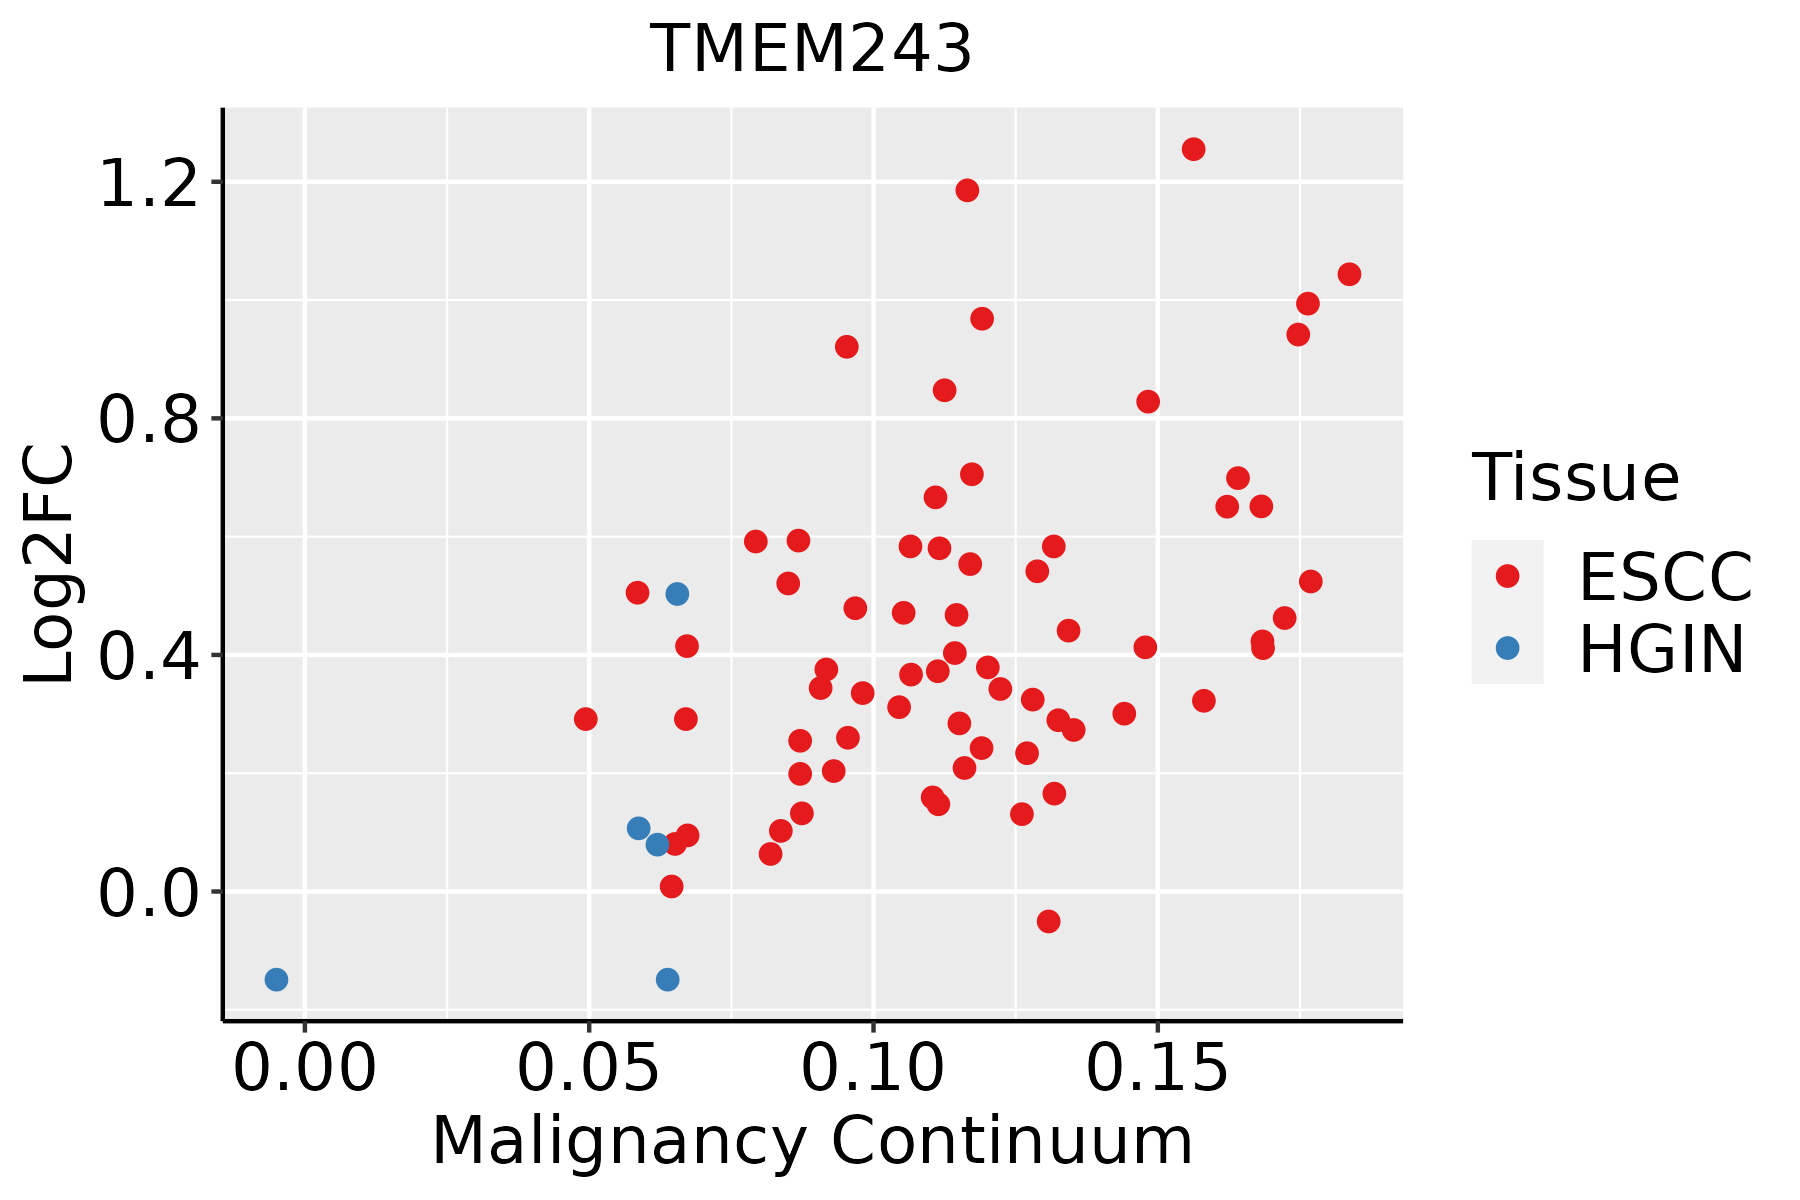 | ESCC: Esophageal squamous cell carcinoma |
| HGIN: High-grade intraepithelial neoplasias | ||
| LGIN: Low-grade intraepithelial neoplasias | ||
| Liver | 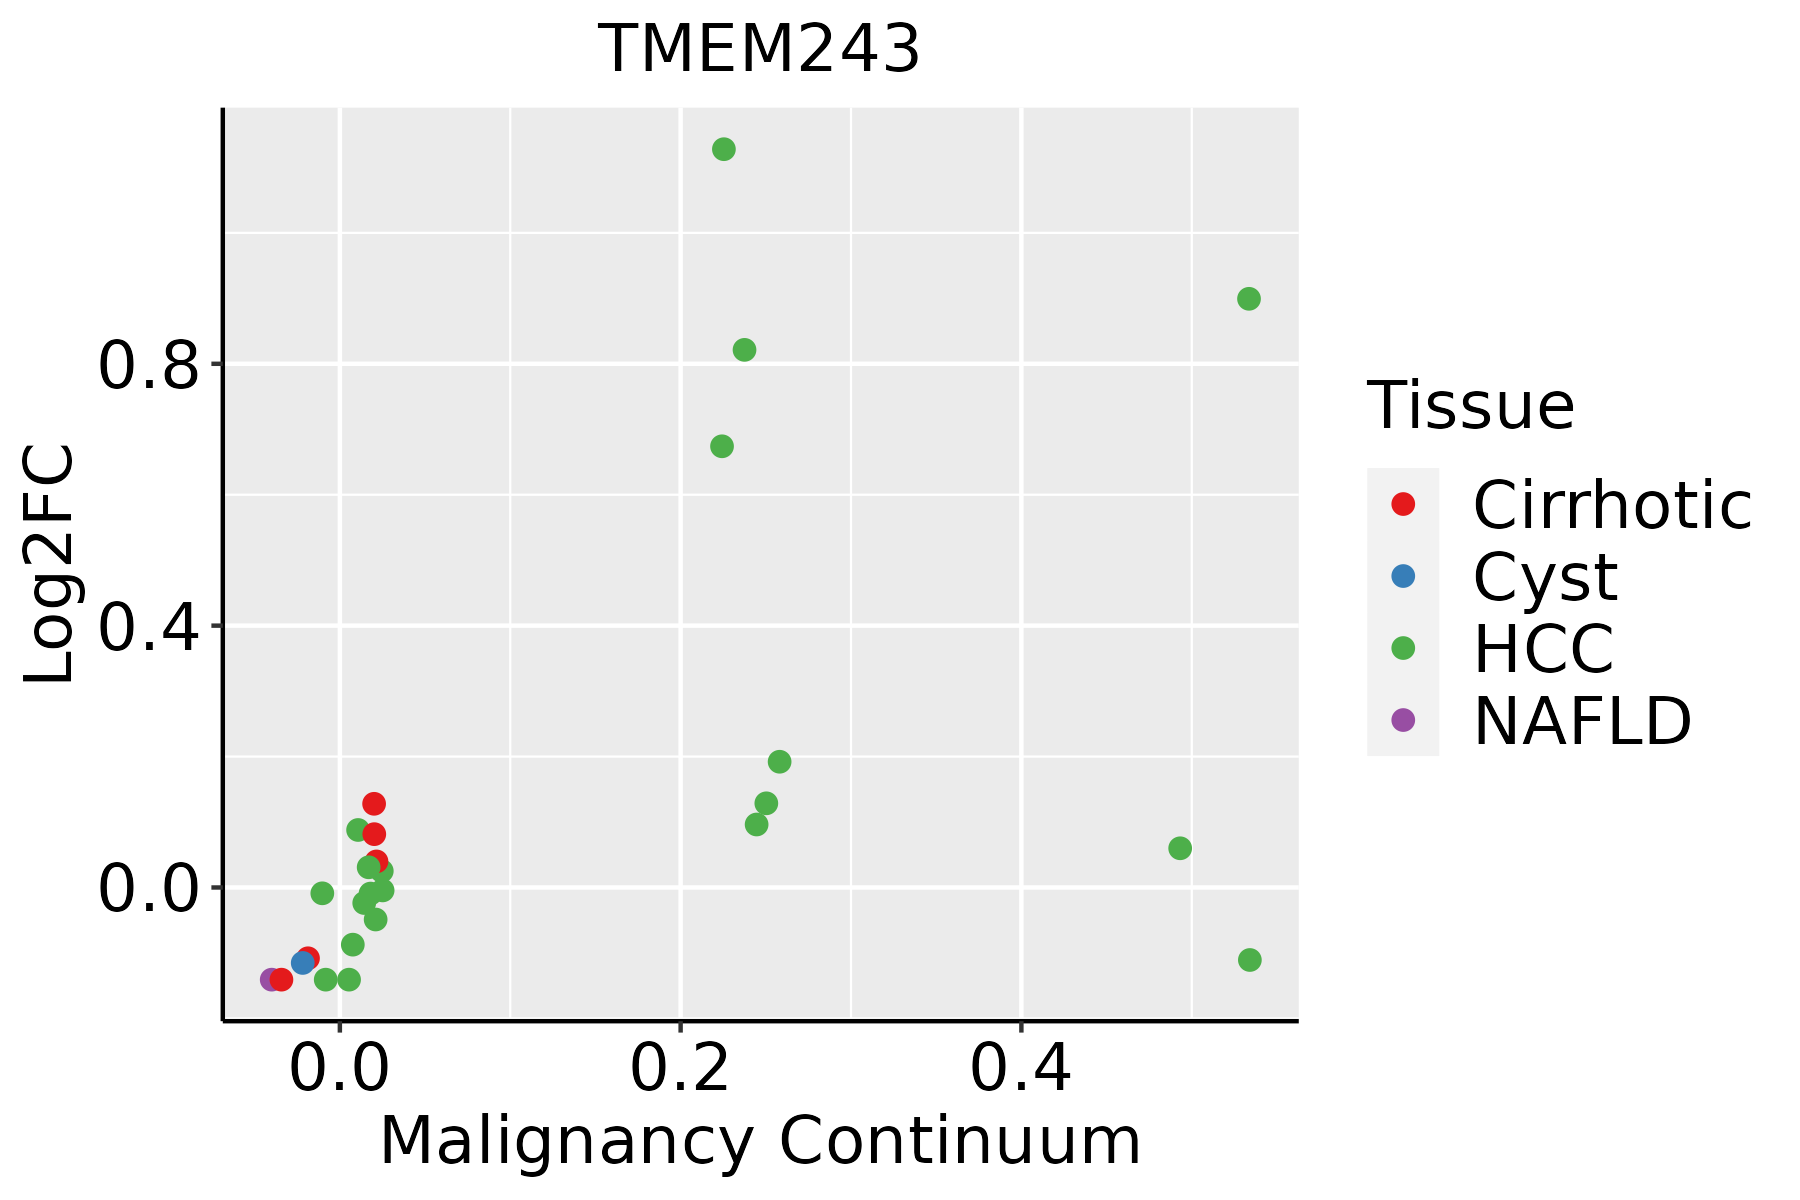 | HCC: Hepatocellular carcinoma |
| NAFLD: Non-alcoholic fatty liver disease | ||
| Lung | 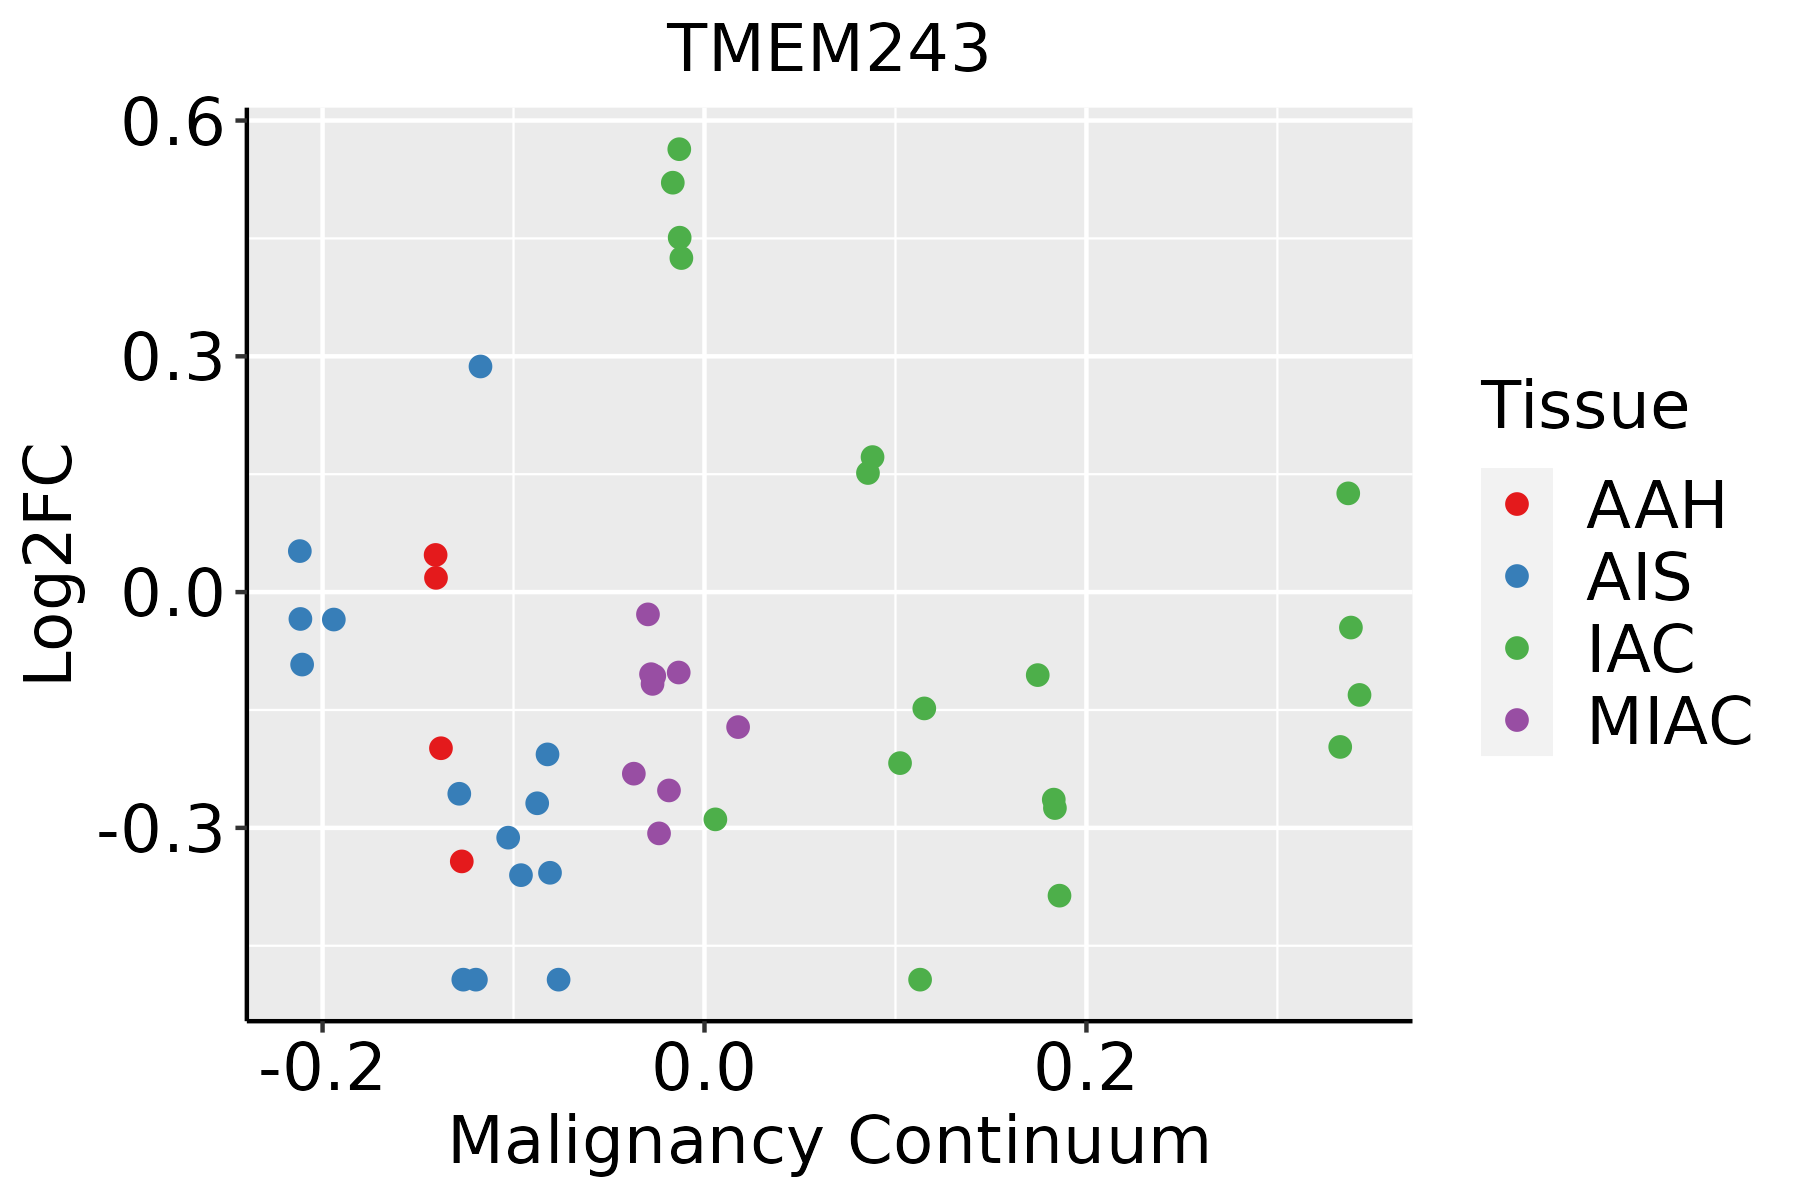 | AAH: Atypical adenomatous hyperplasia |
| AIS: Adenocarcinoma in situ | ||
| IAC: Invasive lung adenocarcinoma | ||
| MIA: Minimally invasive adenocarcinoma | ||
| Oral Cavity |  | EOLP: Erosive Oral lichen planus |
| LP: leukoplakia | ||
| NEOLP: Non-erosive oral lichen planus | ||
| OSCC: Oral squamous cell carcinoma | ||
| Thyroid |  | ATC: Anaplastic thyroid cancer |
| HT: Hashimoto's thyroiditis | ||
| PTC: Papillary thyroid cancer |
| ∗log2FC in expression of this searched gene in stem-like cells from each diseased tissue sample relative to stem-like cells in normal samples in each tissue plotted against the malignancy continuum. Samples are colored based on if they are from different disease stage. |
Top |
Malignant transformation related pathway analysis |
| Find out the enriched GO biological processes and KEGG pathways involved in transition from healthy to precancer to cancer |
| Tissue | Disease Stage | Enriched GO biological Processes |
| Colorectum | AD |  |
| Colorectum | SER |  |
| Colorectum | MSS |  |
| Colorectum | MSI-H |  |
| Colorectum | FAP |  |
| ∗Top 15 enriched GO BP terms are showed in the bar plot of each disease state in each tissue. Each row represents a significant GO biological process which is colored according to the -log10(p.adjust). |
| Page: 1 2 3 4 5 6 7 8 9 |
| GO ID | Tissue | Disease Stage | Description | Gene Ratio | Bg Ratio | pvalue | p.adjust | Count |
| Page: 1 |
| Pathway ID | Tissue | Disease Stage | Description | Gene Ratio | Bg Ratio | pvalue | p.adjust | qvalue | Count |
| Page: 1 |
Top |
Cell-cell communication analysis |
| Identification of potential cell-cell interactions between two cell types and their ligand-receptor pairs for different disease states |
| Ligand | Receptor | LRpair | Pathway | Tissue | Disease Stage |
| Page: 1 |
Top |
Single-cell gene regulatory network inference analysis |
| Find out the significant the regulons (TFs) and the target genes of each regulon across cell types for different disease states |
| TF | Cell Type | Tissue | Disease Stage | Target Gene | RSS | Regulon Activity |
| ∗The dot plots of a searched regulon are shown for all cell subpopulations in each disease state of each tissue based on the regulon specific score inferred using pySCENIC and by calculating the average expression. |
| Page: 1 |
Top |
Somatic mutation of malignant transformation related genes |
| Annotation of somatic variants for genes involved in malignant transformation |
| Hugo Symbol | Variant Class | Variant Classification | dbSNP RS | HGVSc | HGVSp | HGVSp Short | SWISSPROT | BIOTYPE | SIFT | PolyPhen | Tumor Sample Barcode | Tissue | Histology | Sex | Age | Stage | Therapy Types | Drugs | Outcome |
| TMEM243 | SNV | Missense_Mutation | c.179N>C | p.Leu60Ser | p.L60S | Q9BU79 | protein_coding | deleterious(0.05) | possibly_damaging(0.66) | TCGA-AA-A010-01 | Colorectum | colon adenocarcinoma | Female | <65 | I/II | Chemotherapy | folinic | CR | |
| TMEM243 | SNV | Missense_Mutation | novel | c.142N>C | p.Ser48Arg | p.S48R | Q9BU79 | protein_coding | tolerated(0.06) | benign(0.007) | TCGA-E6-A1LX-01 | Endometrium | uterine corpus endometrioid carcinoma | Female | <65 | I/II | Unknown | Unknown | SD |
| TMEM243 | SNV | Missense_Mutation | rs376906362 | c.128N>C | p.Leu43Pro | p.L43P | Q9BU79 | protein_coding | deleterious(0.02) | possibly_damaging(0.857) | TCGA-E6-A1M0-01 | Endometrium | uterine corpus endometrioid carcinoma | Female | <65 | III/IV | Chemotherapy | carboplatin | SD |
| TMEM243 | SNV | Missense_Mutation | rs375982092 | c.248G>A | p.Arg83Gln | p.R83Q | Q9BU79 | protein_coding | deleterious(0) | probably_damaging(0.988) | TCGA-E6-A2P9-01 | Endometrium | uterine corpus endometrioid carcinoma | Female | >=65 | I/II | Unknown | Unknown | SD |
| TMEM243 | SNV | Missense_Mutation | rs766468075 | c.266N>T | p.Pro89Leu | p.P89L | Q9BU79 | protein_coding | deleterious(0) | probably_damaging(0.999) | TCGA-G3-A25V-01 | Liver | liver hepatocellular carcinoma | Male | >=65 | I/II | Unknown | Unknown | PD |
| TMEM243 | insertion | Nonsense_Mutation | novel | c.131_132insTGTATAGACCC | p.Thr45ValfsTer2 | p.T45Vfs*2 | Q9BU79 | protein_coding | TCGA-FY-A4B0-01 | Thyroid | thyroid carcinoma | Male | >=65 | I/II | Hormone Therapy | synthroid | SD |
| Page: 1 |
Top |
Related drugs of malignant transformation related genes |
| Identification of chemicals and drugs interact with genes involved in malignant transfromation |
| (DGIdb 4.0) |
| Entrez ID | Symbol | Category | Interaction Types | Drug Claim Name | Drug Name | PMIDs |
| Page: 1 |

Copyright 2023-Present -The University of Texas Health Science Center at Houston |