
|
|||||
|
 | |
| |
| |
| |
| |
| |
|
Gene: TMEM241 |
Gene summary for TMEM241 |
| Gene information | Species | Human | Gene symbol | TMEM241 | Gene ID | 85019 |
| Gene name | transmembrane protein 241 | |
| Gene Alias | C18orf45 | |
| Cytomap | 18q11.2 | |
| Gene Type | protein-coding | GO ID | GO:0006810 | UniProtAcc | B4DH40 |
Top |
Malignant transformation analysis |
| Identification of the aberrant gene expression in precancerous and cancerous lesions by comparing the gene expression of stem-like cells in diseased tissues with normal stem cells |
| Entrez ID | Symbol | Replicates | Species | Organ | Tissue | Adj P-value | Log2FC | Malignancy |
| 85019 | TMEM241 | LZE24T | Human | Esophagus | ESCC | 1.10e-03 | 1.56e-01 | 0.0596 |
| 85019 | TMEM241 | P1T-E | Human | Esophagus | ESCC | 1.06e-02 | 2.67e-01 | 0.0875 |
| 85019 | TMEM241 | P2T-E | Human | Esophagus | ESCC | 1.38e-15 | 2.73e-01 | 0.1177 |
| 85019 | TMEM241 | P4T-E | Human | Esophagus | ESCC | 2.73e-13 | 2.69e-01 | 0.1323 |
| 85019 | TMEM241 | P5T-E | Human | Esophagus | ESCC | 6.56e-03 | 1.01e-01 | 0.1327 |
| 85019 | TMEM241 | P8T-E | Human | Esophagus | ESCC | 7.94e-04 | 1.40e-01 | 0.0889 |
| 85019 | TMEM241 | P9T-E | Human | Esophagus | ESCC | 5.48e-06 | 1.80e-01 | 0.1131 |
| 85019 | TMEM241 | P10T-E | Human | Esophagus | ESCC | 1.71e-04 | 6.92e-02 | 0.116 |
| 85019 | TMEM241 | P12T-E | Human | Esophagus | ESCC | 1.46e-08 | 1.15e-01 | 0.1122 |
| 85019 | TMEM241 | P16T-E | Human | Esophagus | ESCC | 8.03e-03 | 6.71e-02 | 0.1153 |
| 85019 | TMEM241 | P17T-E | Human | Esophagus | ESCC | 2.21e-04 | 2.25e-01 | 0.1278 |
| 85019 | TMEM241 | P20T-E | Human | Esophagus | ESCC | 1.98e-06 | 1.74e-01 | 0.1124 |
| 85019 | TMEM241 | P21T-E | Human | Esophagus | ESCC | 4.46e-24 | 5.13e-01 | 0.1617 |
| 85019 | TMEM241 | P22T-E | Human | Esophagus | ESCC | 1.06e-04 | 9.93e-02 | 0.1236 |
| 85019 | TMEM241 | P23T-E | Human | Esophagus | ESCC | 2.25e-10 | 3.02e-01 | 0.108 |
| 85019 | TMEM241 | P24T-E | Human | Esophagus | ESCC | 2.22e-05 | 1.24e-01 | 0.1287 |
| 85019 | TMEM241 | P26T-E | Human | Esophagus | ESCC | 3.05e-16 | 3.20e-01 | 0.1276 |
| 85019 | TMEM241 | P27T-E | Human | Esophagus | ESCC | 5.56e-11 | 2.53e-01 | 0.1055 |
| 85019 | TMEM241 | P28T-E | Human | Esophagus | ESCC | 5.44e-13 | 1.91e-01 | 0.1149 |
| 85019 | TMEM241 | P30T-E | Human | Esophagus | ESCC | 7.07e-09 | 3.03e-01 | 0.137 |
| Page: 1 2 3 4 |
| Tissue | Expression Dynamics | Abbreviation |
| Esophagus | 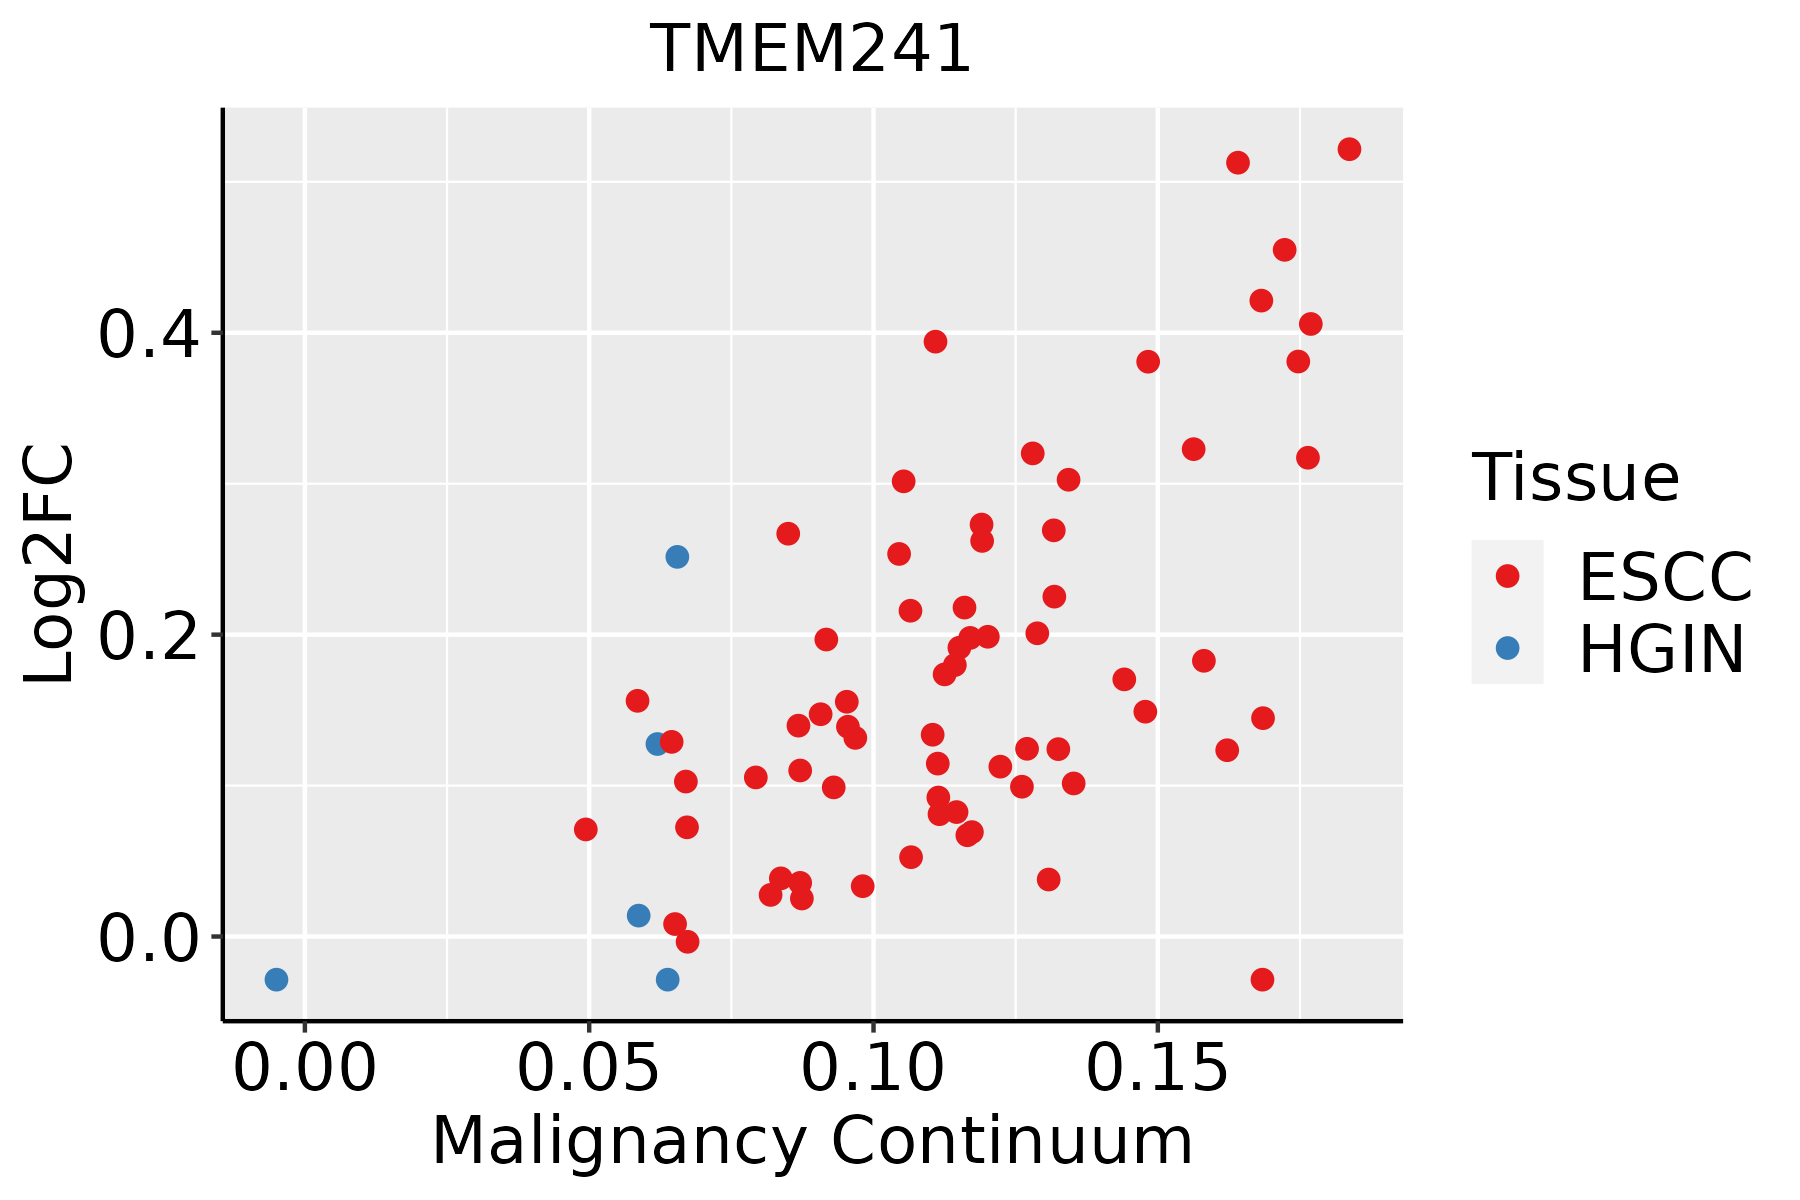 | ESCC: Esophageal squamous cell carcinoma |
| HGIN: High-grade intraepithelial neoplasias | ||
| LGIN: Low-grade intraepithelial neoplasias | ||
| Liver |  | HCC: Hepatocellular carcinoma |
| NAFLD: Non-alcoholic fatty liver disease | ||
| Lung | 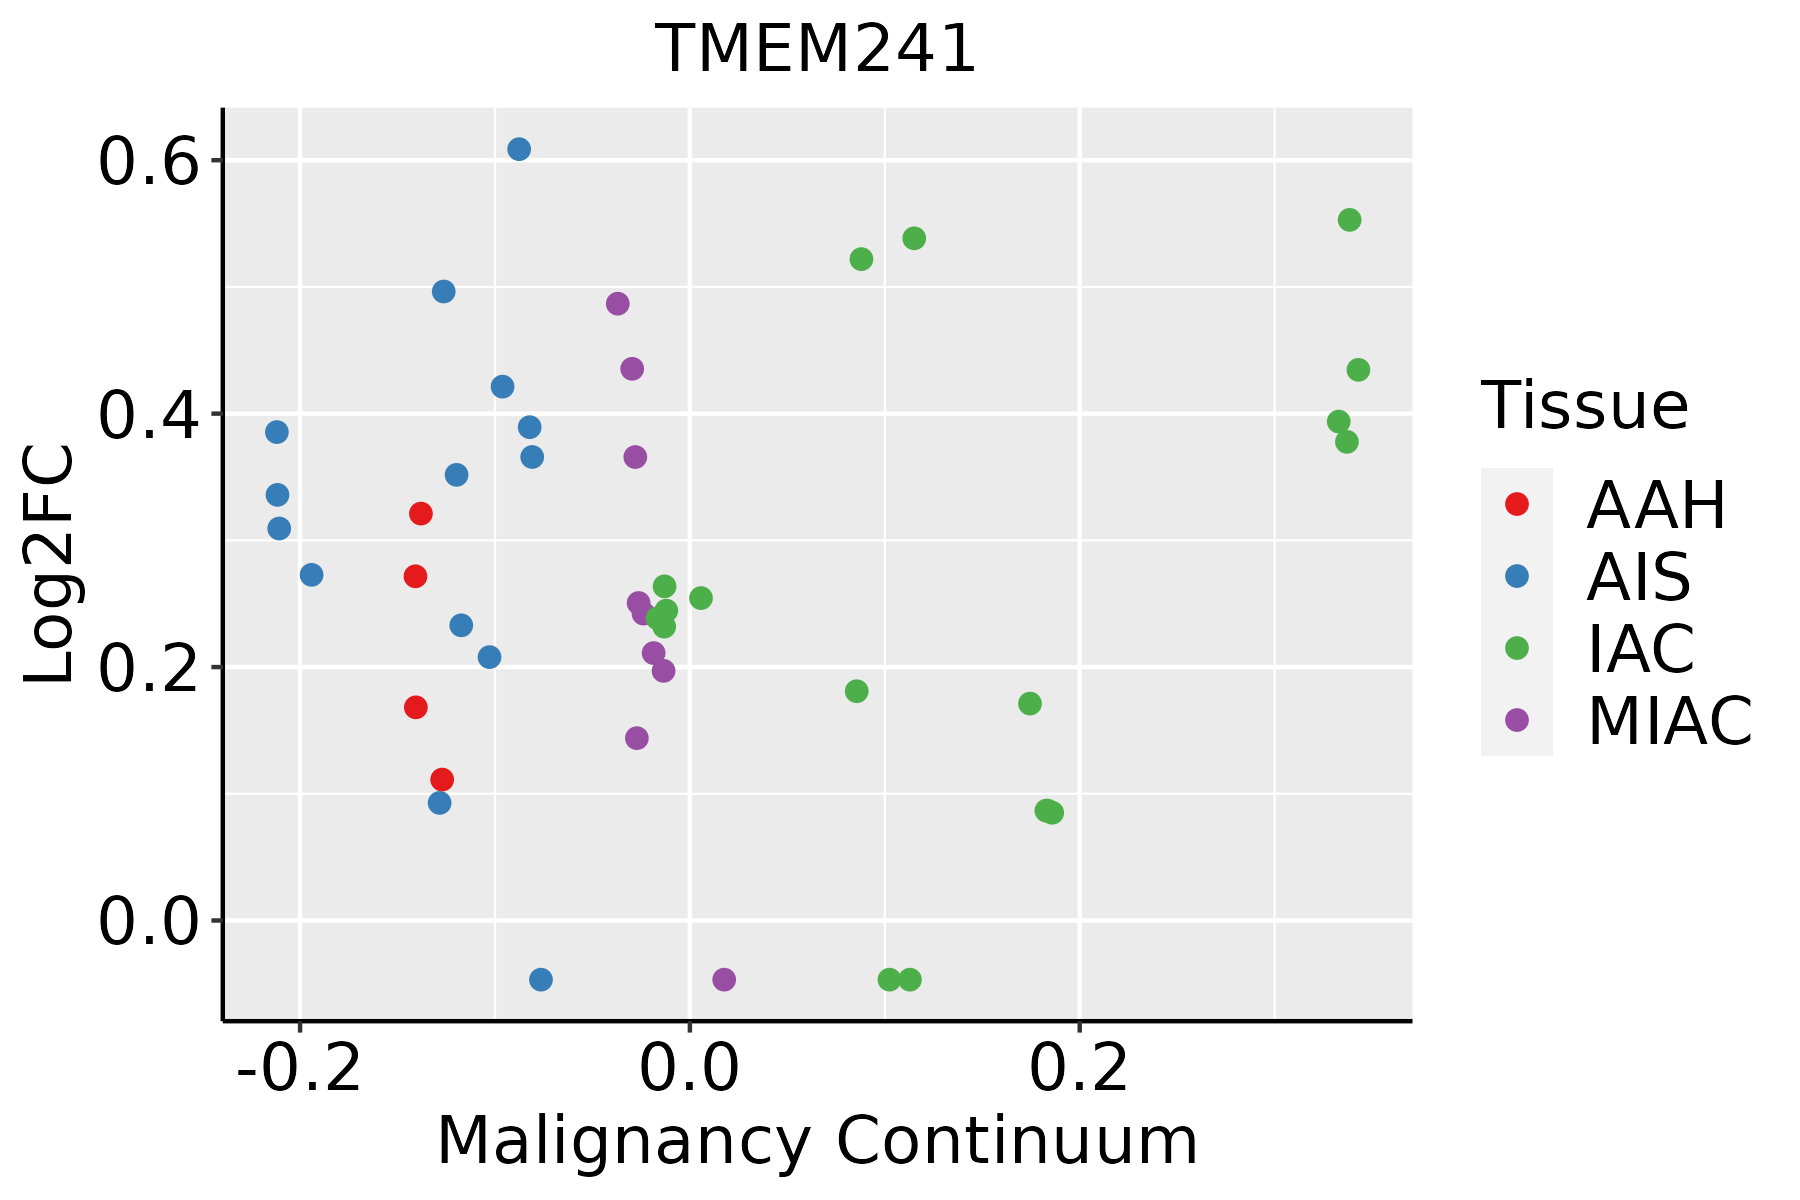 | AAH: Atypical adenomatous hyperplasia |
| AIS: Adenocarcinoma in situ | ||
| IAC: Invasive lung adenocarcinoma | ||
| MIA: Minimally invasive adenocarcinoma |
| ∗log2FC in expression of this searched gene in stem-like cells from each diseased tissue sample relative to stem-like cells in normal samples in each tissue plotted against the malignancy continuum. Samples are colored based on if they are from different disease stage. |
Top |
Malignant transformation related pathway analysis |
| Find out the enriched GO biological processes and KEGG pathways involved in transition from healthy to precancer to cancer |
| Tissue | Disease Stage | Enriched GO biological Processes |
| Colorectum | AD |  |
| Colorectum | SER |  |
| Colorectum | MSS |  |
| Colorectum | MSI-H |  |
| Colorectum | FAP |  |
| ∗Top 15 enriched GO BP terms are showed in the bar plot of each disease state in each tissue. Each row represents a significant GO biological process which is colored according to the -log10(p.adjust). |
| Page: 1 2 3 4 5 6 7 8 9 |
| GO ID | Tissue | Disease Stage | Description | Gene Ratio | Bg Ratio | pvalue | p.adjust | Count |
| Page: 1 |
| Pathway ID | Tissue | Disease Stage | Description | Gene Ratio | Bg Ratio | pvalue | p.adjust | qvalue | Count |
| Page: 1 |
Top |
Cell-cell communication analysis |
| Identification of potential cell-cell interactions between two cell types and their ligand-receptor pairs for different disease states |
| Ligand | Receptor | LRpair | Pathway | Tissue | Disease Stage |
| Page: 1 |
Top |
Single-cell gene regulatory network inference analysis |
| Find out the significant the regulons (TFs) and the target genes of each regulon across cell types for different disease states |
| TF | Cell Type | Tissue | Disease Stage | Target Gene | RSS | Regulon Activity |
| ∗The dot plots of a searched regulon are shown for all cell subpopulations in each disease state of each tissue based on the regulon specific score inferred using pySCENIC and by calculating the average expression. |
| Page: 1 |
Top |
Somatic mutation of malignant transformation related genes |
| Annotation of somatic variants for genes involved in malignant transformation |
| Hugo Symbol | Variant Class | Variant Classification | dbSNP RS | HGVSc | HGVSp | HGVSp Short | SWISSPROT | BIOTYPE | SIFT | PolyPhen | Tumor Sample Barcode | Tissue | Histology | Sex | Age | Stage | Therapy Types | Drugs | Outcome |
| TMEM241 | SNV | Missense_Mutation | c.853N>C | p.Glu285Gln | p.E285Q | Q24JQ0 | protein_coding | deleterious(0.01) | possibly_damaging(0.9) | TCGA-EK-A2R8-01 | Cervix | cervical & endocervical cancer | Female | <65 | I/II | Unknown | Unknown | SD | |
| TMEM241 | SNV | Missense_Mutation | novel | c.227N>T | p.Ser76Leu | p.S76L | Q24JQ0 | protein_coding | deleterious(0) | benign(0.108) | TCGA-VS-A8Q9-01 | Cervix | cervical & endocervical cancer | Female | >=65 | I/II | Unknown | Unknown | SD |
| TMEM241 | SNV | Missense_Mutation | novel | c.730C>A | p.Pro244Thr | p.P244T | Q24JQ0 | protein_coding | tolerated(0.33) | benign(0.083) | TCGA-VS-A9UH-01 | Cervix | cervical & endocervical cancer | Female | <65 | I/II | Chemotherapy | cisplatin | CR |
| TMEM241 | SNV | Missense_Mutation | novel | c.406N>A | p.Ala136Thr | p.A136T | Q24JQ0 | protein_coding | deleterious(0.01) | probably_damaging(0.962) | TCGA-5M-AAT6-01 | Colorectum | colon adenocarcinoma | Female | <65 | III/IV | Unknown | Unknown | PD |
| TMEM241 | SNV | Missense_Mutation | rs778244273 | c.824N>T | p.Thr275Met | p.T275M | Q24JQ0 | protein_coding | tolerated(0.11) | benign(0) | TCGA-A6-6781-01 | Colorectum | colon adenocarcinoma | Male | <65 | III/IV | Chemotherapy | oxaliplatin | SD |
| TMEM241 | SNV | Missense_Mutation | novel | c.455N>G | p.Phe152Cys | p.F152C | Q24JQ0 | protein_coding | deleterious(0.01) | possibly_damaging(0.893) | TCGA-AZ-4315-01 | Colorectum | colon adenocarcinoma | Male | <65 | I/II | Unknown | Unknown | SD |
| TMEM241 | SNV | Missense_Mutation | novel | c.95N>G | p.Phe32Cys | p.F32C | Q24JQ0 | protein_coding | deleterious(0) | probably_damaging(1) | TCGA-CA-6717-01 | Colorectum | colon adenocarcinoma | Male | <65 | I/II | Chemotherapy | oxaliplatin | CR |
| TMEM241 | SNV | Missense_Mutation | c.287N>A | p.Pro96His | p.P96H | Q24JQ0 | protein_coding | deleterious(0) | probably_damaging(0.982) | TCGA-A5-A0G1-01 | Endometrium | uterine corpus endometrioid carcinoma | Female | >=65 | I/II | Unknown | Unknown | SD | |
| TMEM241 | SNV | Missense_Mutation | c.814N>G | p.Ser272Gly | p.S272G | Q24JQ0 | protein_coding | tolerated(0.27) | benign(0.01) | TCGA-A5-A0VP-01 | Endometrium | uterine corpus endometrioid carcinoma | Female | >=65 | I/II | Unknown | Unknown | SD | |
| TMEM241 | SNV | Missense_Mutation | c.287N>T | p.Pro96Leu | p.P96L | Q24JQ0 | protein_coding | deleterious(0) | probably_damaging(0.909) | TCGA-AP-A059-01 | Endometrium | uterine corpus endometrioid carcinoma | Female | >=65 | I/II | Unknown | Unknown | SD |
| Page: 1 2 3 |
Top |
Related drugs of malignant transformation related genes |
| Identification of chemicals and drugs interact with genes involved in malignant transfromation |
| (DGIdb 4.0) |
| Entrez ID | Symbol | Category | Interaction Types | Drug Claim Name | Drug Name | PMIDs |
| Page: 1 |

Copyright 2023-Present -The University of Texas Health Science Center at Houston |