
|
|||||
|
 | |
| |
| |
| |
| |
| |
|
Gene: TMEM238 |
Gene summary for TMEM238 |
| Gene information | Species | Human | Gene symbol | TMEM238 | Gene ID | 388564 |
| Gene name | transmembrane protein 238 | |
| Gene Alias | TMEM238 | |
| Cytomap | 19q13.42 | |
| Gene Type | protein-coding | GO ID | GO:0005575 | UniProtAcc | C9JI98 |
Top |
Malignant transformation analysis |
| Identification of the aberrant gene expression in precancerous and cancerous lesions by comparing the gene expression of stem-like cells in diseased tissues with normal stem cells |
| Entrez ID | Symbol | Replicates | Species | Organ | Tissue | Adj P-value | Log2FC | Malignancy |
| 388564 | TMEM238 | GSM4909281 | Human | Breast | IDC | 5.63e-05 | -1.68e-01 | 0.21 |
| 388564 | TMEM238 | GSM4909285 | Human | Breast | IDC | 4.24e-05 | -1.64e-01 | 0.21 |
| 388564 | TMEM238 | GSM4909286 | Human | Breast | IDC | 1.27e-03 | -1.59e-01 | 0.1081 |
| 388564 | TMEM238 | GSM4909293 | Human | Breast | IDC | 2.38e-10 | 2.26e-01 | 0.1581 |
| 388564 | TMEM238 | GSM4909296 | Human | Breast | IDC | 1.86e-04 | -1.53e-01 | 0.1524 |
| 388564 | TMEM238 | GSM4909297 | Human | Breast | IDC | 4.39e-04 | -1.64e-01 | 0.1517 |
| 388564 | TMEM238 | GSM4909298 | Human | Breast | IDC | 2.51e-15 | 3.40e-01 | 0.1551 |
| 388564 | TMEM238 | GSM4909301 | Human | Breast | IDC | 2.12e-03 | -1.53e-01 | 0.1577 |
| 388564 | TMEM238 | GSM4909303 | Human | Breast | IDC | 1.26e-12 | 6.50e-01 | 0.0438 |
| 388564 | TMEM238 | GSM4909304 | Human | Breast | IDC | 1.16e-40 | 8.33e-01 | 0.1636 |
| 388564 | TMEM238 | GSM4909306 | Human | Breast | IDC | 4.67e-02 | -1.47e-01 | 0.1564 |
| 388564 | TMEM238 | GSM4909307 | Human | Breast | IDC | 2.73e-02 | -1.49e-01 | 0.1569 |
| 388564 | TMEM238 | GSM4909308 | Human | Breast | IDC | 2.12e-03 | -1.73e-01 | 0.158 |
| 388564 | TMEM238 | GSM4909309 | Human | Breast | IDC | 2.02e-03 | -1.73e-01 | 0.0483 |
| 388564 | TMEM238 | GSM4909311 | Human | Breast | IDC | 4.74e-03 | -1.17e-01 | 0.1534 |
| 388564 | TMEM238 | GSM4909312 | Human | Breast | IDC | 2.15e-05 | -1.55e-01 | 0.1552 |
| 388564 | TMEM238 | GSM4909319 | Human | Breast | IDC | 5.42e-06 | -1.65e-01 | 0.1563 |
| 388564 | TMEM238 | GSM4909321 | Human | Breast | IDC | 4.38e-05 | -1.66e-01 | 0.1559 |
| 388564 | TMEM238 | brca1 | Human | Breast | Precancer | 3.57e-03 | 6.64e-02 | -0.0338 |
| 388564 | TMEM238 | M1 | Human | Breast | IDC | 1.45e-27 | 7.82e-01 | 0.1577 |
| Page: 1 2 3 4 |
| Tissue | Expression Dynamics | Abbreviation |
| Breast | 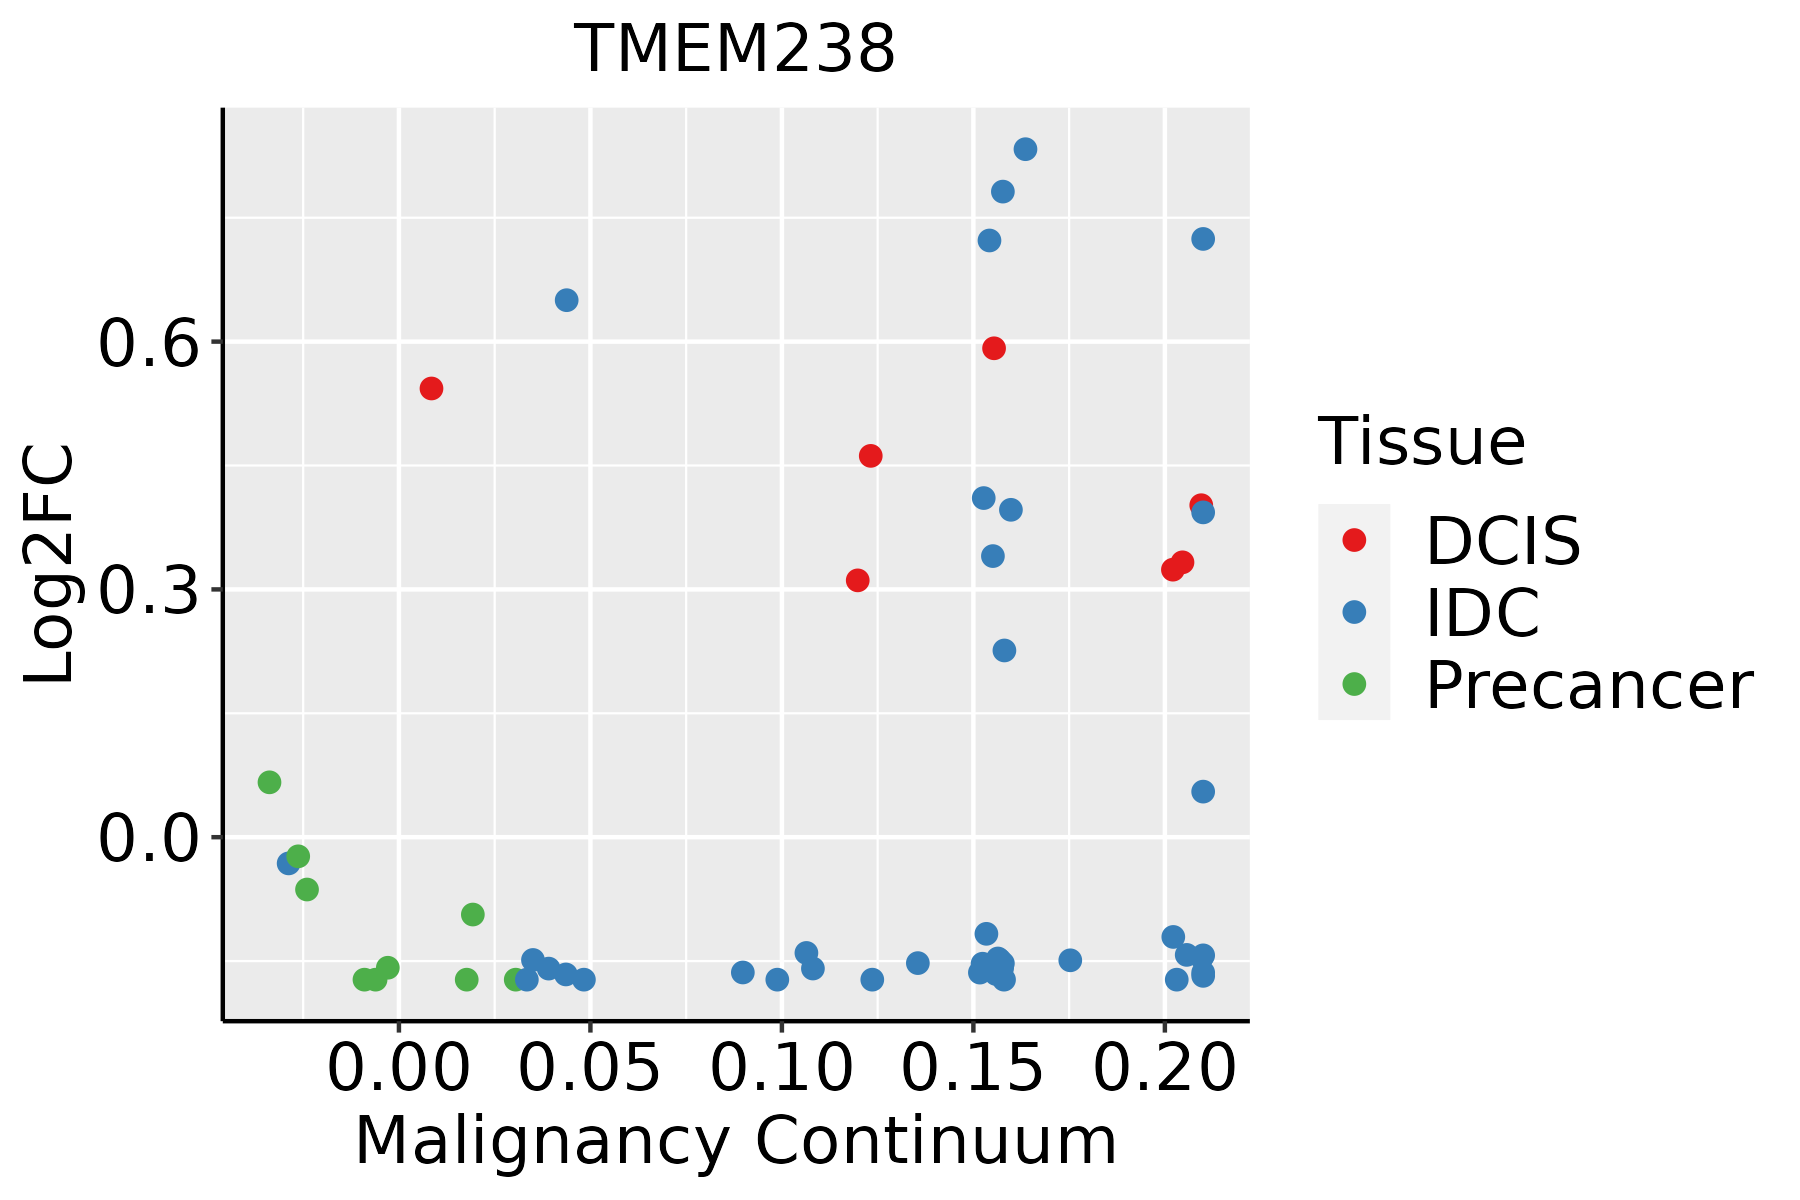 | IDC: Invasive ductal carcinoma |
| DCIS: Ductal carcinoma in situ | ||
| Precancer(BRCA1-mut): Precancerous lesion from BRCA1 mutation carriers | ||
| Colorectum (GSE201348) |  | FAP: Familial adenomatous polyposis |
| CRC: Colorectal cancer | ||
| Colorectum (HTA11) |  | AD: Adenomas |
| SER: Sessile serrated lesions | ||
| MSI-H: Microsatellite-high colorectal cancer | ||
| MSS: Microsatellite stable colorectal cancer | ||
| Oral Cavity | 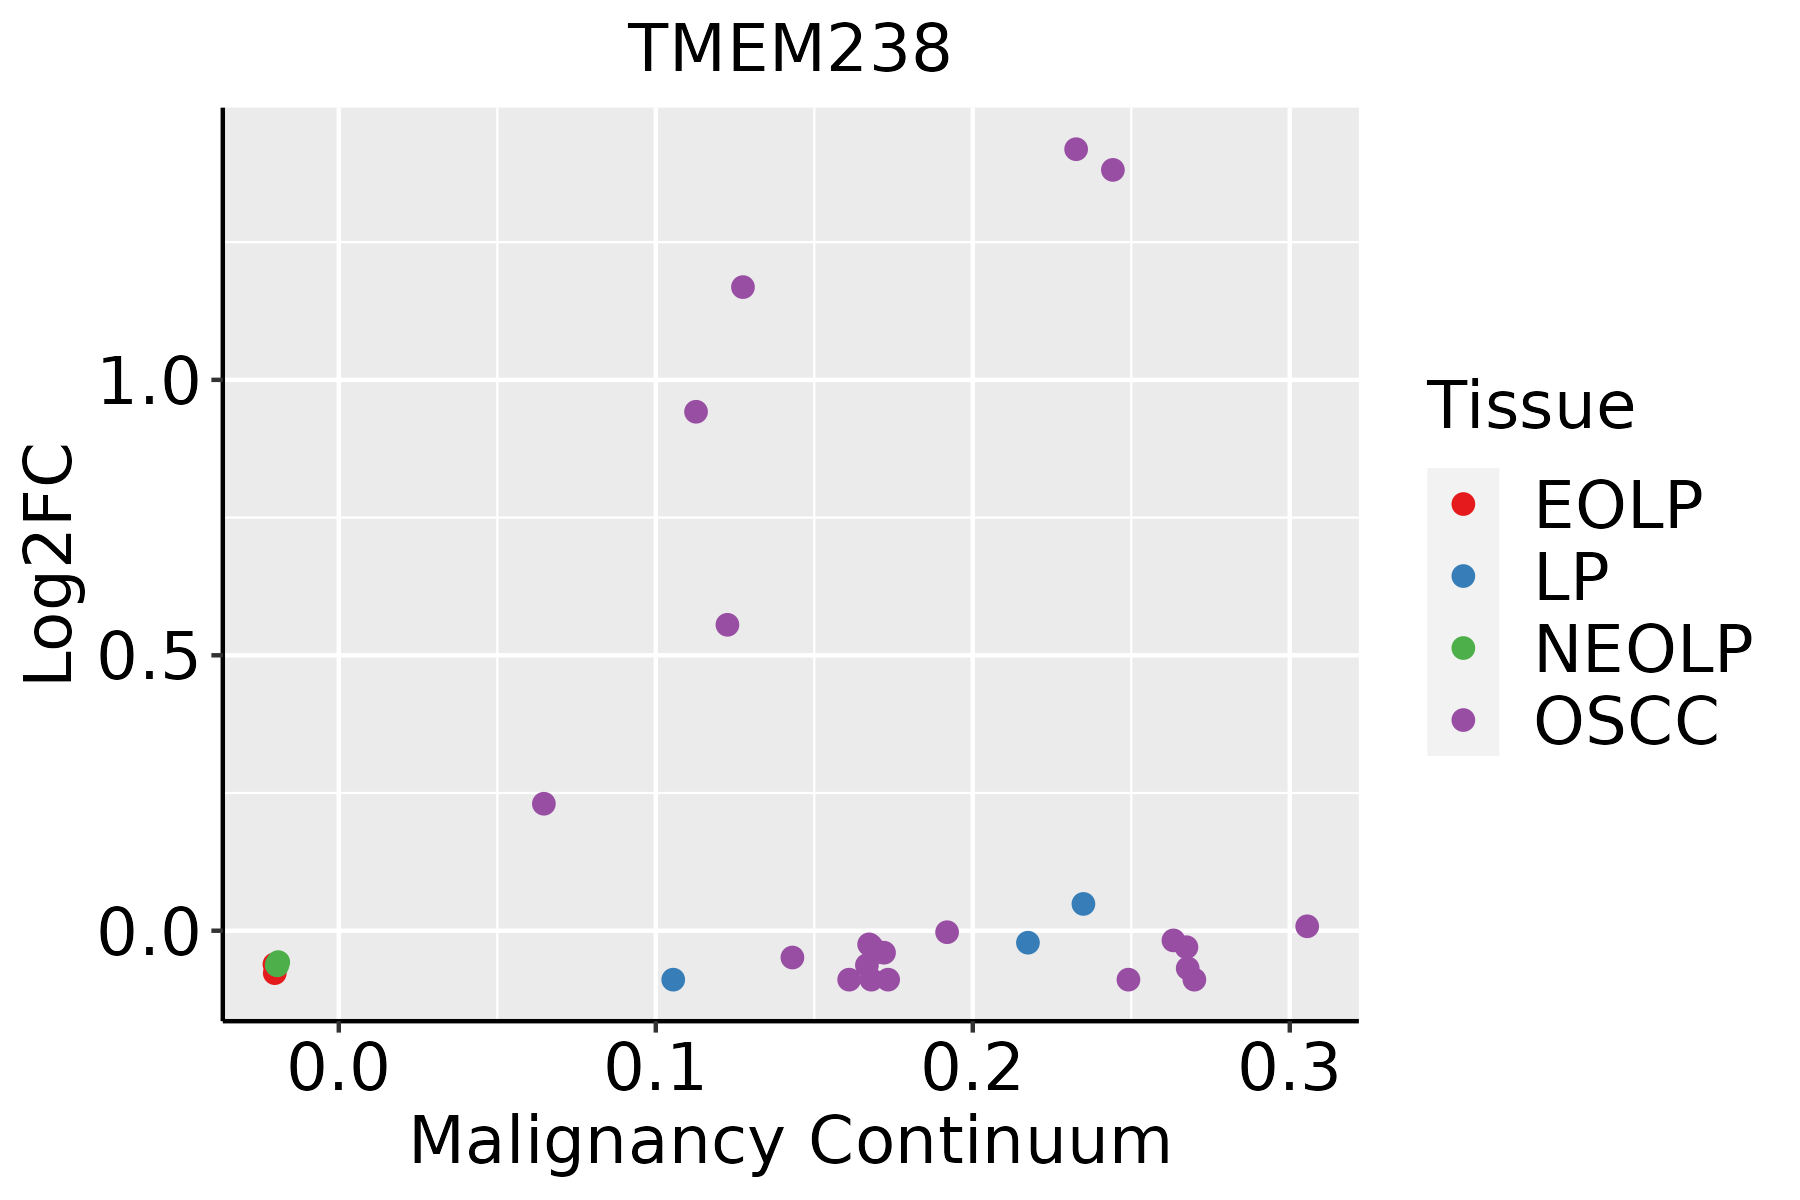 | EOLP: Erosive Oral lichen planus |
| LP: leukoplakia | ||
| NEOLP: Non-erosive oral lichen planus | ||
| OSCC: Oral squamous cell carcinoma | ||
| Prostate |  | BPH: Benign Prostatic Hyperplasia |
| Thyroid | 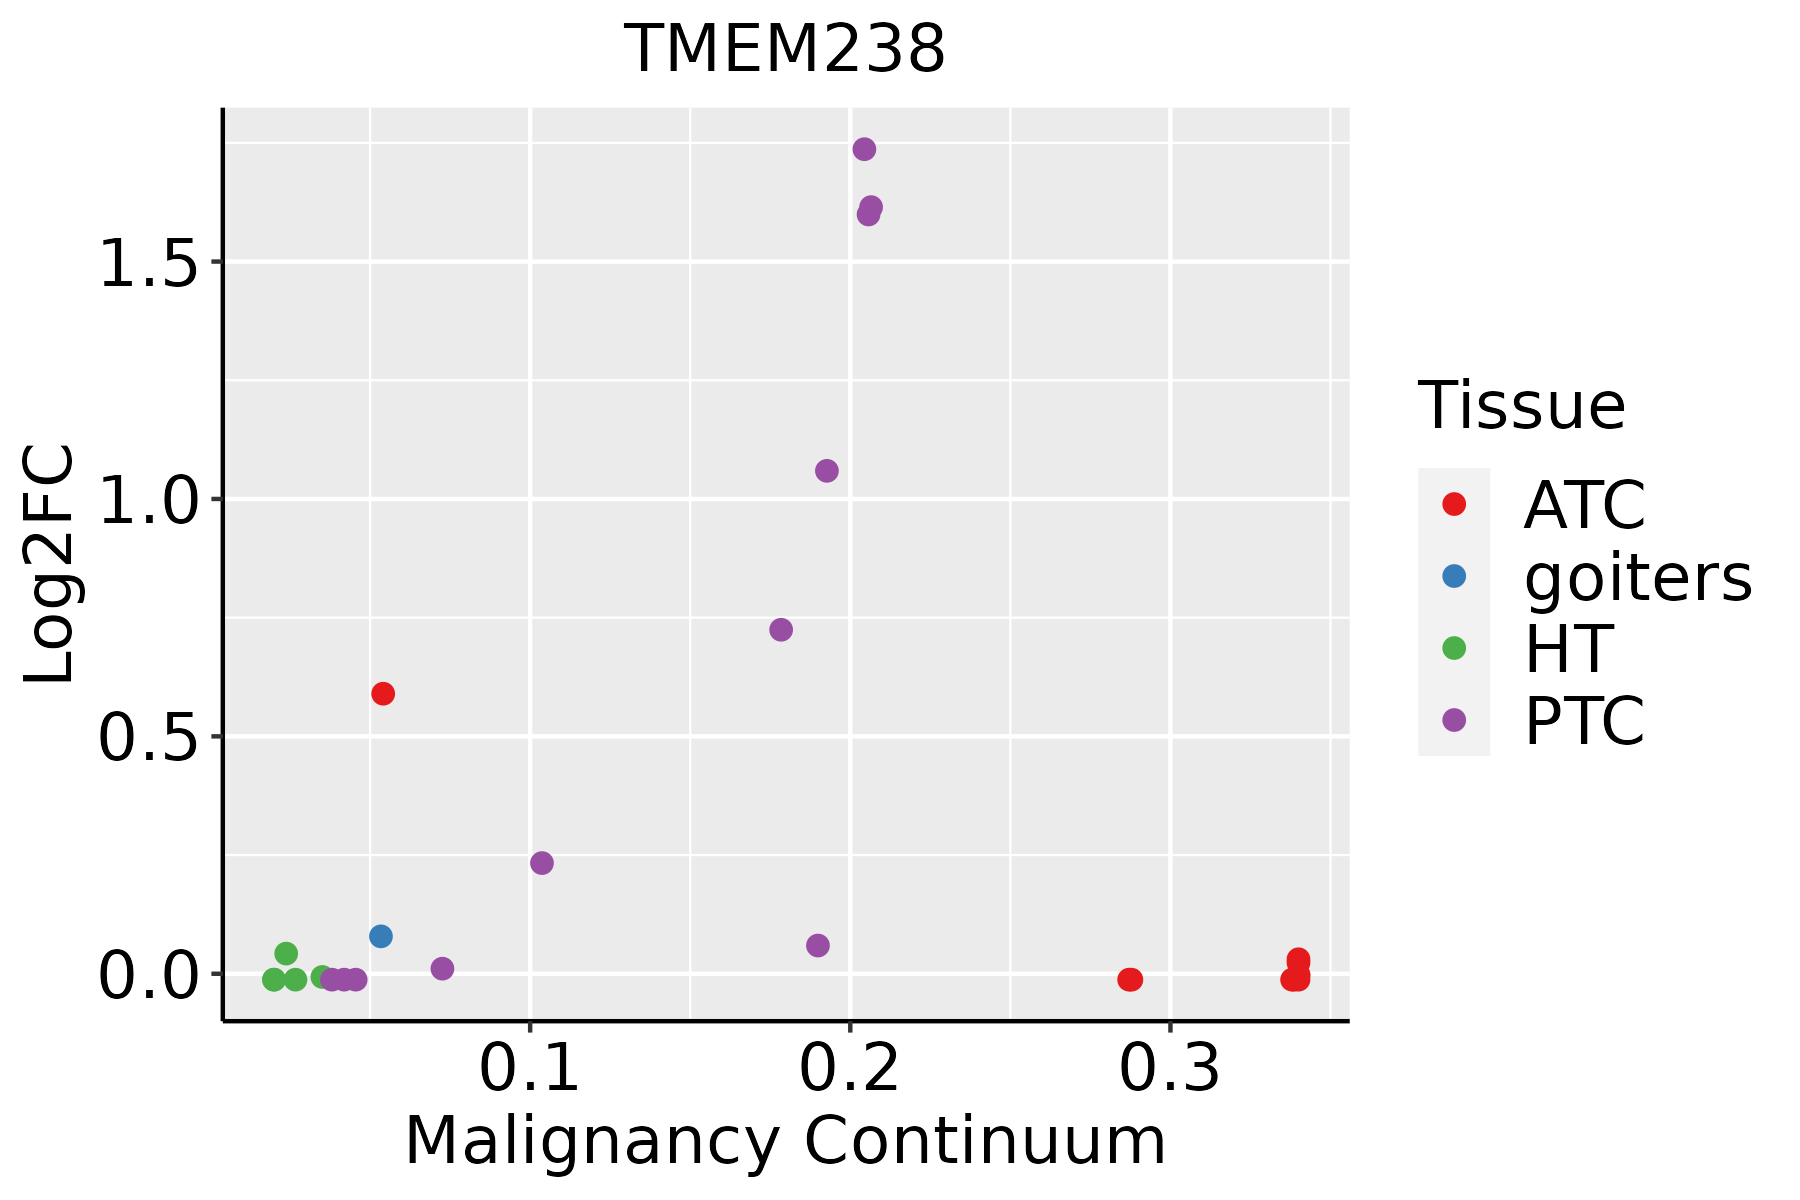 | ATC: Anaplastic thyroid cancer |
| HT: Hashimoto's thyroiditis | ||
| PTC: Papillary thyroid cancer |
| ∗log2FC in expression of this searched gene in stem-like cells from each diseased tissue sample relative to stem-like cells in normal samples in each tissue plotted against the malignancy continuum. Samples are colored based on if they are from different disease stage. |
Top |
Malignant transformation related pathway analysis |
| Find out the enriched GO biological processes and KEGG pathways involved in transition from healthy to precancer to cancer |
| Tissue | Disease Stage | Enriched GO biological Processes |
| Colorectum | AD |  |
| Colorectum | SER |  |
| Colorectum | MSS |  |
| Colorectum | MSI-H |  |
| Colorectum | FAP |  |
| ∗Top 15 enriched GO BP terms are showed in the bar plot of each disease state in each tissue. Each row represents a significant GO biological process which is colored according to the -log10(p.adjust). |
| Page: 1 2 3 4 5 6 7 8 9 |
| GO ID | Tissue | Disease Stage | Description | Gene Ratio | Bg Ratio | pvalue | p.adjust | Count |
| Page: 1 |
| Pathway ID | Tissue | Disease Stage | Description | Gene Ratio | Bg Ratio | pvalue | p.adjust | qvalue | Count |
| Page: 1 |
Top |
Cell-cell communication analysis |
| Identification of potential cell-cell interactions between two cell types and their ligand-receptor pairs for different disease states |
| Ligand | Receptor | LRpair | Pathway | Tissue | Disease Stage |
| Page: 1 |
Top |
Single-cell gene regulatory network inference analysis |
| Find out the significant the regulons (TFs) and the target genes of each regulon across cell types for different disease states |
| TF | Cell Type | Tissue | Disease Stage | Target Gene | RSS | Regulon Activity |
| ∗The dot plots of a searched regulon are shown for all cell subpopulations in each disease state of each tissue based on the regulon specific score inferred using pySCENIC and by calculating the average expression. |
| Page: 1 |
Top |
Somatic mutation of malignant transformation related genes |
| Annotation of somatic variants for genes involved in malignant transformation |
| Hugo Symbol | Variant Class | Variant Classification | dbSNP RS | HGVSc | HGVSp | HGVSp Short | SWISSPROT | BIOTYPE | SIFT | PolyPhen | Tumor Sample Barcode | Tissue | Histology | Sex | Age | Stage | Therapy Types | Drugs | Outcome |
| Page: 1 |
Top |
Related drugs of malignant transformation related genes |
| Identification of chemicals and drugs interact with genes involved in malignant transfromation |
| (DGIdb 4.0) |
| Entrez ID | Symbol | Category | Interaction Types | Drug Claim Name | Drug Name | PMIDs |
| Page: 1 |

Copyright 2023-Present -The University of Texas Health Science Center at Houston |