
|
|||||
|
 | |
| |
| |
| |
| |
| |
|
Gene: TMEM230 |
Gene summary for TMEM230 |
| Gene information | Species | Human | Gene symbol | TMEM230 | Gene ID | 29058 |
| Gene name | transmembrane protein 230 | |
| Gene Alias | C20orf30 | |
| Cytomap | 20p13-p12.3 | |
| Gene Type | protein-coding | GO ID | GO:0006810 | UniProtAcc | Q96A57 |
Top |
Malignant transformation analysis |
| Identification of the aberrant gene expression in precancerous and cancerous lesions by comparing the gene expression of stem-like cells in diseased tissues with normal stem cells |
| Entrez ID | Symbol | Replicates | Species | Organ | Tissue | Adj P-value | Log2FC | Malignancy |
| 29058 | TMEM230 | AEH-subject1 | Human | Endometrium | AEH | 4.46e-27 | -5.83e-01 | -0.3059 |
| 29058 | TMEM230 | AEH-subject2 | Human | Endometrium | AEH | 5.55e-17 | -4.10e-01 | -0.2525 |
| 29058 | TMEM230 | AEH-subject3 | Human | Endometrium | AEH | 3.70e-20 | -4.21e-01 | -0.2576 |
| 29058 | TMEM230 | AEH-subject4 | Human | Endometrium | AEH | 1.51e-19 | -5.49e-01 | -0.2657 |
| 29058 | TMEM230 | AEH-subject5 | Human | Endometrium | AEH | 1.70e-19 | -5.51e-01 | -0.2953 |
| 29058 | TMEM230 | EEC-subject1 | Human | Endometrium | EEC | 4.02e-24 | -5.42e-01 | -0.2682 |
| 29058 | TMEM230 | EEC-subject2 | Human | Endometrium | EEC | 1.04e-36 | -6.48e-01 | -0.2607 |
| 29058 | TMEM230 | EEC-subject3 | Human | Endometrium | EEC | 4.85e-48 | -6.12e-01 | -0.2525 |
| 29058 | TMEM230 | EEC-subject4 | Human | Endometrium | EEC | 4.19e-11 | -4.21e-01 | -0.2571 |
| 29058 | TMEM230 | EEC-subject5 | Human | Endometrium | EEC | 3.83e-14 | -4.24e-01 | -0.249 |
| 29058 | TMEM230 | GSM5276934 | Human | Endometrium | EEC | 2.59e-12 | -4.51e-01 | -0.0913 |
| 29058 | TMEM230 | GSM5276937 | Human | Endometrium | EEC | 6.76e-10 | -4.19e-01 | -0.0897 |
| 29058 | TMEM230 | GSM6177620_NYU_UCEC1_lib1_lib1 | Human | Endometrium | EEC | 1.08e-37 | -5.29e-01 | -0.1869 |
| 29058 | TMEM230 | GSM6177620_NYU_UCEC1_lib2_lib2 | Human | Endometrium | EEC | 5.11e-36 | -5.91e-01 | -0.1875 |
| 29058 | TMEM230 | GSM6177620_NYU_UCEC1_lib3_lib3 | Human | Endometrium | EEC | 4.33e-41 | -5.34e-01 | -0.1883 |
| 29058 | TMEM230 | GSM6177621_NYU_UCEC2_lib1_lib1 | Human | Endometrium | EEC | 4.42e-50 | -5.76e-01 | -0.1934 |
| 29058 | TMEM230 | GSM6177622_NYU_UCEC3_lib1_lib1 | Human | Endometrium | EEC | 5.44e-60 | -5.25e-01 | -0.1917 |
| 29058 | TMEM230 | GSM6177622_NYU_UCEC3_lib2_lib2 | Human | Endometrium | EEC | 7.37e-50 | -5.80e-01 | -0.1916 |
| 29058 | TMEM230 | GSM6177623_NYU_UCEC3_Vis | Human | Endometrium | EEC | 4.89e-09 | -2.47e-01 | -0.1269 |
| 29058 | TMEM230 | LZE4T | Human | Esophagus | ESCC | 1.63e-26 | 1.12e+00 | 0.0811 |
| Page: 1 2 3 4 5 6 7 8 |
| Tissue | Expression Dynamics | Abbreviation |
| Endometrium |  | AEH: Atypical endometrial hyperplasia |
| EEC: Endometrioid Cancer | ||
| Esophagus | 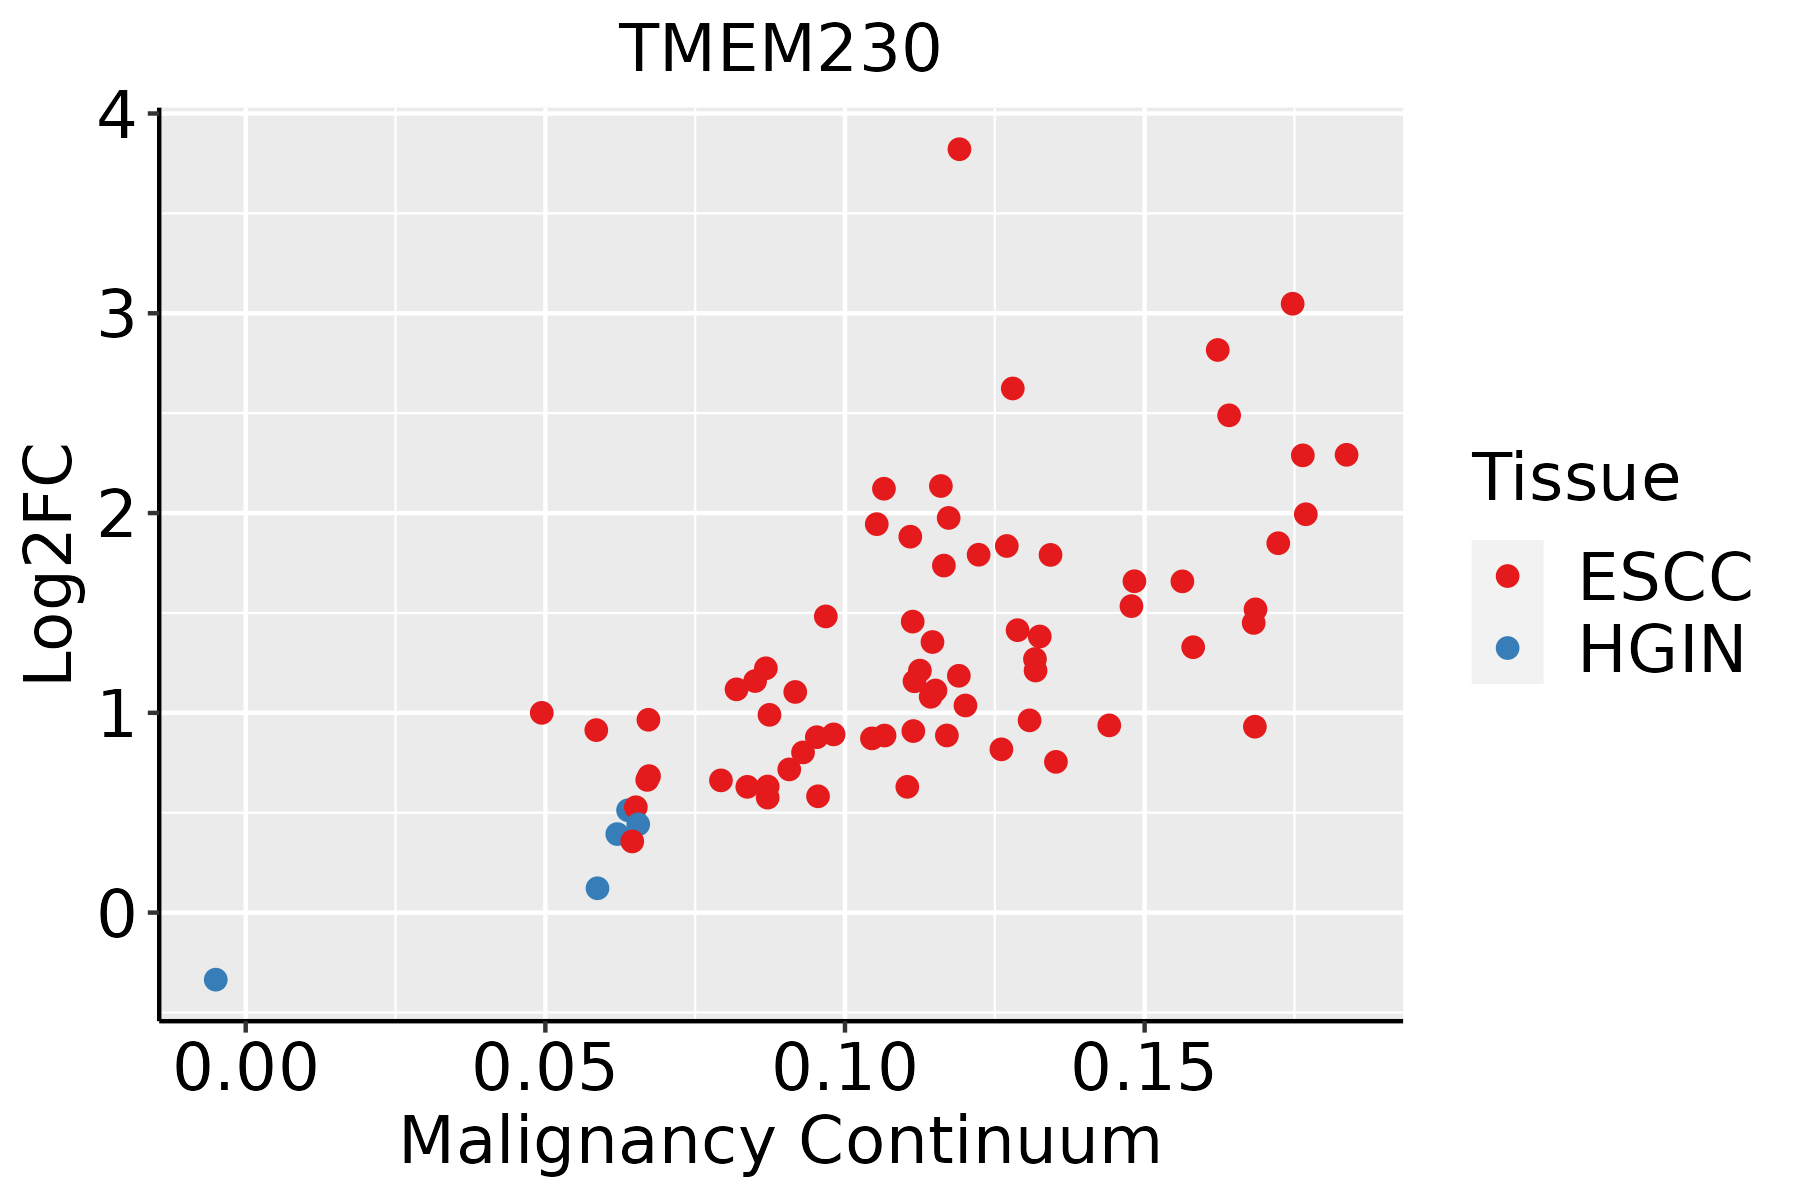 | ESCC: Esophageal squamous cell carcinoma |
| HGIN: High-grade intraepithelial neoplasias | ||
| LGIN: Low-grade intraepithelial neoplasias | ||
| Liver | 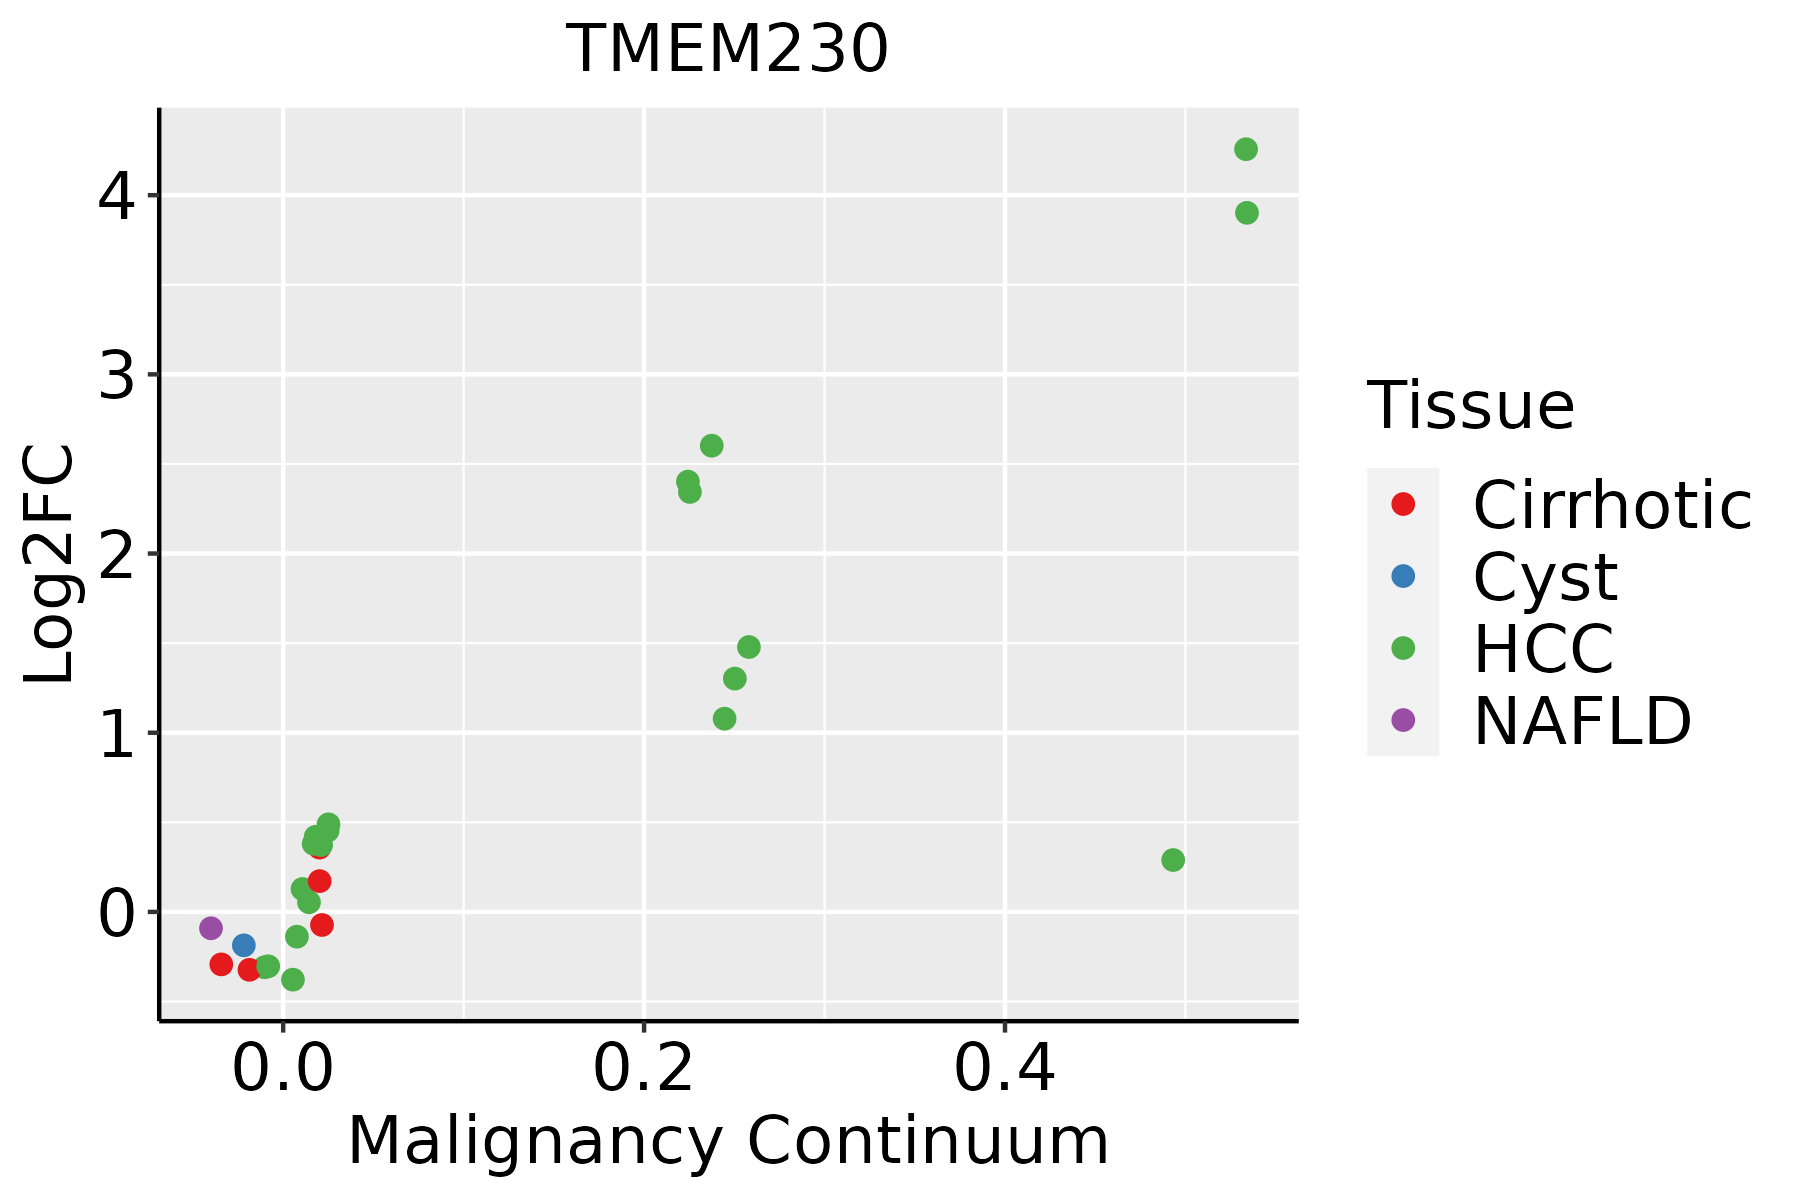 | HCC: Hepatocellular carcinoma |
| NAFLD: Non-alcoholic fatty liver disease | ||
| Oral Cavity | 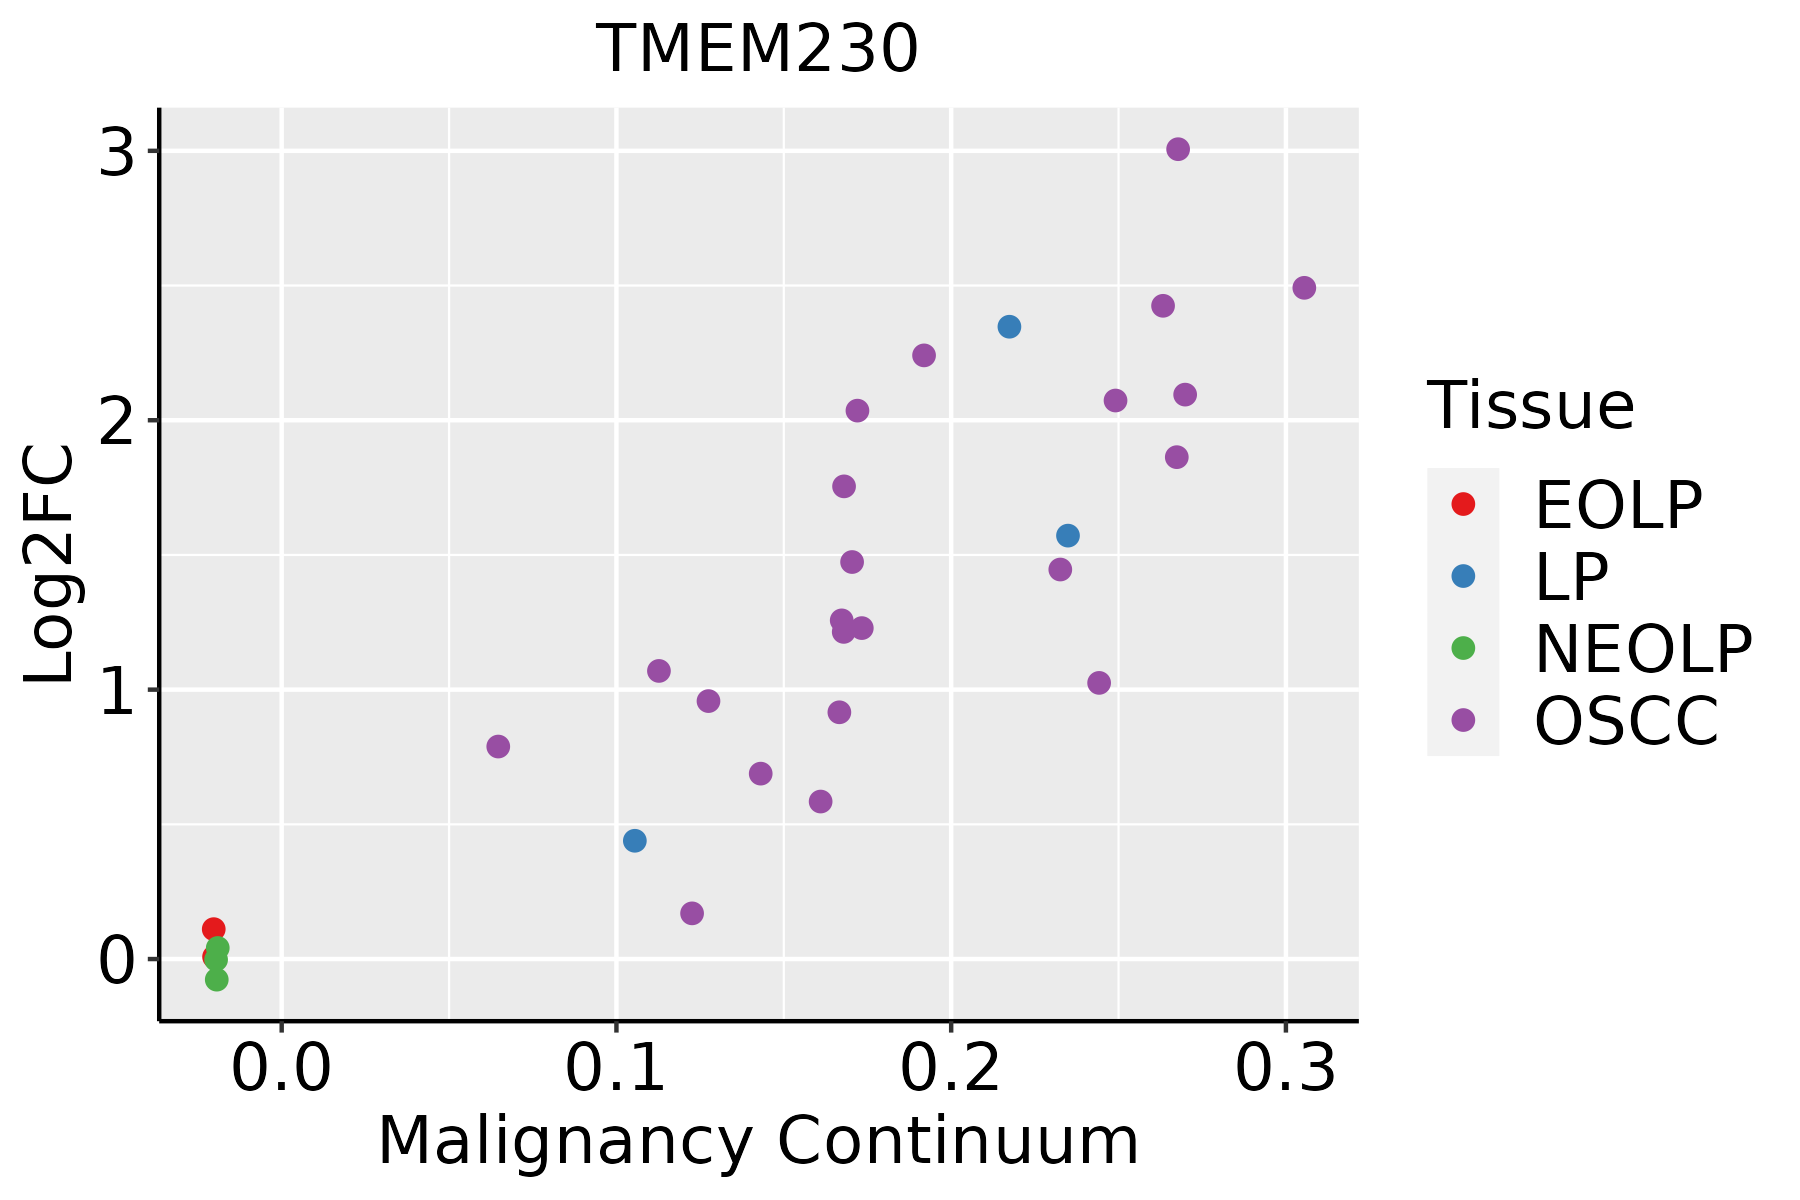 | EOLP: Erosive Oral lichen planus |
| LP: leukoplakia | ||
| NEOLP: Non-erosive oral lichen planus | ||
| OSCC: Oral squamous cell carcinoma | ||
| Prostate |  | BPH: Benign Prostatic Hyperplasia |
| Skin | 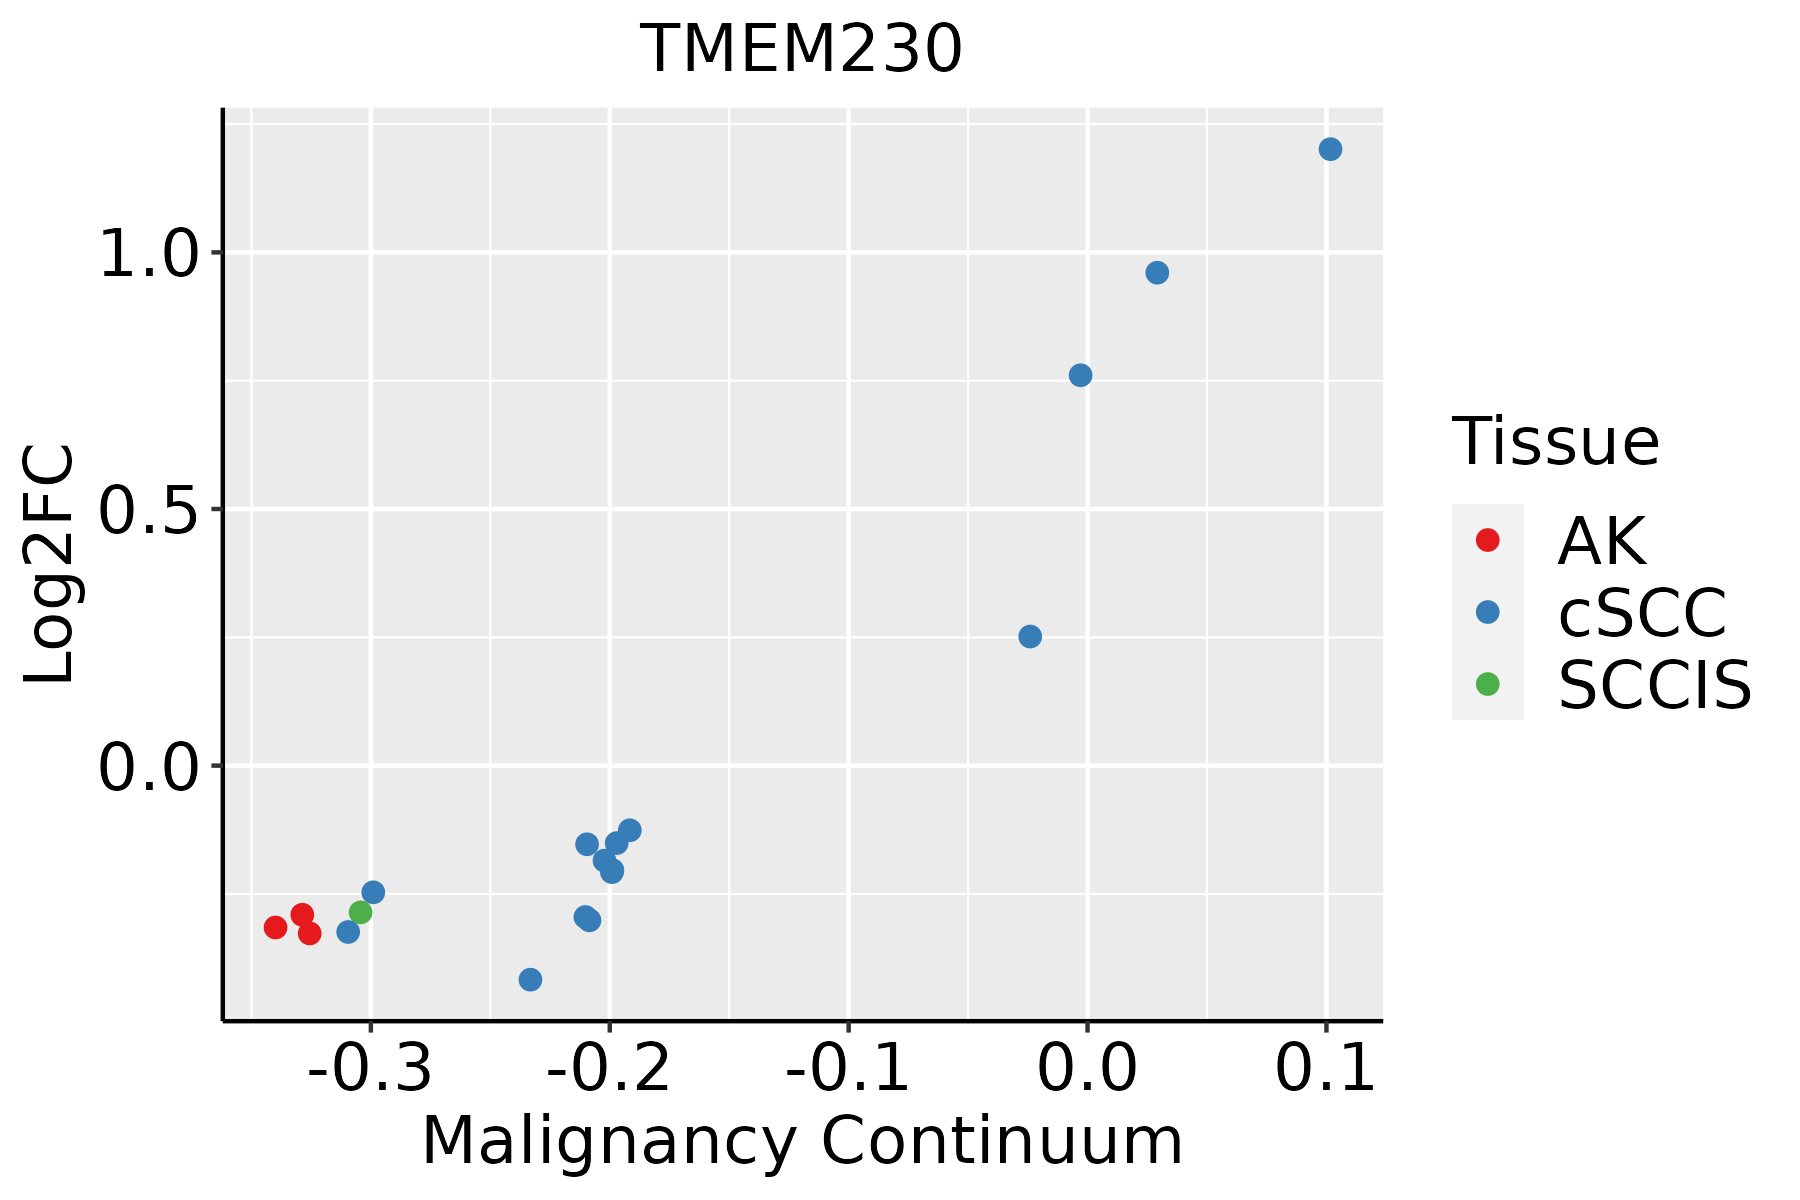 | AK: Actinic keratosis |
| cSCC: Cutaneous squamous cell carcinoma | ||
| SCCIS:squamous cell carcinoma in situ | ||
| Thyroid | 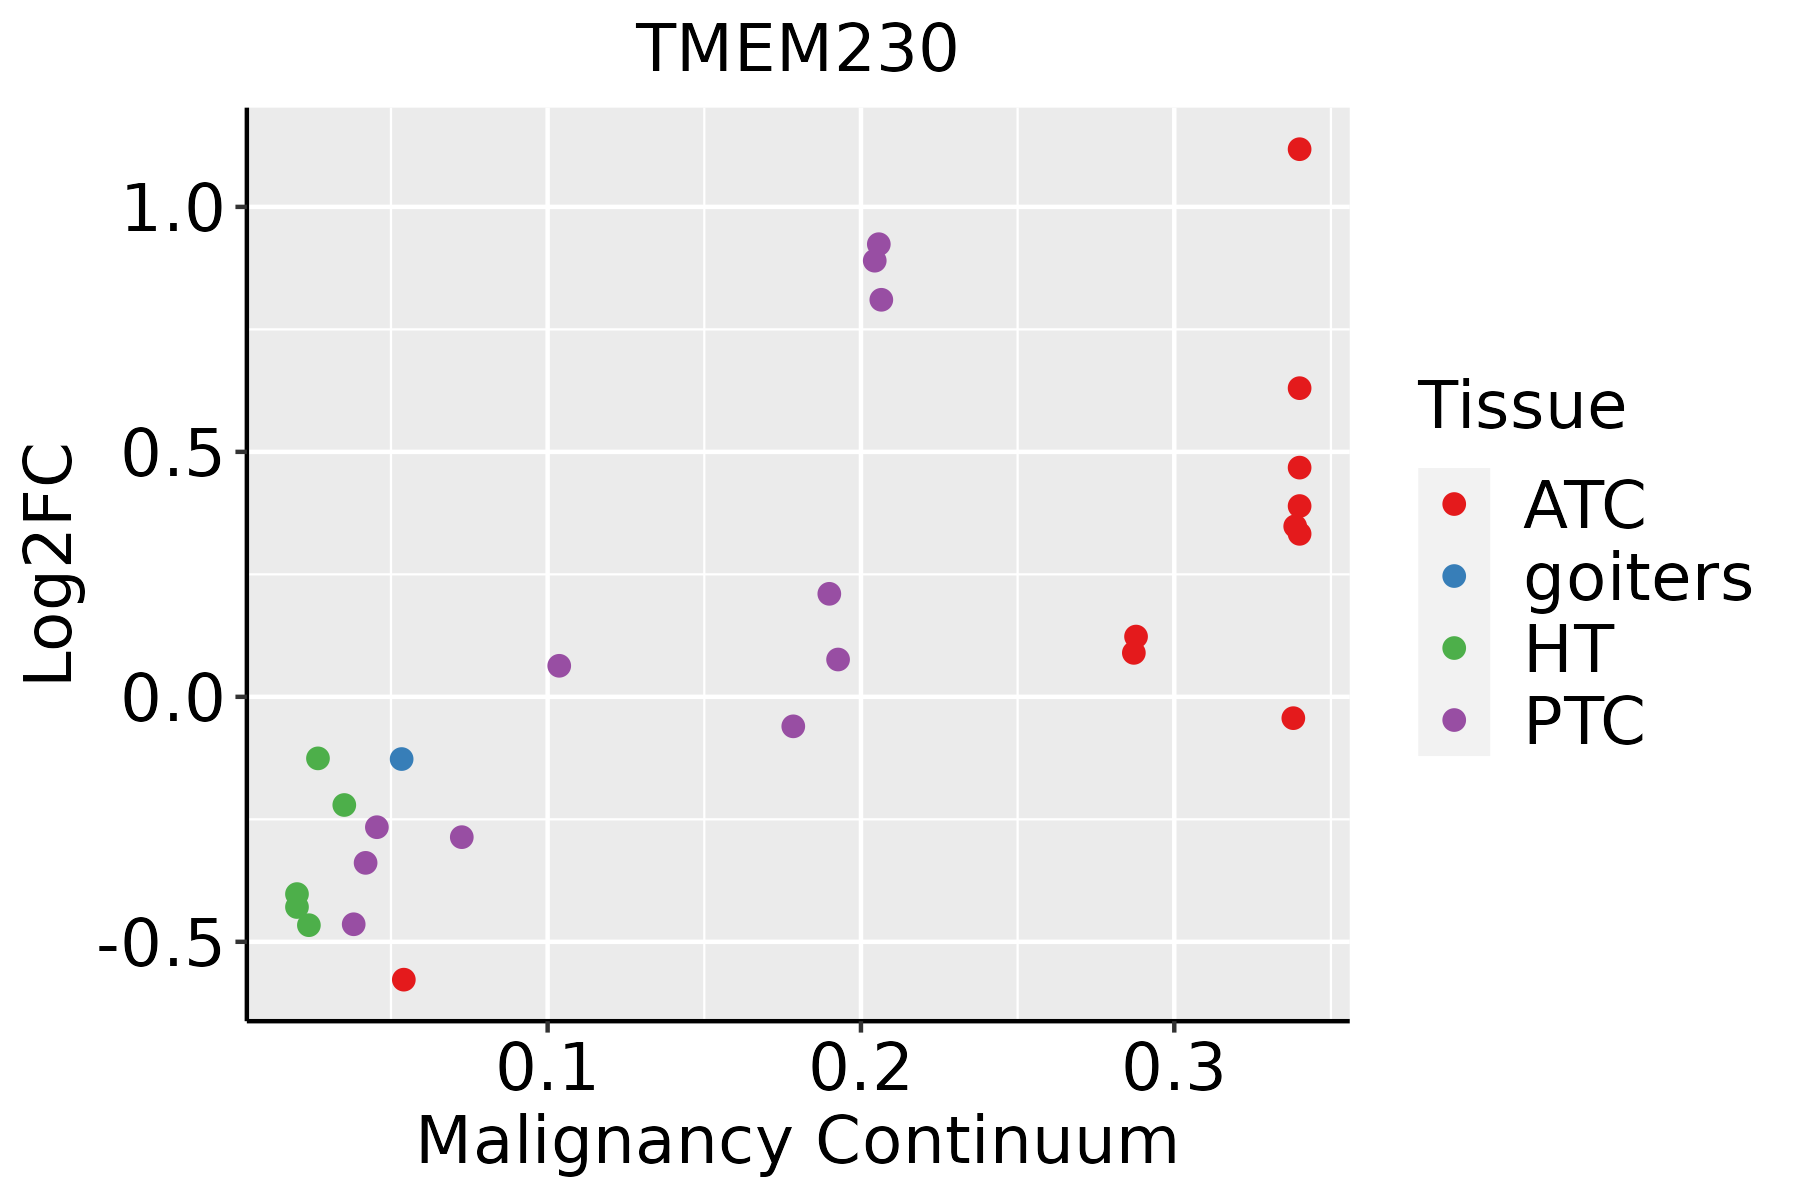 | ATC: Anaplastic thyroid cancer |
| HT: Hashimoto's thyroiditis | ||
| PTC: Papillary thyroid cancer |
| ∗log2FC in expression of this searched gene in stem-like cells from each diseased tissue sample relative to stem-like cells in normal samples in each tissue plotted against the malignancy continuum. Samples are colored based on if they are from different disease stage. |
Top |
Malignant transformation related pathway analysis |
| Find out the enriched GO biological processes and KEGG pathways involved in transition from healthy to precancer to cancer |
| Tissue | Disease Stage | Enriched GO biological Processes |
| Colorectum | AD |  |
| Colorectum | SER |  |
| Colorectum | MSS |  |
| Colorectum | MSI-H |  |
| Colorectum | FAP |  |
| ∗Top 15 enriched GO BP terms are showed in the bar plot of each disease state in each tissue. Each row represents a significant GO biological process which is colored according to the -log10(p.adjust). |
| Page: 1 2 3 4 5 6 7 8 9 |
| GO ID | Tissue | Disease Stage | Description | Gene Ratio | Bg Ratio | pvalue | p.adjust | Count |
| GO:00516568 | Endometrium | AEH | establishment of organelle localization | 77/2100 | 390/18723 | 4.89e-07 | 1.94e-05 | 77 |
| GO:00516507 | Endometrium | AEH | establishment of vesicle localization | 32/2100 | 161/18723 | 8.99e-04 | 8.24e-03 | 32 |
| GO:00516487 | Endometrium | AEH | vesicle localization | 32/2100 | 177/18723 | 4.33e-03 | 2.86e-02 | 32 |
| GO:00484891 | Endometrium | AEH | synaptic vesicle transport | 11/2100 | 42/18723 | 5.45e-03 | 3.37e-02 | 11 |
| GO:005165613 | Endometrium | EEC | establishment of organelle localization | 75/2168 | 390/18723 | 6.23e-06 | 1.49e-04 | 75 |
| GO:005165013 | Endometrium | EEC | establishment of vesicle localization | 31/2168 | 161/18723 | 2.99e-03 | 2.10e-02 | 31 |
| GO:005165617 | Esophagus | ESCC | establishment of organelle localization | 273/8552 | 390/18723 | 9.13e-23 | 1.81e-20 | 273 |
| GO:005165016 | Esophagus | ESCC | establishment of vesicle localization | 114/8552 | 161/18723 | 8.20e-11 | 2.53e-09 | 114 |
| GO:005164815 | Esophagus | ESCC | vesicle localization | 119/8552 | 177/18723 | 5.16e-09 | 1.08e-07 | 119 |
| GO:00484892 | Esophagus | ESCC | synaptic vesicle transport | 28/8552 | 42/18723 | 4.90e-03 | 1.89e-02 | 28 |
| GO:005165611 | Liver | Cirrhotic | establishment of organelle localization | 128/4634 | 390/18723 | 1.78e-04 | 1.67e-03 | 128 |
| GO:005165011 | Liver | Cirrhotic | establishment of vesicle localization | 58/4634 | 161/18723 | 8.98e-04 | 6.44e-03 | 58 |
| GO:005164811 | Liver | Cirrhotic | vesicle localization | 62/4634 | 177/18723 | 1.37e-03 | 9.18e-03 | 62 |
| GO:005165621 | Liver | HCC | establishment of organelle localization | 226/7958 | 390/18723 | 4.15e-10 | 1.34e-08 | 226 |
| GO:005165021 | Liver | HCC | establishment of vesicle localization | 103/7958 | 161/18723 | 2.94e-08 | 6.69e-07 | 103 |
| GO:005164821 | Liver | HCC | vesicle localization | 107/7958 | 177/18723 | 1.05e-06 | 1.57e-05 | 107 |
| GO:0048489 | Liver | HCC | synaptic vesicle transport | 27/7958 | 42/18723 | 3.60e-03 | 1.60e-02 | 27 |
| GO:005165610 | Oral cavity | OSCC | establishment of organelle localization | 239/7305 | 390/18723 | 2.46e-19 | 3.31e-17 | 239 |
| GO:00516509 | Oral cavity | OSCC | establishment of vesicle localization | 101/7305 | 161/18723 | 8.79e-10 | 2.17e-08 | 101 |
| GO:00516489 | Oral cavity | OSCC | vesicle localization | 105/7305 | 177/18723 | 3.30e-08 | 6.30e-07 | 105 |
| Page: 1 2 |
| Pathway ID | Tissue | Disease Stage | Description | Gene Ratio | Bg Ratio | pvalue | p.adjust | qvalue | Count |
| Page: 1 |
Top |
Cell-cell communication analysis |
| Identification of potential cell-cell interactions between two cell types and their ligand-receptor pairs for different disease states |
| Ligand | Receptor | LRpair | Pathway | Tissue | Disease Stage |
| Page: 1 |
Top |
Single-cell gene regulatory network inference analysis |
| Find out the significant the regulons (TFs) and the target genes of each regulon across cell types for different disease states |
| TF | Cell Type | Tissue | Disease Stage | Target Gene | RSS | Regulon Activity |
| ∗The dot plots of a searched regulon are shown for all cell subpopulations in each disease state of each tissue based on the regulon specific score inferred using pySCENIC and by calculating the average expression. |
| Page: 1 |
Top |
Somatic mutation of malignant transformation related genes |
| Annotation of somatic variants for genes involved in malignant transformation |
| Hugo Symbol | Variant Class | Variant Classification | dbSNP RS | HGVSc | HGVSp | HGVSp Short | SWISSPROT | BIOTYPE | SIFT | PolyPhen | Tumor Sample Barcode | Tissue | Histology | Sex | Age | Stage | Therapy Types | Drugs | Outcome |
| TMEM230 | SNV | Missense_Mutation | rs779508042 | c.197N>T | p.Pro66Leu | p.P66L | Q96A57 | protein_coding | tolerated(0.06) | benign(0.086) | TCGA-AN-A0AK-01 | Breast | breast invasive carcinoma | Female | >=65 | I/II | Unknown | Unknown | SD |
| TMEM230 | SNV | Missense_Mutation | novel | c.418G>A | p.Asp140Asn | p.D140N | Q96A57 | protein_coding | tolerated(0.11) | benign(0.038) | TCGA-VS-A959-01 | Cervix | cervical & endocervical cancer | Female | >=65 | I/II | Unknown | Unknown | SD |
| TMEM230 | SNV | Missense_Mutation | rs145815993 | c.184N>T | p.Arg62Cys | p.R62C | Q96A57 | protein_coding | deleterious(0) | benign(0) | TCGA-AA-3949-01 | Colorectum | colon adenocarcinoma | Female | >=65 | III/IV | Unknown | Unknown | SD |
| TMEM230 | SNV | Missense_Mutation | novel | c.245N>G | p.Tyr82Cys | p.Y82C | Q96A57 | protein_coding | deleterious(0) | probably_damaging(0.999) | TCGA-AA-3950-01 | Colorectum | colon adenocarcinoma | Female | >=65 | I/II | Unknown | Unknown | SD |
| TMEM230 | SNV | Missense_Mutation | c.304N>T | p.Pro102Ser | p.P102S | Q96A57 | protein_coding | tolerated(0.17) | benign(0.142) | TCGA-A5-A1OF-01 | Endometrium | uterine corpus endometrioid carcinoma | Female | <65 | I/II | Unknown | Unknown | SD | |
| TMEM230 | SNV | Missense_Mutation | rs780164928 | c.358G>A | p.Ala120Thr | p.A120T | Q96A57 | protein_coding | tolerated(1) | benign(0.015) | TCGA-AP-A059-01 | Endometrium | uterine corpus endometrioid carcinoma | Female | >=65 | I/II | Unknown | Unknown | SD |
| TMEM230 | SNV | Missense_Mutation | rs780164928 | c.358N>A | p.Ala120Thr | p.A120T | Q96A57 | protein_coding | tolerated(1) | benign(0.015) | TCGA-AP-A0LM-01 | Endometrium | uterine corpus endometrioid carcinoma | Female | <65 | III/IV | Chemotherapy | cisplatin | SD |
| TMEM230 | SNV | Missense_Mutation | rs761361465 | c.268N>A | p.Asp90Asn | p.D90N | Q96A57 | protein_coding | tolerated(0.24) | probably_damaging(0.917) | TCGA-EY-A1GD-01 | Endometrium | uterine corpus endometrioid carcinoma | Female | <65 | I/II | Unknown | Unknown | SD |
| TMEM230 | SNV | Missense_Mutation | c.427N>T | p.Val143Phe | p.V143F | Q96A57 | protein_coding | tolerated(0.72) | benign(0.027) | TCGA-05-4432-01 | Lung | lung adenocarcinoma | Male | >=65 | I/II | Chemotherapy | cisplatin | CR | |
| TMEM230 | SNV | Missense_Mutation | novel | c.257C>G | p.Ser86Cys | p.S86C | Q96A57 | protein_coding | deleterious(0.01) | possibly_damaging(0.871) | TCGA-52-7810-01 | Lung | lung squamous cell carcinoma | Female | <65 | I/II | Unknown | Unknown | SD |
| Page: 1 2 |
Top |
Related drugs of malignant transformation related genes |
| Identification of chemicals and drugs interact with genes involved in malignant transfromation |
| (DGIdb 4.0) |
| Entrez ID | Symbol | Category | Interaction Types | Drug Claim Name | Drug Name | PMIDs |
| Page: 1 |

Copyright 2023-Present -The University of Texas Health Science Center at Houston |