
|
|||||
|
 | |
| |
| |
| |
| |
| |
|
Gene: TMEM220 |
Gene summary for TMEM220 |
| Gene information | Species | Human | Gene symbol | TMEM220 | Gene ID | 388335 |
| Gene name | transmembrane protein 220 | |
| Gene Alias | TMEM220 | |
| Cytomap | 17p13.1 | |
| Gene Type | protein-coding | GO ID | GO:0005575 | UniProtAcc | Q6QAJ8 |
Top |
Malignant transformation analysis |
| Identification of the aberrant gene expression in precancerous and cancerous lesions by comparing the gene expression of stem-like cells in diseased tissues with normal stem cells |
| Entrez ID | Symbol | Replicates | Species | Organ | Tissue | Adj P-value | Log2FC | Malignancy |
| 388335 | TMEM220 | HTA11_347_2000001011 | Human | Colorectum | AD | 7.37e-09 | 3.22e-01 | -0.1954 |
| 388335 | TMEM220 | HTA11_2112_2000001011 | Human | Colorectum | SER | 4.01e-03 | 4.10e-01 | -0.2196 |
| 388335 | TMEM220 | HTA11_83_2000001011 | Human | Colorectum | SER | 2.82e-04 | 3.64e-01 | -0.1526 |
| 388335 | TMEM220 | HTA11_4255_2000001011 | Human | Colorectum | SER | 3.83e-02 | 2.39e-01 | 0.0446 |
| 388335 | TMEM220 | A002-C-116 | Human | Colorectum | FAP | 3.61e-02 | -1.17e-01 | -0.0452 |
| 388335 | TMEM220 | LZE22D1 | Human | Esophagus | HGIN | 2.61e-05 | 1.74e-01 | 0.0595 |
| 388335 | TMEM220 | P1T-E | Human | Esophagus | ESCC | 3.14e-06 | 2.14e-01 | 0.0875 |
| 388335 | TMEM220 | P2T-E | Human | Esophagus | ESCC | 3.81e-23 | 3.90e-01 | 0.1177 |
| 388335 | TMEM220 | P4T-E | Human | Esophagus | ESCC | 2.35e-02 | 1.44e-01 | 0.1323 |
| 388335 | TMEM220 | P9T-E | Human | Esophagus | ESCC | 7.33e-08 | 2.26e-01 | 0.1131 |
| 388335 | TMEM220 | P11T-E | Human | Esophagus | ESCC | 4.19e-09 | 2.20e-01 | 0.1426 |
| 388335 | TMEM220 | P16T-E | Human | Esophagus | ESCC | 1.17e-38 | 6.62e-01 | 0.1153 |
| 388335 | TMEM220 | P17T-E | Human | Esophagus | ESCC | 5.37e-03 | 1.61e-01 | 0.1278 |
| 388335 | TMEM220 | P19T-E | Human | Esophagus | ESCC | 3.80e-09 | 3.30e-01 | 0.1662 |
| 388335 | TMEM220 | P21T-E | Human | Esophagus | ESCC | 6.43e-07 | 8.58e-02 | 0.1617 |
| 388335 | TMEM220 | P23T-E | Human | Esophagus | ESCC | 8.27e-12 | 2.24e-01 | 0.108 |
| 388335 | TMEM220 | P24T-E | Human | Esophagus | ESCC | 1.54e-04 | 1.01e-01 | 0.1287 |
| 388335 | TMEM220 | P27T-E | Human | Esophagus | ESCC | 3.27e-02 | 1.05e-01 | 0.1055 |
| 388335 | TMEM220 | P32T-E | Human | Esophagus | ESCC | 3.85e-07 | 9.71e-02 | 0.1666 |
| 388335 | TMEM220 | P36T-E | Human | Esophagus | ESCC | 1.73e-03 | 1.82e-01 | 0.1187 |
| Page: 1 2 3 |
| Tissue | Expression Dynamics | Abbreviation |
| Colorectum (GSE201348) |  | FAP: Familial adenomatous polyposis |
| CRC: Colorectal cancer | ||
| Colorectum (HTA11) | 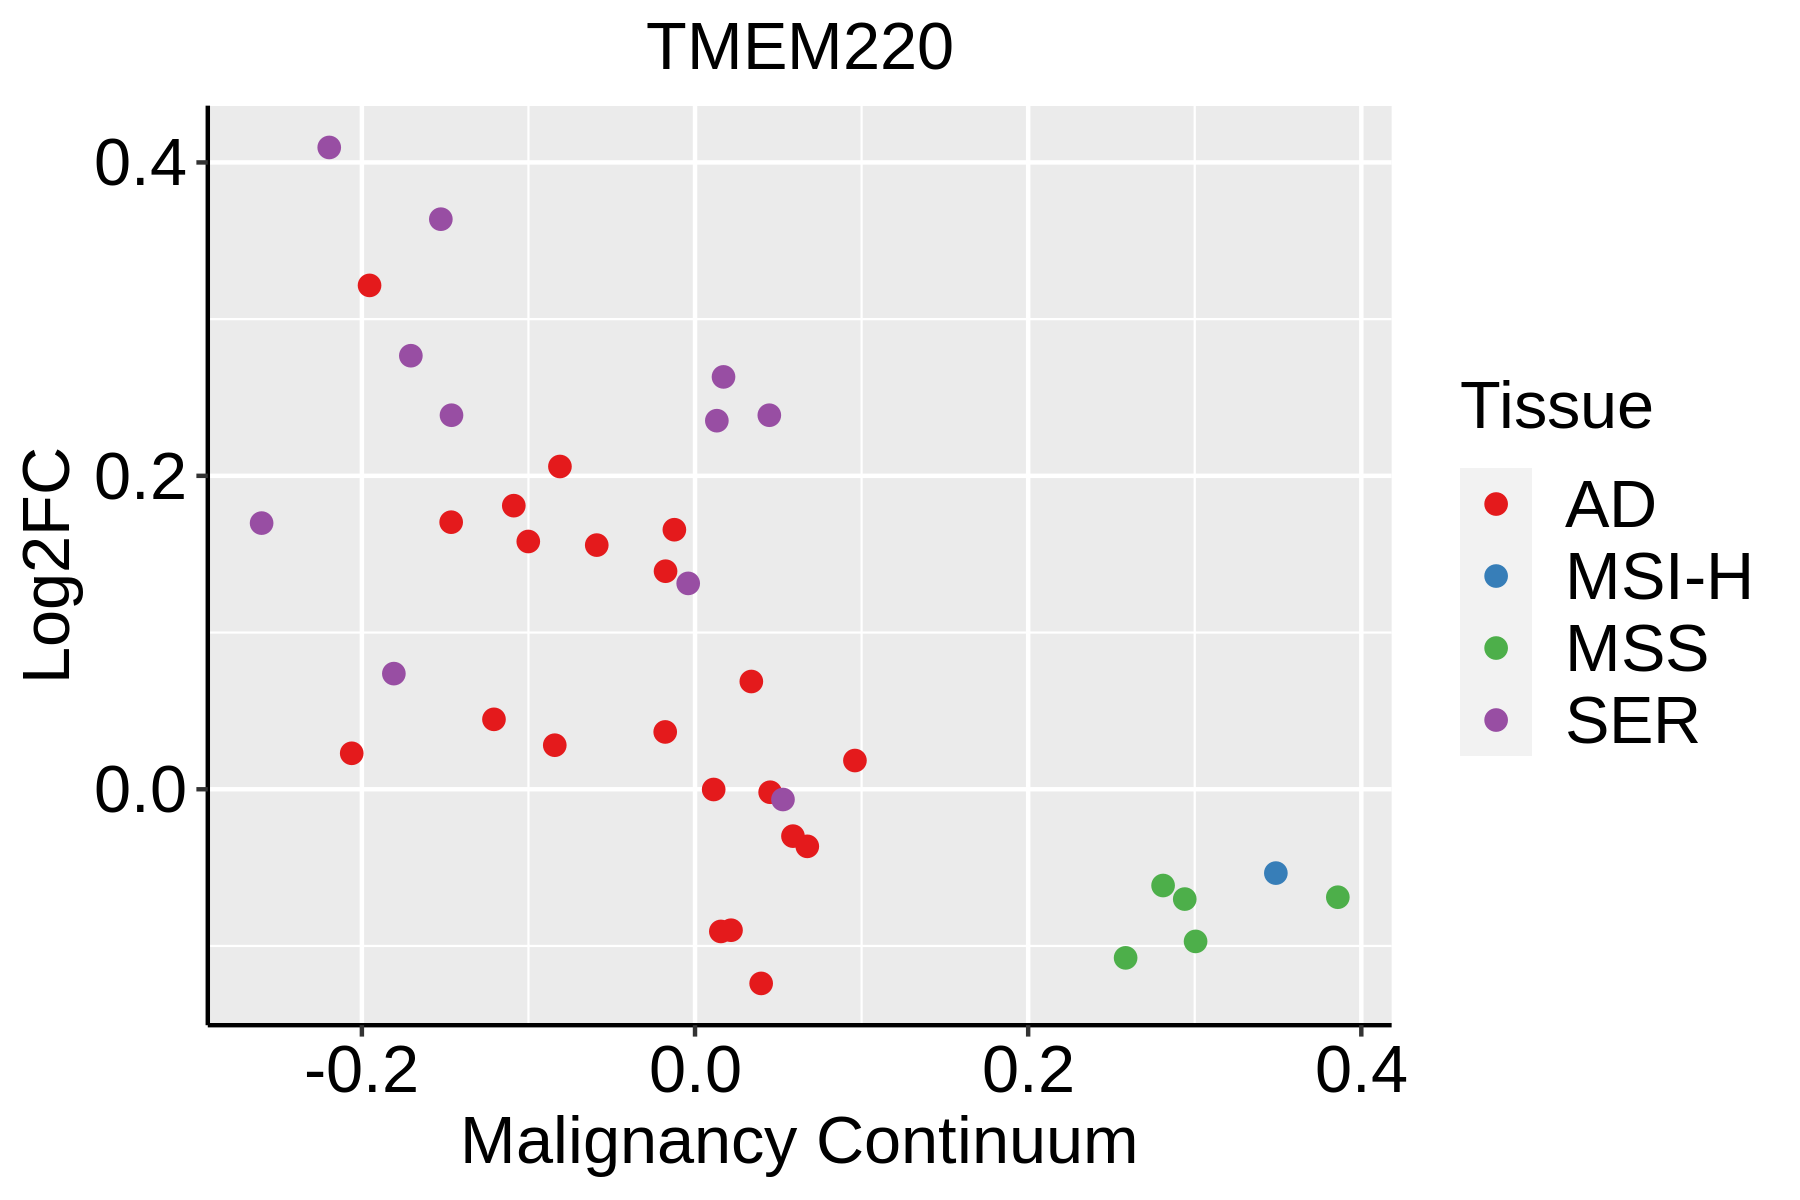 | AD: Adenomas |
| SER: Sessile serrated lesions | ||
| MSI-H: Microsatellite-high colorectal cancer | ||
| MSS: Microsatellite stable colorectal cancer | ||
| Esophagus |  | ESCC: Esophageal squamous cell carcinoma |
| HGIN: High-grade intraepithelial neoplasias | ||
| LGIN: Low-grade intraepithelial neoplasias | ||
| Liver | 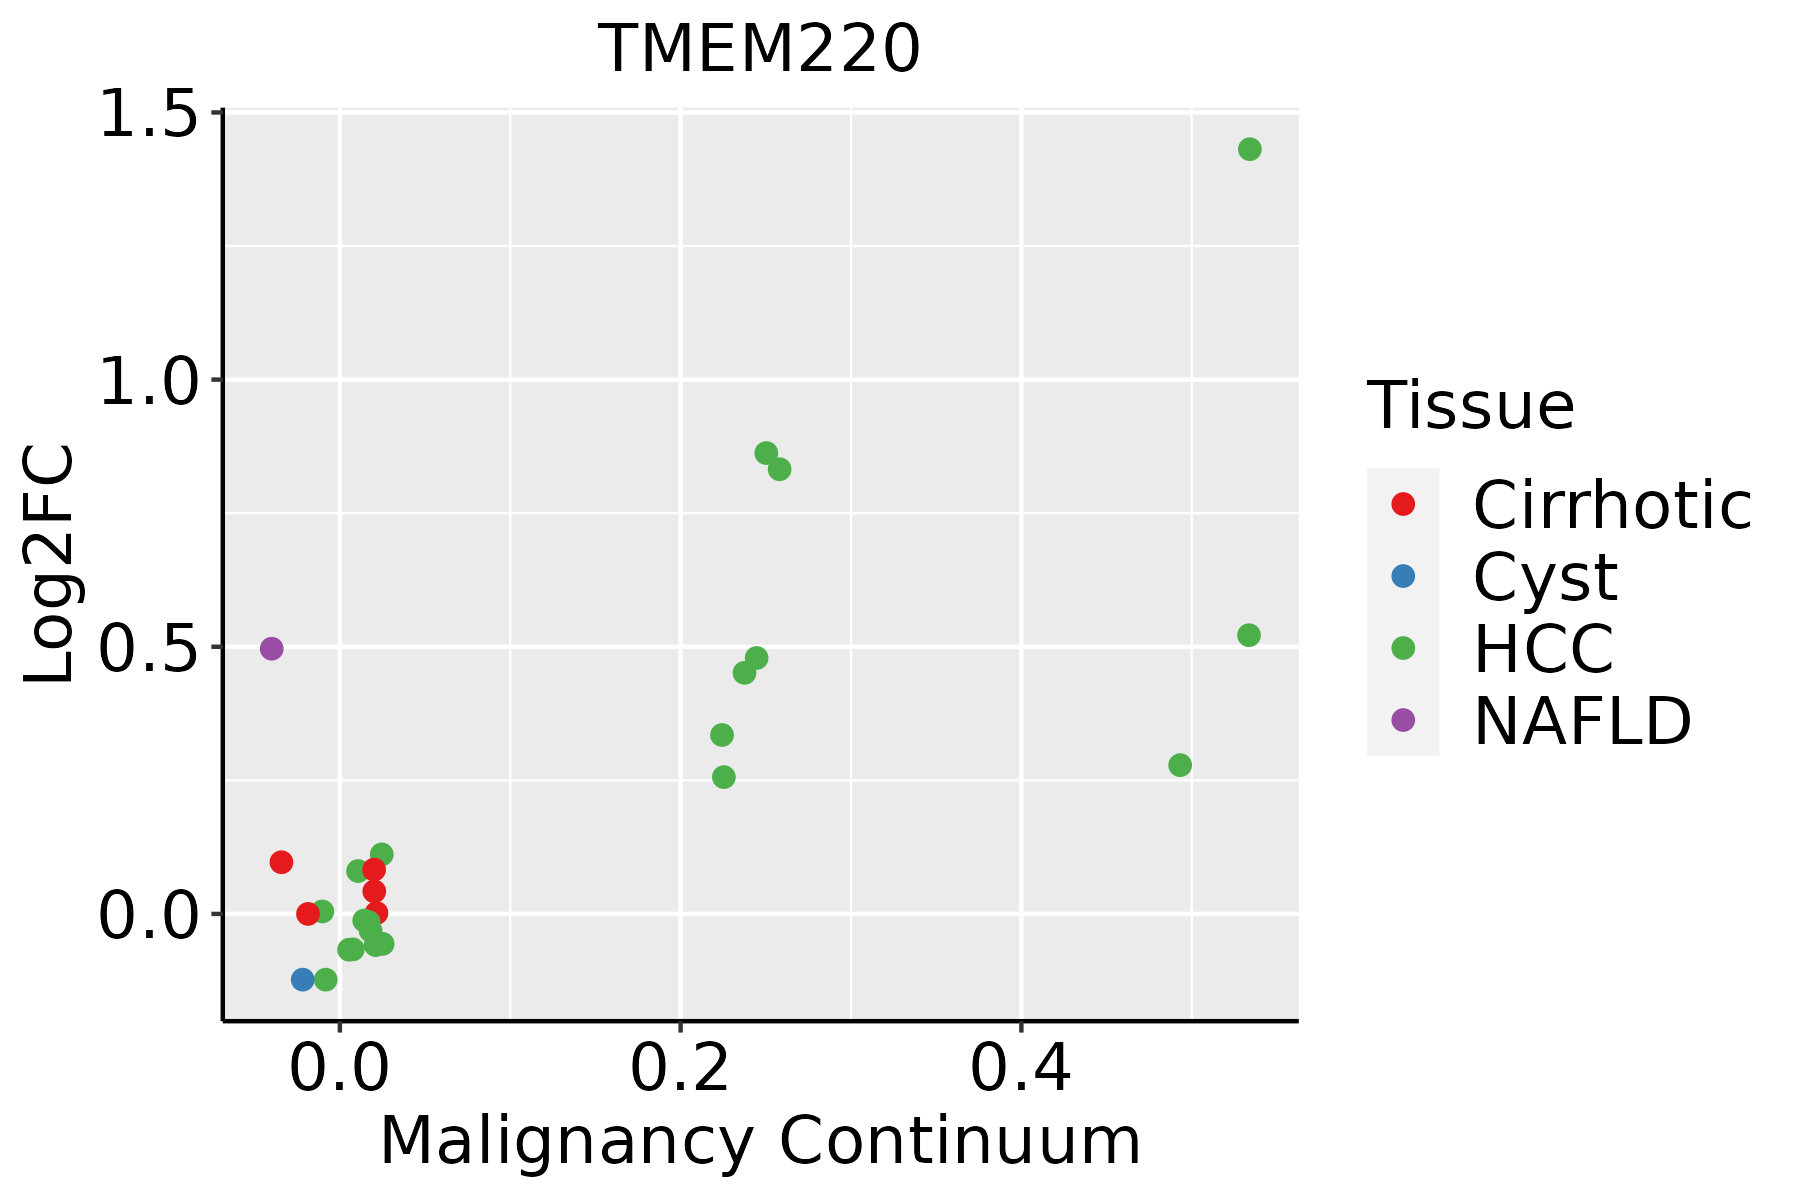 | HCC: Hepatocellular carcinoma |
| NAFLD: Non-alcoholic fatty liver disease |
| ∗log2FC in expression of this searched gene in stem-like cells from each diseased tissue sample relative to stem-like cells in normal samples in each tissue plotted against the malignancy continuum. Samples are colored based on if they are from different disease stage. |
Top |
Malignant transformation related pathway analysis |
| Find out the enriched GO biological processes and KEGG pathways involved in transition from healthy to precancer to cancer |
| Tissue | Disease Stage | Enriched GO biological Processes |
| Colorectum | AD |  |
| Colorectum | SER |  |
| Colorectum | MSS |  |
| Colorectum | MSI-H |  |
| Colorectum | FAP |  |
| ∗Top 15 enriched GO BP terms are showed in the bar plot of each disease state in each tissue. Each row represents a significant GO biological process which is colored according to the -log10(p.adjust). |
| Page: 1 2 3 4 5 6 7 8 9 |
| GO ID | Tissue | Disease Stage | Description | Gene Ratio | Bg Ratio | pvalue | p.adjust | Count |
| Page: 1 |
| Pathway ID | Tissue | Disease Stage | Description | Gene Ratio | Bg Ratio | pvalue | p.adjust | qvalue | Count |
| Page: 1 |
Top |
Cell-cell communication analysis |
| Identification of potential cell-cell interactions between two cell types and their ligand-receptor pairs for different disease states |
| Ligand | Receptor | LRpair | Pathway | Tissue | Disease Stage |
| Page: 1 |
Top |
Single-cell gene regulatory network inference analysis |
| Find out the significant the regulons (TFs) and the target genes of each regulon across cell types for different disease states |
| TF | Cell Type | Tissue | Disease Stage | Target Gene | RSS | Regulon Activity |
| ∗The dot plots of a searched regulon are shown for all cell subpopulations in each disease state of each tissue based on the regulon specific score inferred using pySCENIC and by calculating the average expression. |
| Page: 1 |
Top |
Somatic mutation of malignant transformation related genes |
| Annotation of somatic variants for genes involved in malignant transformation |
| Hugo Symbol | Variant Class | Variant Classification | dbSNP RS | HGVSc | HGVSp | HGVSp Short | SWISSPROT | BIOTYPE | SIFT | PolyPhen | Tumor Sample Barcode | Tissue | Histology | Sex | Age | Stage | Therapy Types | Drugs | Outcome |
| TMEM220 | SNV | Missense_Mutation | c.93G>C | p.Glu31Asp | p.E31D | Q6QAJ8 | protein_coding | tolerated(0.43) | benign(0.167) | TCGA-AA-3968-01 | Colorectum | colon adenocarcinoma | Female | <65 | I/II | Unknown | Unknown | SD | |
| TMEM220 | insertion | Frame_Shift_Ins | novel | c.115dupA | p.Ile39AsnfsTer12 | p.I39Nfs*12 | Q6QAJ8 | protein_coding | TCGA-5M-AAT6-01 | Colorectum | colon adenocarcinoma | Female | <65 | III/IV | Unknown | Unknown | PD | ||
| TMEM220 | SNV | Missense_Mutation | rs748517844 | c.250N>T | p.Arg84Cys | p.R84C | Q6QAJ8 | protein_coding | deleterious(0) | benign(0.235) | TCGA-4E-A92E-01 | Endometrium | uterine corpus endometrioid carcinoma | Female | <65 | I/II | Unknown | Unknown | SD |
| TMEM220 | SNV | Missense_Mutation | novel | c.445N>T | p.Arg149Trp | p.R149W | Q6QAJ8 | protein_coding | deleterious(0) | probably_damaging(0.942) | TCGA-AX-A2HD-01 | Endometrium | uterine corpus endometrioid carcinoma | Female | >=65 | III/IV | Unknown | Unknown | SD |
| TMEM220 | SNV | Missense_Mutation | novel | c.365N>T | p.Arg122Ile | p.R122I | Q6QAJ8 | protein_coding | tolerated(0.21) | probably_damaging(0.982) | TCGA-E6-A1M0-01 | Endometrium | uterine corpus endometrioid carcinoma | Female | <65 | III/IV | Chemotherapy | carboplatin | SD |
| TMEM220 | SNV | Missense_Mutation | c.221N>T | p.Ala74Val | p.A74V | Q6QAJ8 | protein_coding | tolerated(0.14) | benign(0.436) | TCGA-55-7570-01 | Lung | lung adenocarcinoma | Male | <65 | I/II | Unknown | Unknown | SD |
| Page: 1 |
Top |
Related drugs of malignant transformation related genes |
| Identification of chemicals and drugs interact with genes involved in malignant transfromation |
| (DGIdb 4.0) |
| Entrez ID | Symbol | Category | Interaction Types | Drug Claim Name | Drug Name | PMIDs |
| Page: 1 |

Copyright 2023-Present -The University of Texas Health Science Center at Houston |