
|
|||||
|
 | |
| |
| |
| |
| |
| |
|
Gene: TMEM217 |
Gene summary for TMEM217 |
| Gene information | Species | Human | Gene symbol | TMEM217 | Gene ID | 221468 |
| Gene name | transmembrane protein 217 | |
| Gene Alias | C6orf128 | |
| Cytomap | 6p21.2 | |
| Gene Type | protein-coding | GO ID | GO:0005575 | UniProtAcc | Q8N7C4 |
Top |
Malignant transformation analysis |
| Identification of the aberrant gene expression in precancerous and cancerous lesions by comparing the gene expression of stem-like cells in diseased tissues with normal stem cells |
| Entrez ID | Symbol | Replicates | Species | Organ | Tissue | Adj P-value | Log2FC | Malignancy |
| 221468 | TMEM217 | PTC06 | Human | Thyroid | PTC | 5.95e-06 | 2.47e-01 | 0.2057 |
| 221468 | TMEM217 | PTC07 | Human | Thyroid | PTC | 3.00e-07 | 2.30e-01 | 0.2044 |
| 221468 | TMEM217 | ATC13 | Human | Thyroid | ATC | 3.85e-57 | 1.51e+00 | 0.34 |
| 221468 | TMEM217 | ATC5 | Human | Thyroid | ATC | 4.77e-72 | 1.63e+00 | 0.34 |
| Page: 1 |
| Tissue | Expression Dynamics | Abbreviation |
| Thyroid | 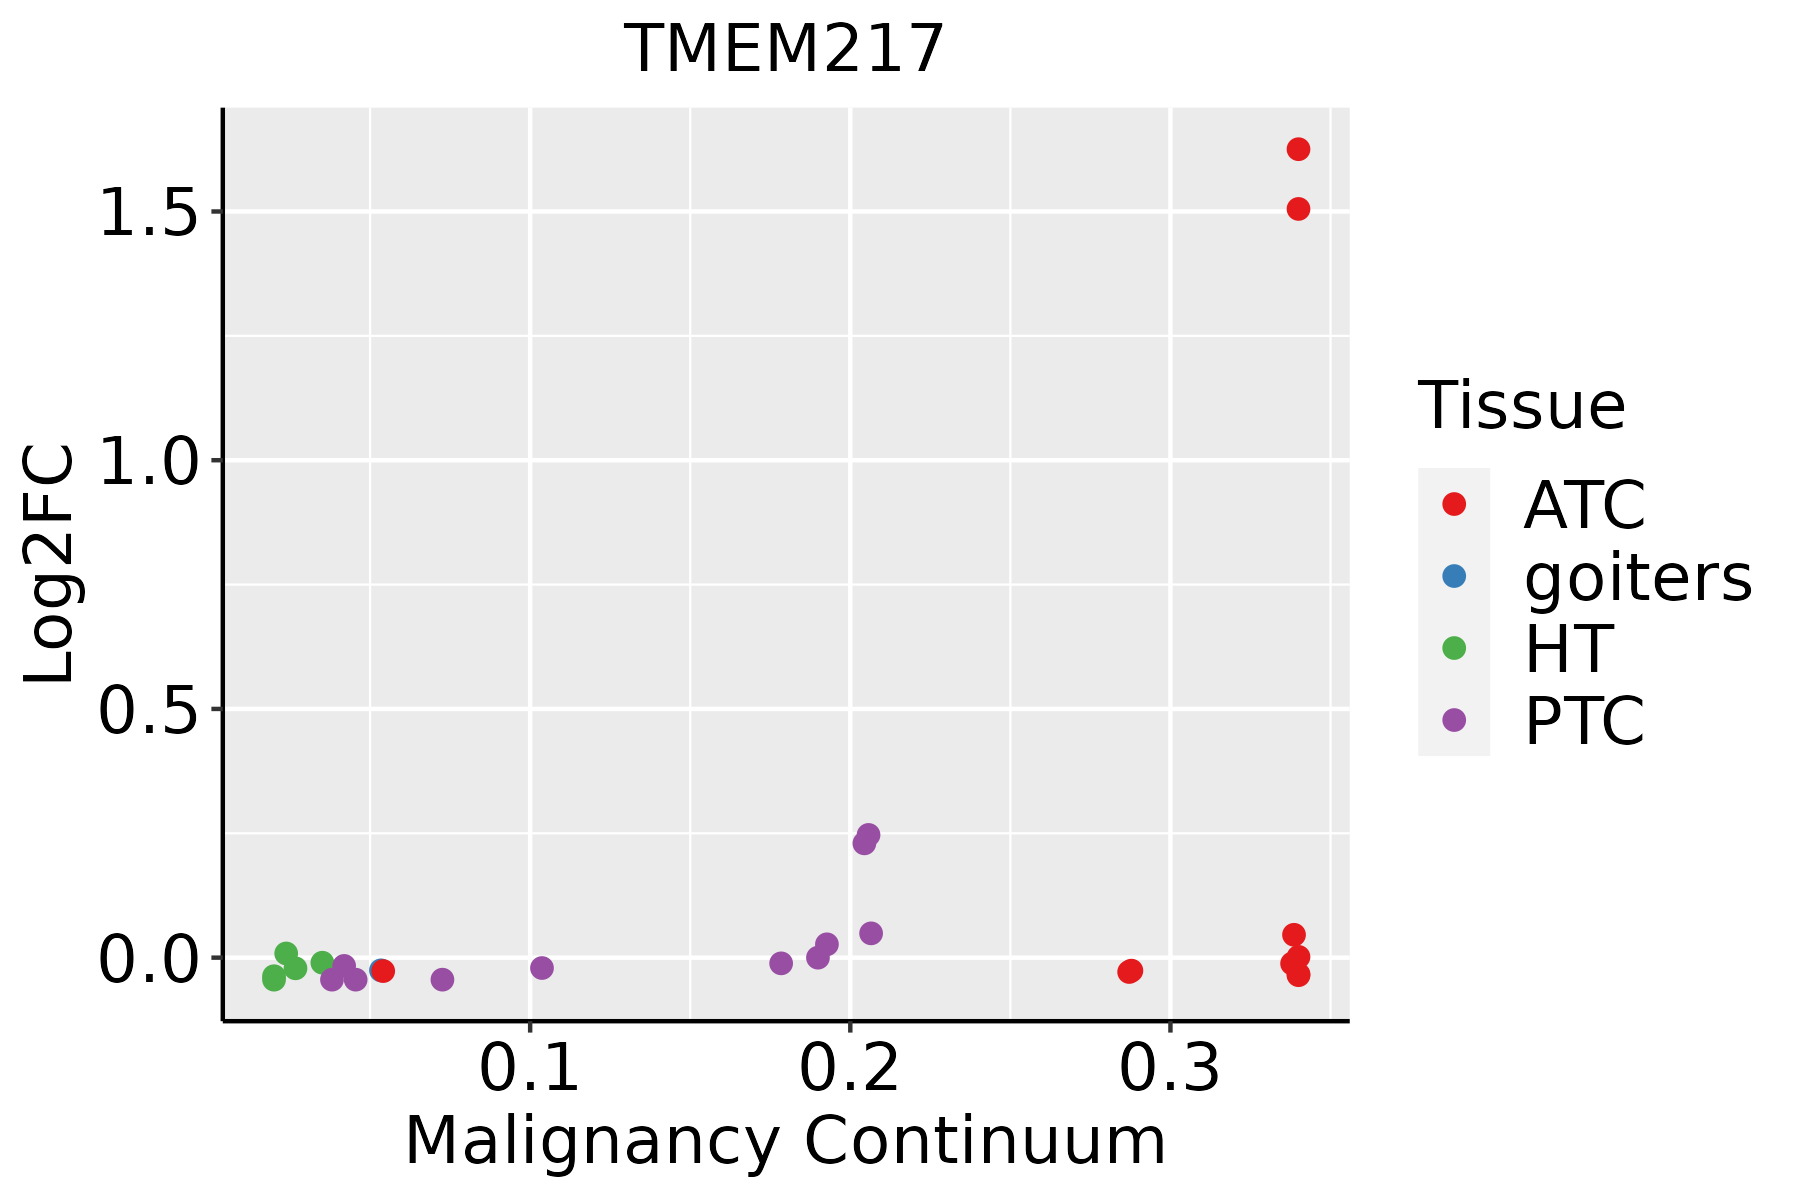 | ATC: Anaplastic thyroid cancer |
| HT: Hashimoto's thyroiditis | ||
| PTC: Papillary thyroid cancer |
| ∗log2FC in expression of this searched gene in stem-like cells from each diseased tissue sample relative to stem-like cells in normal samples in each tissue plotted against the malignancy continuum. Samples are colored based on if they are from different disease stage. |
Top |
Malignant transformation related pathway analysis |
| Find out the enriched GO biological processes and KEGG pathways involved in transition from healthy to precancer to cancer |
| Tissue | Disease Stage | Enriched GO biological Processes |
| Colorectum | AD |  |
| Colorectum | SER |  |
| Colorectum | MSS |  |
| Colorectum | MSI-H |  |
| Colorectum | FAP |  |
| ∗Top 15 enriched GO BP terms are showed in the bar plot of each disease state in each tissue. Each row represents a significant GO biological process which is colored according to the -log10(p.adjust). |
| Page: 1 2 3 4 5 6 7 8 9 |
| GO ID | Tissue | Disease Stage | Description | Gene Ratio | Bg Ratio | pvalue | p.adjust | Count |
| Page: 1 |
| Pathway ID | Tissue | Disease Stage | Description | Gene Ratio | Bg Ratio | pvalue | p.adjust | qvalue | Count |
| Page: 1 |
Top |
Cell-cell communication analysis |
| Identification of potential cell-cell interactions between two cell types and their ligand-receptor pairs for different disease states |
| Ligand | Receptor | LRpair | Pathway | Tissue | Disease Stage |
| Page: 1 |
Top |
Single-cell gene regulatory network inference analysis |
| Find out the significant the regulons (TFs) and the target genes of each regulon across cell types for different disease states |
| TF | Cell Type | Tissue | Disease Stage | Target Gene | RSS | Regulon Activity |
| ∗The dot plots of a searched regulon are shown for all cell subpopulations in each disease state of each tissue based on the regulon specific score inferred using pySCENIC and by calculating the average expression. |
| Page: 1 |
Top |
Somatic mutation of malignant transformation related genes |
| Annotation of somatic variants for genes involved in malignant transformation |
| Hugo Symbol | Variant Class | Variant Classification | dbSNP RS | HGVSc | HGVSp | HGVSp Short | SWISSPROT | BIOTYPE | SIFT | PolyPhen | Tumor Sample Barcode | Tissue | Histology | Sex | Age | Stage | Therapy Types | Drugs | Outcome |
| TMEM217 | SNV | Missense_Mutation | c.595N>A | p.Glu199Lys | p.E199K | Q8N7C4 | protein_coding | tolerated_low_confidence(0.14) | benign(0.01) | TCGA-B6-A0IJ-01 | Breast | breast invasive carcinoma | Female | <65 | I/II | Unknown | Unknown | SD | |
| TMEM217 | insertion | In_Frame_Ins | novel | c.175_176insCAG | p.Phe59delinsSerVal | p.F59delinsSV | Q8N7C4 | protein_coding | TCGA-A8-A08H-01 | Breast | breast invasive carcinoma | Female | >=65 | I/II | Unknown | Unknown | SD | ||
| TMEM217 | insertion | Frame_Shift_Ins | novel | c.174_175insGAGTGGGT | p.Phe59GlufsTer55 | p.F59Efs*55 | Q8N7C4 | protein_coding | TCGA-A8-A08H-01 | Breast | breast invasive carcinoma | Female | >=65 | I/II | Unknown | Unknown | SD | ||
| TMEM217 | insertion | Frame_Shift_Ins | novel | c.173_174insAAGATTATCAATTT | p.Asn58LysfsTer58 | p.N58Kfs*58 | Q8N7C4 | protein_coding | TCGA-A8-A08H-01 | Breast | breast invasive carcinoma | Female | >=65 | I/II | Unknown | Unknown | SD | ||
| TMEM217 | insertion | Frame_Shift_Ins | novel | c.243_244insAAGACCAGCCTGGC | p.Leu82LysfsTer34 | p.L82Kfs*34 | Q8N7C4 | protein_coding | TCGA-AO-A0J9-01 | Breast | breast invasive carcinoma | Female | <65 | III/IV | Chemotherapy | cyclophosphamide | PD | ||
| TMEM217 | SNV | Missense_Mutation | rs773610079 | c.554C>T | p.Ser185Leu | p.S185L | Q8N7C4 | protein_coding | tolerated(0.91) | benign(0) | TCGA-2W-A8YY-01 | Cervix | cervical & endocervical cancer | Female | <65 | I/II | Chemotherapy | cisplatin | CR |
| TMEM217 | SNV | Missense_Mutation | c.172N>T | p.Asn58Tyr | p.N58Y | Q8N7C4 | protein_coding | tolerated(1) | benign(0.001) | TCGA-AA-3672-01 | Colorectum | colon adenocarcinoma | Female | >=65 | III/IV | Unknown | Unknown | SD | |
| TMEM217 | SNV | Missense_Mutation | c.73N>T | p.Ala25Ser | p.A25S | Q8N7C4 | protein_coding | tolerated(0.26) | benign(0.225) | TCGA-AA-3819-01 | Colorectum | colon adenocarcinoma | Female | <65 | I/II | Unknown | Unknown | SD | |
| TMEM217 | SNV | Missense_Mutation | c.185G>T | p.Cys62Phe | p.C62F | Q8N7C4 | protein_coding | deleterious(0.04) | probably_damaging(0.964) | TCGA-AA-A00N-01 | Colorectum | colon adenocarcinoma | Male | >=65 | I/II | Unknown | Unknown | PD | |
| TMEM217 | SNV | Missense_Mutation | c.172N>G | p.Asn58Asp | p.N58D | Q8N7C4 | protein_coding | tolerated(0.41) | benign(0) | TCGA-AA-A010-01 | Colorectum | colon adenocarcinoma | Female | <65 | I/II | Chemotherapy | folinic | CR |
| Page: 1 2 3 4 |
Top |
Related drugs of malignant transformation related genes |
| Identification of chemicals and drugs interact with genes involved in malignant transfromation |
| (DGIdb 4.0) |
| Entrez ID | Symbol | Category | Interaction Types | Drug Claim Name | Drug Name | PMIDs |
| Page: 1 |

Copyright 2023-Present -The University of Texas Health Science Center at Houston |