
|
|||||
|
 | |
| |
| |
| |
| |
| |
|
Gene: TMEM216 |
Gene summary for TMEM216 |
| Gene information | Species | Human | Gene symbol | TMEM216 | Gene ID | 51259 |
| Gene name | transmembrane protein 216 | |
| Gene Alias | HSPC244 | |
| Cytomap | 11q12.2 | |
| Gene Type | protein-coding | GO ID | GO:0006996 | UniProtAcc | Q9P0N5 |
Top |
Malignant transformation analysis |
| Identification of the aberrant gene expression in precancerous and cancerous lesions by comparing the gene expression of stem-like cells in diseased tissues with normal stem cells |
| Entrez ID | Symbol | Replicates | Species | Organ | Tissue | Adj P-value | Log2FC | Malignancy |
| 51259 | TMEM216 | LZE4T | Human | Esophagus | ESCC | 1.43e-09 | 2.51e-01 | 0.0811 |
| 51259 | TMEM216 | LZE5T | Human | Esophagus | ESCC | 1.84e-02 | 2.97e-01 | 0.0514 |
| 51259 | TMEM216 | LZE8T | Human | Esophagus | ESCC | 5.45e-06 | 2.47e-01 | 0.067 |
| 51259 | TMEM216 | LZE24T | Human | Esophagus | ESCC | 9.58e-18 | 4.79e-01 | 0.0596 |
| 51259 | TMEM216 | LZE6T | Human | Esophagus | ESCC | 8.48e-05 | 3.44e-01 | 0.0845 |
| 51259 | TMEM216 | P1T-E | Human | Esophagus | ESCC | 3.07e-05 | 3.93e-01 | 0.0875 |
| 51259 | TMEM216 | P2T-E | Human | Esophagus | ESCC | 3.21e-28 | 4.82e-01 | 0.1177 |
| 51259 | TMEM216 | P4T-E | Human | Esophagus | ESCC | 2.28e-43 | 9.65e-01 | 0.1323 |
| 51259 | TMEM216 | P5T-E | Human | Esophagus | ESCC | 1.64e-17 | 4.07e-01 | 0.1327 |
| 51259 | TMEM216 | P8T-E | Human | Esophagus | ESCC | 2.13e-38 | 7.91e-01 | 0.0889 |
| 51259 | TMEM216 | P9T-E | Human | Esophagus | ESCC | 2.88e-14 | 3.63e-01 | 0.1131 |
| 51259 | TMEM216 | P10T-E | Human | Esophagus | ESCC | 2.70e-38 | 6.42e-01 | 0.116 |
| 51259 | TMEM216 | P11T-E | Human | Esophagus | ESCC | 2.34e-14 | 5.80e-01 | 0.1426 |
| 51259 | TMEM216 | P12T-E | Human | Esophagus | ESCC | 8.30e-38 | 6.77e-01 | 0.1122 |
| 51259 | TMEM216 | P15T-E | Human | Esophagus | ESCC | 6.02e-16 | 3.07e-01 | 0.1149 |
| 51259 | TMEM216 | P16T-E | Human | Esophagus | ESCC | 1.27e-31 | 6.04e-01 | 0.1153 |
| 51259 | TMEM216 | P17T-E | Human | Esophagus | ESCC | 7.55e-05 | 2.15e-01 | 0.1278 |
| 51259 | TMEM216 | P19T-E | Human | Esophagus | ESCC | 1.61e-03 | 3.06e-01 | 0.1662 |
| 51259 | TMEM216 | P20T-E | Human | Esophagus | ESCC | 2.34e-12 | 3.14e-01 | 0.1124 |
| 51259 | TMEM216 | P21T-E | Human | Esophagus | ESCC | 2.44e-15 | 3.95e-01 | 0.1617 |
| Page: 1 2 3 4 5 |
| Tissue | Expression Dynamics | Abbreviation |
| Esophagus | 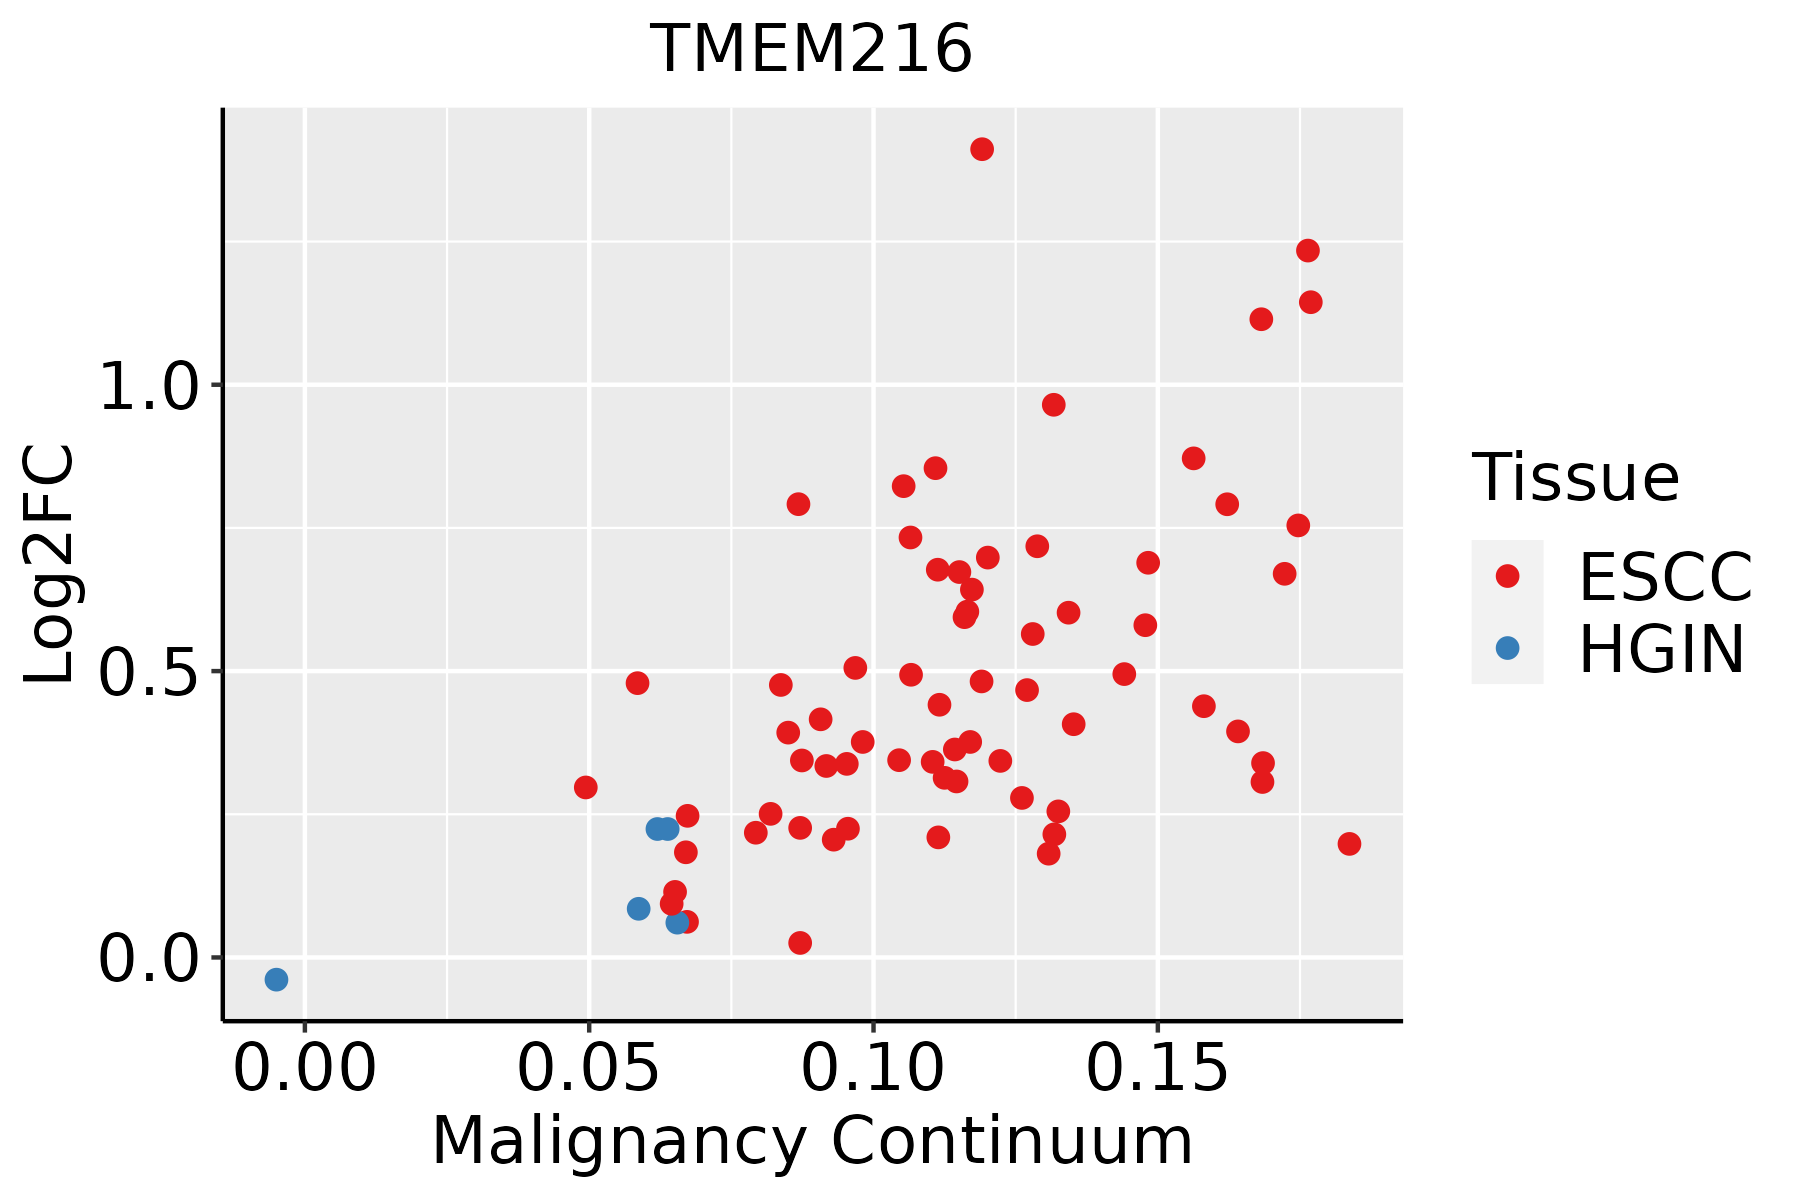 | ESCC: Esophageal squamous cell carcinoma |
| HGIN: High-grade intraepithelial neoplasias | ||
| LGIN: Low-grade intraepithelial neoplasias | ||
| Liver | 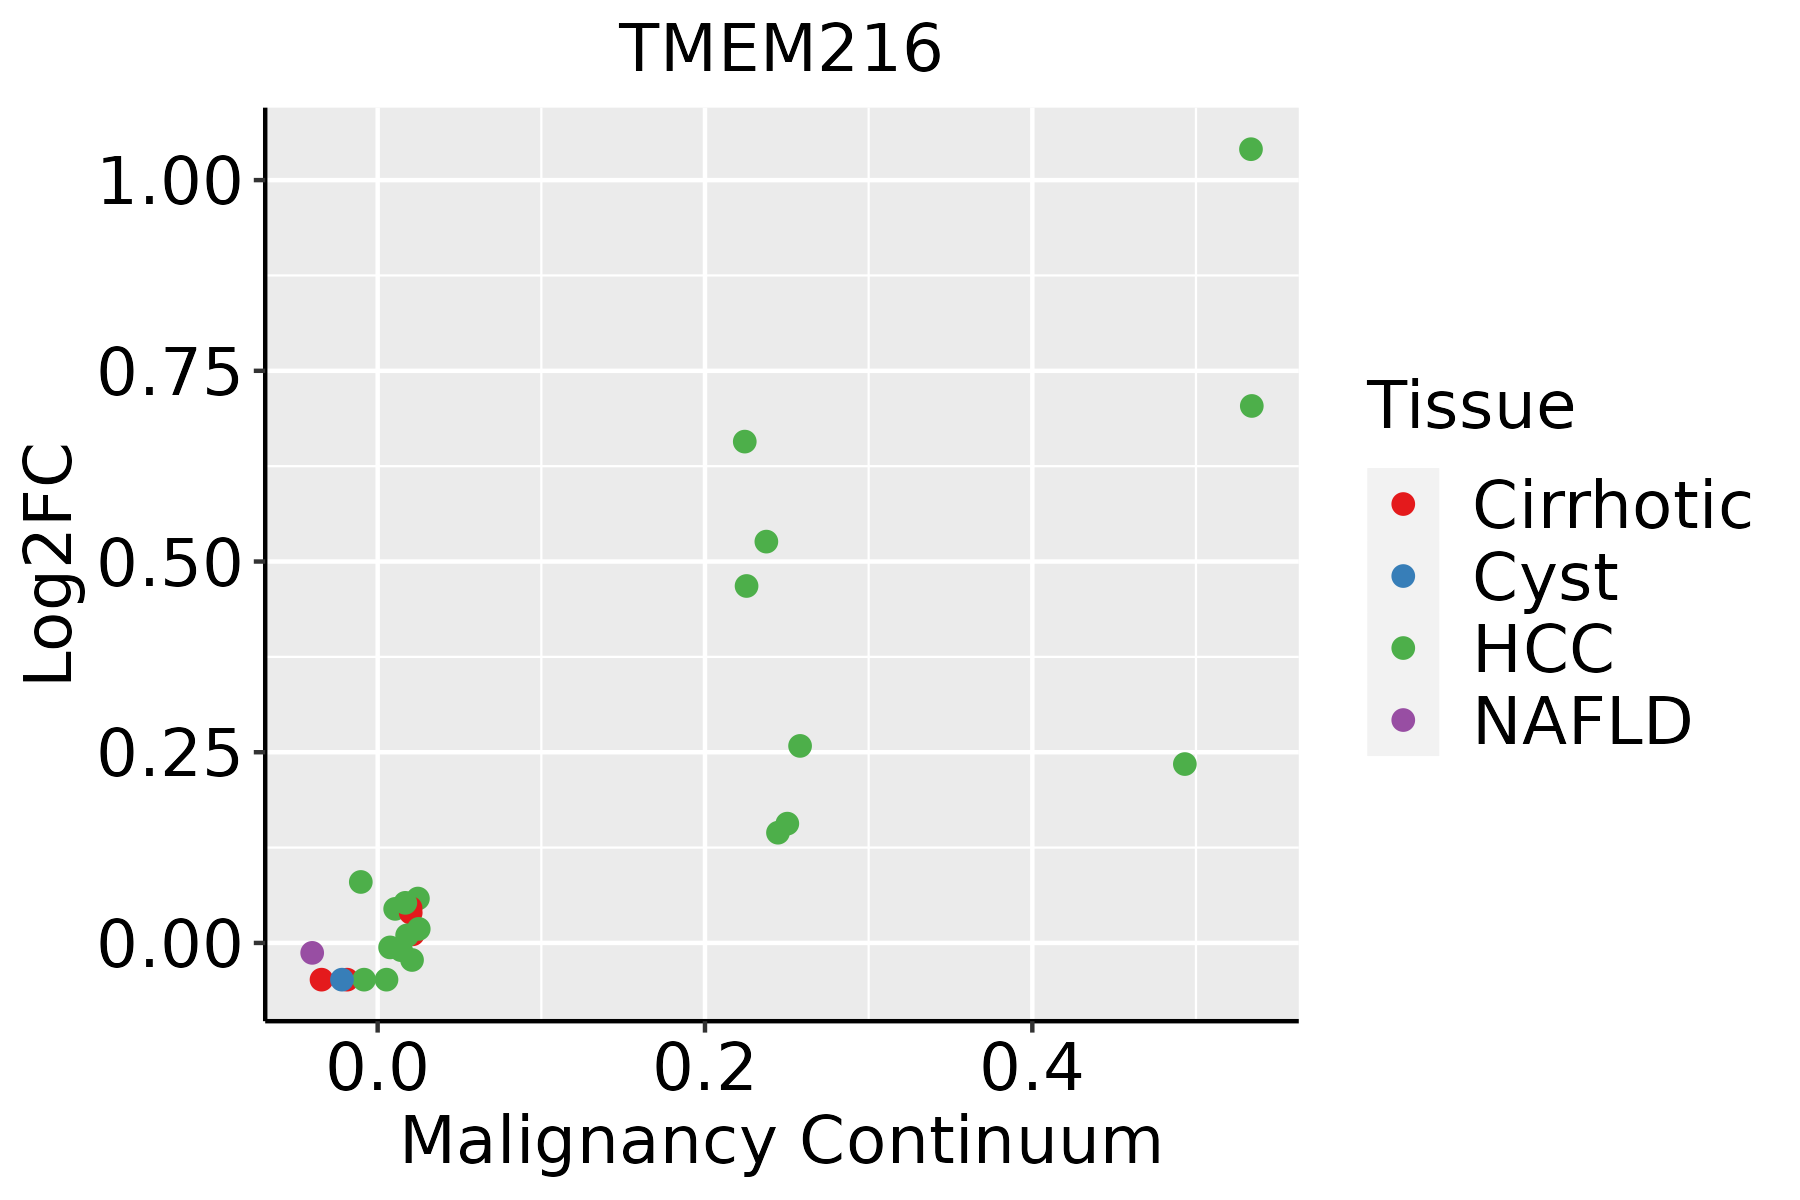 | HCC: Hepatocellular carcinoma |
| NAFLD: Non-alcoholic fatty liver disease | ||
| Oral Cavity | 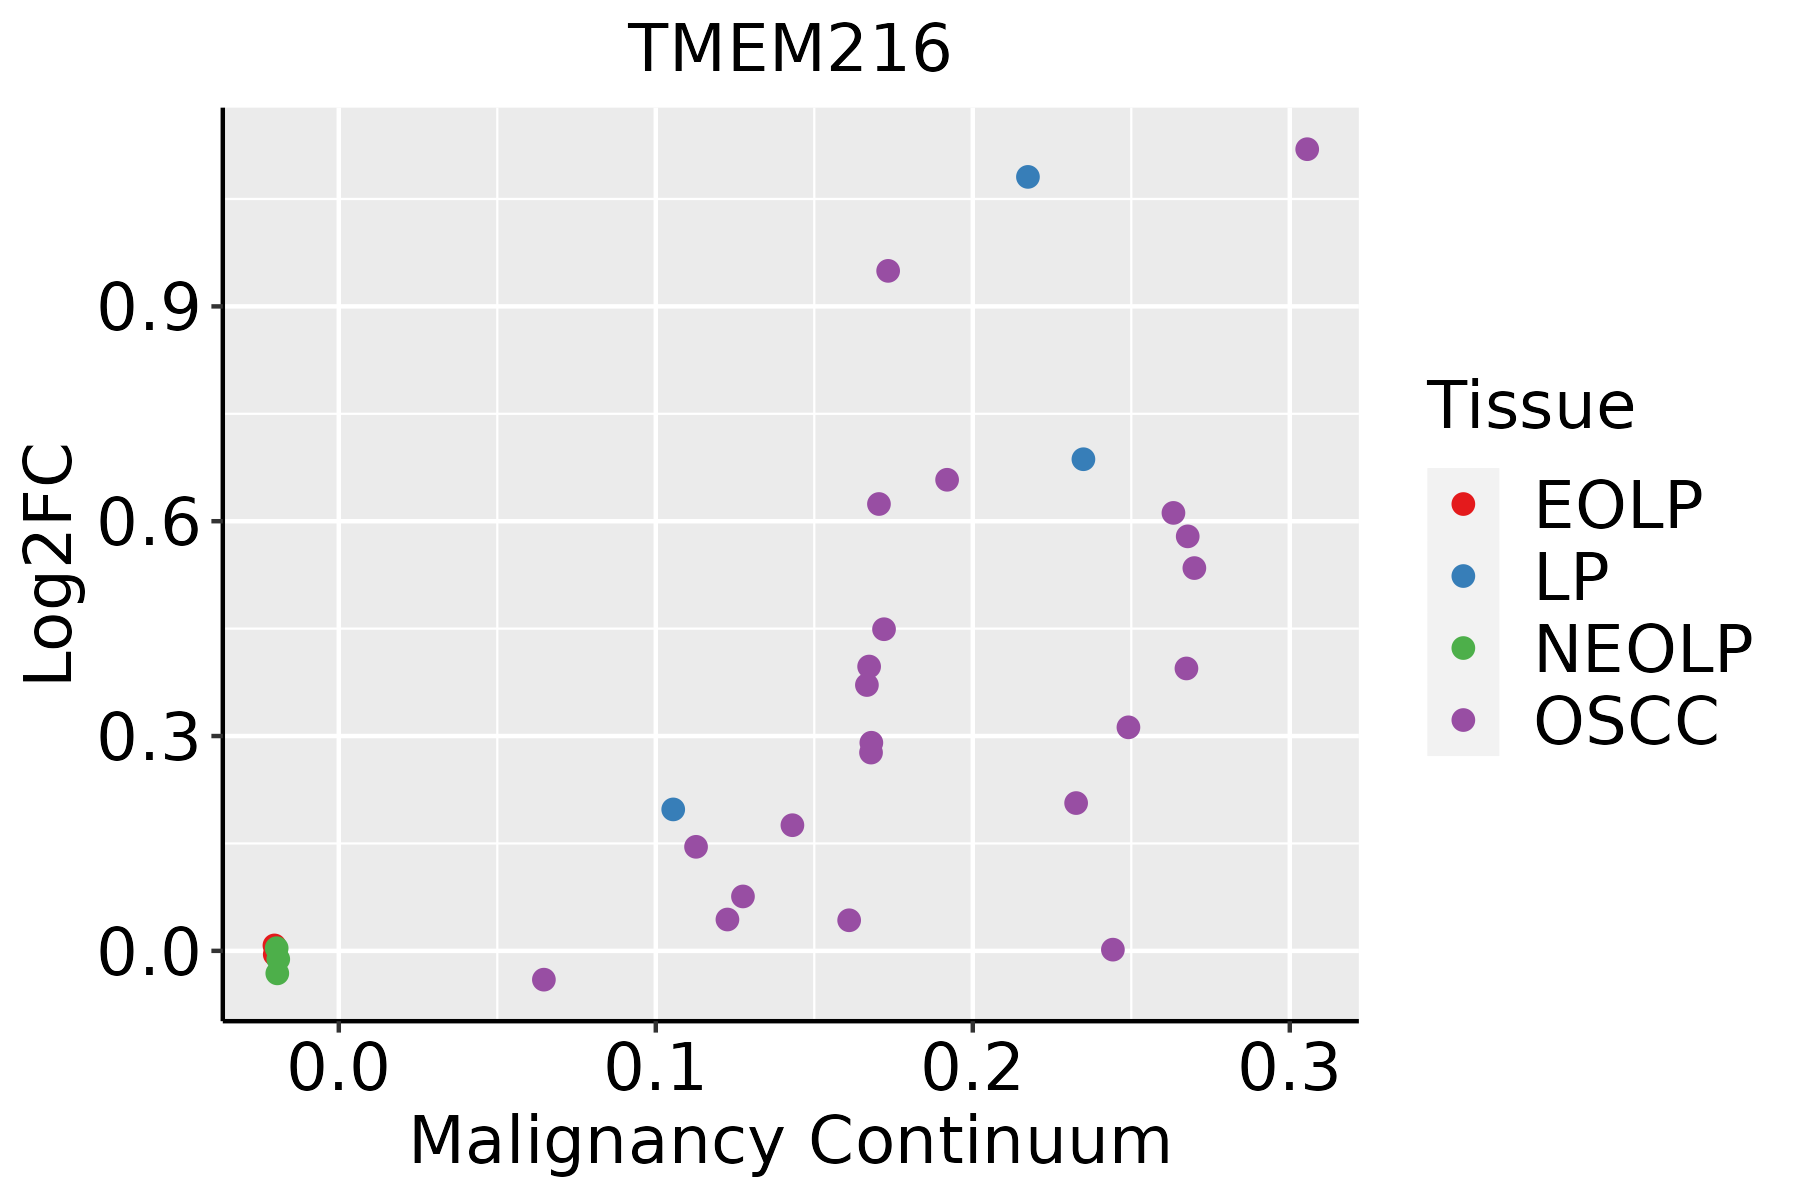 | EOLP: Erosive Oral lichen planus |
| LP: leukoplakia | ||
| NEOLP: Non-erosive oral lichen planus | ||
| OSCC: Oral squamous cell carcinoma |
| ∗log2FC in expression of this searched gene in stem-like cells from each diseased tissue sample relative to stem-like cells in normal samples in each tissue plotted against the malignancy continuum. Samples are colored based on if they are from different disease stage. |
Top |
Malignant transformation related pathway analysis |
| Find out the enriched GO biological processes and KEGG pathways involved in transition from healthy to precancer to cancer |
| Tissue | Disease Stage | Enriched GO biological Processes |
| Colorectum | AD |  |
| Colorectum | SER |  |
| Colorectum | MSS |  |
| Colorectum | MSI-H |  |
| Colorectum | FAP |  |
| ∗Top 15 enriched GO BP terms are showed in the bar plot of each disease state in each tissue. Each row represents a significant GO biological process which is colored according to the -log10(p.adjust). |
| Page: 1 2 3 4 5 6 7 8 9 |
| GO ID | Tissue | Disease Stage | Description | Gene Ratio | Bg Ratio | pvalue | p.adjust | Count |
| GO:19055153 | Esophagus | ESCC | non-motile cilium assembly | 39/8552 | 61/18723 | 3.08e-03 | 1.28e-02 | 39 |
| Page: 1 |
| Pathway ID | Tissue | Disease Stage | Description | Gene Ratio | Bg Ratio | pvalue | p.adjust | qvalue | Count |
| Page: 1 |
Top |
Cell-cell communication analysis |
| Identification of potential cell-cell interactions between two cell types and their ligand-receptor pairs for different disease states |
| Ligand | Receptor | LRpair | Pathway | Tissue | Disease Stage |
| Page: 1 |
Top |
Single-cell gene regulatory network inference analysis |
| Find out the significant the regulons (TFs) and the target genes of each regulon across cell types for different disease states |
| TF | Cell Type | Tissue | Disease Stage | Target Gene | RSS | Regulon Activity |
| ∗The dot plots of a searched regulon are shown for all cell subpopulations in each disease state of each tissue based on the regulon specific score inferred using pySCENIC and by calculating the average expression. |
| Page: 1 |
Top |
Somatic mutation of malignant transformation related genes |
| Annotation of somatic variants for genes involved in malignant transformation |
| Hugo Symbol | Variant Class | Variant Classification | dbSNP RS | HGVSc | HGVSp | HGVSp Short | SWISSPROT | BIOTYPE | SIFT | PolyPhen | Tumor Sample Barcode | Tissue | Histology | Sex | Age | Stage | Therapy Types | Drugs | Outcome |
| TMEM216 | SNV | Missense_Mutation | rs774225426 | c.343N>T | p.Arg115Cys | p.R115C | Q9P0N5 | protein_coding | deleterious(0) | possibly_damaging(0.687) | TCGA-A2-A4RW-01 | Breast | breast invasive carcinoma | Female | <65 | III/IV | Unknown | Unknown | SD |
| TMEM216 | SNV | Missense_Mutation | novel | c.83N>A | p.Gly28Glu | p.G28E | Q9P0N5 | protein_coding | deleterious(0) | possibly_damaging(0.554) | TCGA-AC-A8OP-01 | Breast | breast invasive carcinoma | Female | >=65 | I/II | Unknown | Unknown | SD |
| TMEM216 | SNV | Missense_Mutation | rs368617773 | c.254G>A | p.Arg85Gln | p.R85Q | Q9P0N5 | protein_coding | deleterious(0.03) | benign(0.033) | TCGA-MY-A5BE-01 | Cervix | cervical & endocervical cancer | Female | <65 | I/II | Unknown | Unknown | SD |
| TMEM216 | SNV | Missense_Mutation | rs201108965 | c.218N>A | p.Arg73His | p.R73H | Q9P0N5 | protein_coding | deleterious(0) | probably_damaging(0.998) | TCGA-G4-6304-01 | Colorectum | colon adenocarcinoma | Female | >=65 | I/II | Chemotherapy | fluorouracil | PD |
| TMEM216 | insertion | Frame_Shift_Ins | rs767384710 | c.228dupT | p.Gly77TrpfsTer16 | p.G77Wfs*16 | Q9P0N5 | protein_coding | TCGA-AA-3947-01 | Colorectum | colon adenocarcinoma | Female | <65 | I/II | Unknown | Unknown | SD | ||
| TMEM216 | SNV | Missense_Mutation | novel | c.113N>C | p.Glu38Ala | p.E38A | Q9P0N5 | protein_coding | tolerated(0.11) | probably_damaging(1) | TCGA-AP-A1DV-01 | Endometrium | uterine corpus endometrioid carcinoma | Female | <65 | I/II | Unknown | Unknown | SD |
| TMEM216 | SNV | Missense_Mutation | novel | c.67N>A | p.Leu23Met | p.L23M | Q9P0N5 | protein_coding | deleterious(0) | probably_damaging(1) | TCGA-AX-A1CE-01 | Endometrium | uterine corpus endometrioid carcinoma | Female | <65 | I/II | Unspecific | Paclitaxel | SD |
| TMEM216 | SNV | Missense_Mutation | novel | c.148N>T | p.Pro50Ser | p.P50S | Q9P0N5 | protein_coding | tolerated(0.6) | probably_damaging(0.998) | TCGA-AX-A2HD-01 | Endometrium | uterine corpus endometrioid carcinoma | Female | >=65 | III/IV | Unknown | Unknown | SD |
| TMEM216 | SNV | Missense_Mutation | novel | c.186N>A | p.Met62Ile | p.M62I | Q9P0N5 | protein_coding | deleterious(0.02) | benign(0.02) | TCGA-B5-A11N-01 | Endometrium | uterine corpus endometrioid carcinoma | Female | >=65 | I/II | Unknown | Unknown | SD |
| TMEM216 | SNV | Missense_Mutation | rs367737418 | c.359N>C | p.Met120Thr | p.M120T | Q9P0N5 | protein_coding | deleterious(0) | benign(0.062) | TCGA-B5-A11U-01 | Endometrium | uterine corpus endometrioid carcinoma | Female | >=65 | III/IV | Unknown | Unknown | SD |
| Page: 1 2 |
Top |
Related drugs of malignant transformation related genes |
| Identification of chemicals and drugs interact with genes involved in malignant transfromation |
| (DGIdb 4.0) |
| Entrez ID | Symbol | Category | Interaction Types | Drug Claim Name | Drug Name | PMIDs |
| Page: 1 |

Copyright 2023-Present -The University of Texas Health Science Center at Houston |