
|
|||||
|
 | |
| |
| |
| |
| |
| |
|
Gene: TMEM213 |
Gene summary for TMEM213 |
| Gene information | Species | Human | Gene symbol | TMEM213 | Gene ID | 155006 |
| Gene name | transmembrane protein 213 | |
| Gene Alias | TMEM213 | |
| Cytomap | 7q34 | |
| Gene Type | protein-coding | GO ID | GO:0005575 | UniProtAcc | A2RRL7 |
Top |
Malignant transformation analysis |
| Identification of the aberrant gene expression in precancerous and cancerous lesions by comparing the gene expression of stem-like cells in diseased tissues with normal stem cells |
| Entrez ID | Symbol | Replicates | Species | Organ | Tissue | Adj P-value | Log2FC | Malignancy |
| 155006 | TMEM213 | HCC2_Meng | Human | Liver | HCC | 1.08e-07 | 8.45e-02 | 0.0107 |
| 155006 | TMEM213 | HCC1 | Human | Liver | HCC | 4.85e-09 | 9.73e-01 | 0.5336 |
| 155006 | TMEM213 | HCC2 | Human | Liver | HCC | 2.24e-12 | 1.04e+00 | 0.5341 |
| 155006 | TMEM213 | HCC5 | Human | Liver | HCC | 2.31e-12 | 6.76e-01 | 0.4932 |
| 155006 | TMEM213 | RNA-P6T2-P6T2-1 | Human | Lung | IAC | 4.60e-40 | 1.10e+00 | -0.0166 |
| 155006 | TMEM213 | RNA-P6T2-P6T2-2 | Human | Lung | IAC | 2.78e-39 | 1.05e+00 | -0.0132 |
| 155006 | TMEM213 | RNA-P6T2-P6T2-3 | Human | Lung | IAC | 5.29e-41 | 1.06e+00 | -0.013 |
| 155006 | TMEM213 | RNA-P6T2-P6T2-4 | Human | Lung | IAC | 2.39e-32 | 9.44e-01 | -0.0121 |
| Page: 1 |
| Tissue | Expression Dynamics | Abbreviation |
| Liver | 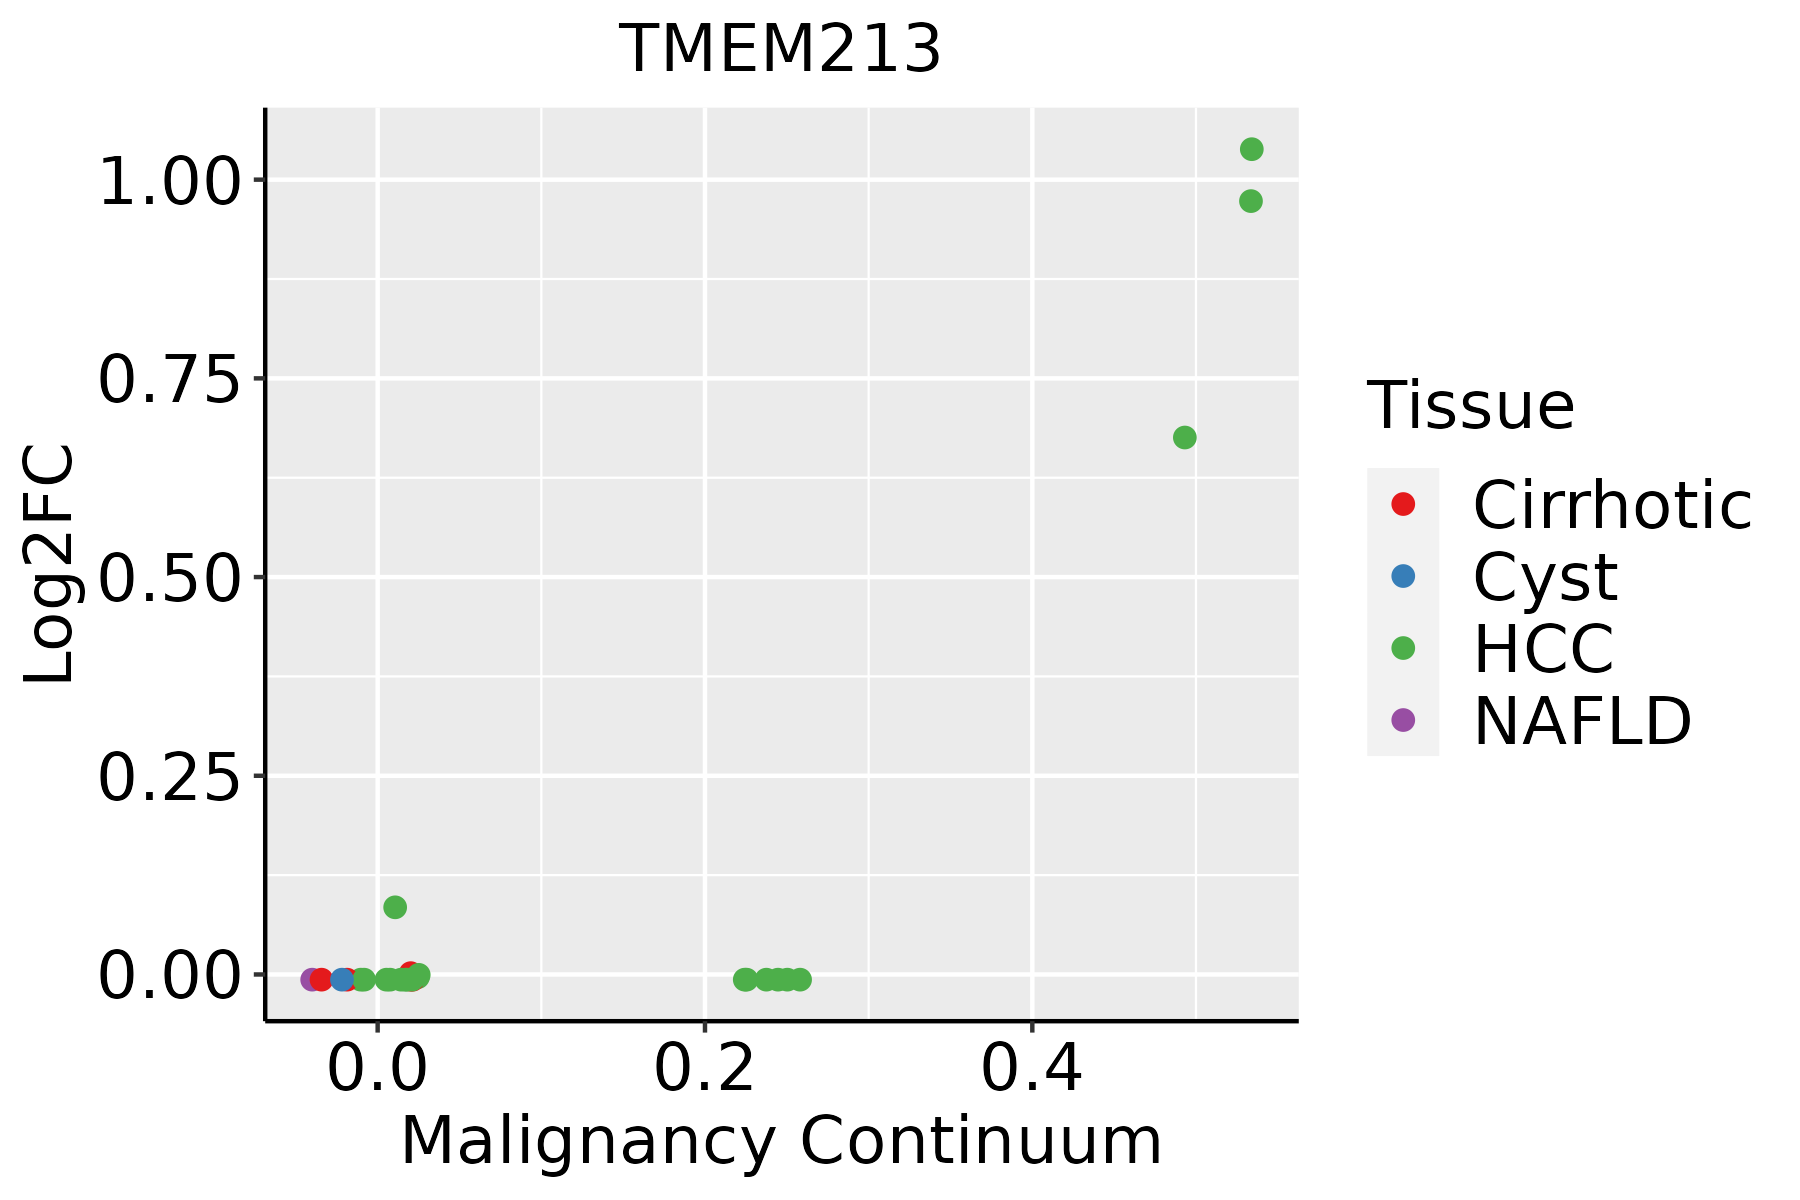 | HCC: Hepatocellular carcinoma |
| NAFLD: Non-alcoholic fatty liver disease | ||
| Lung | 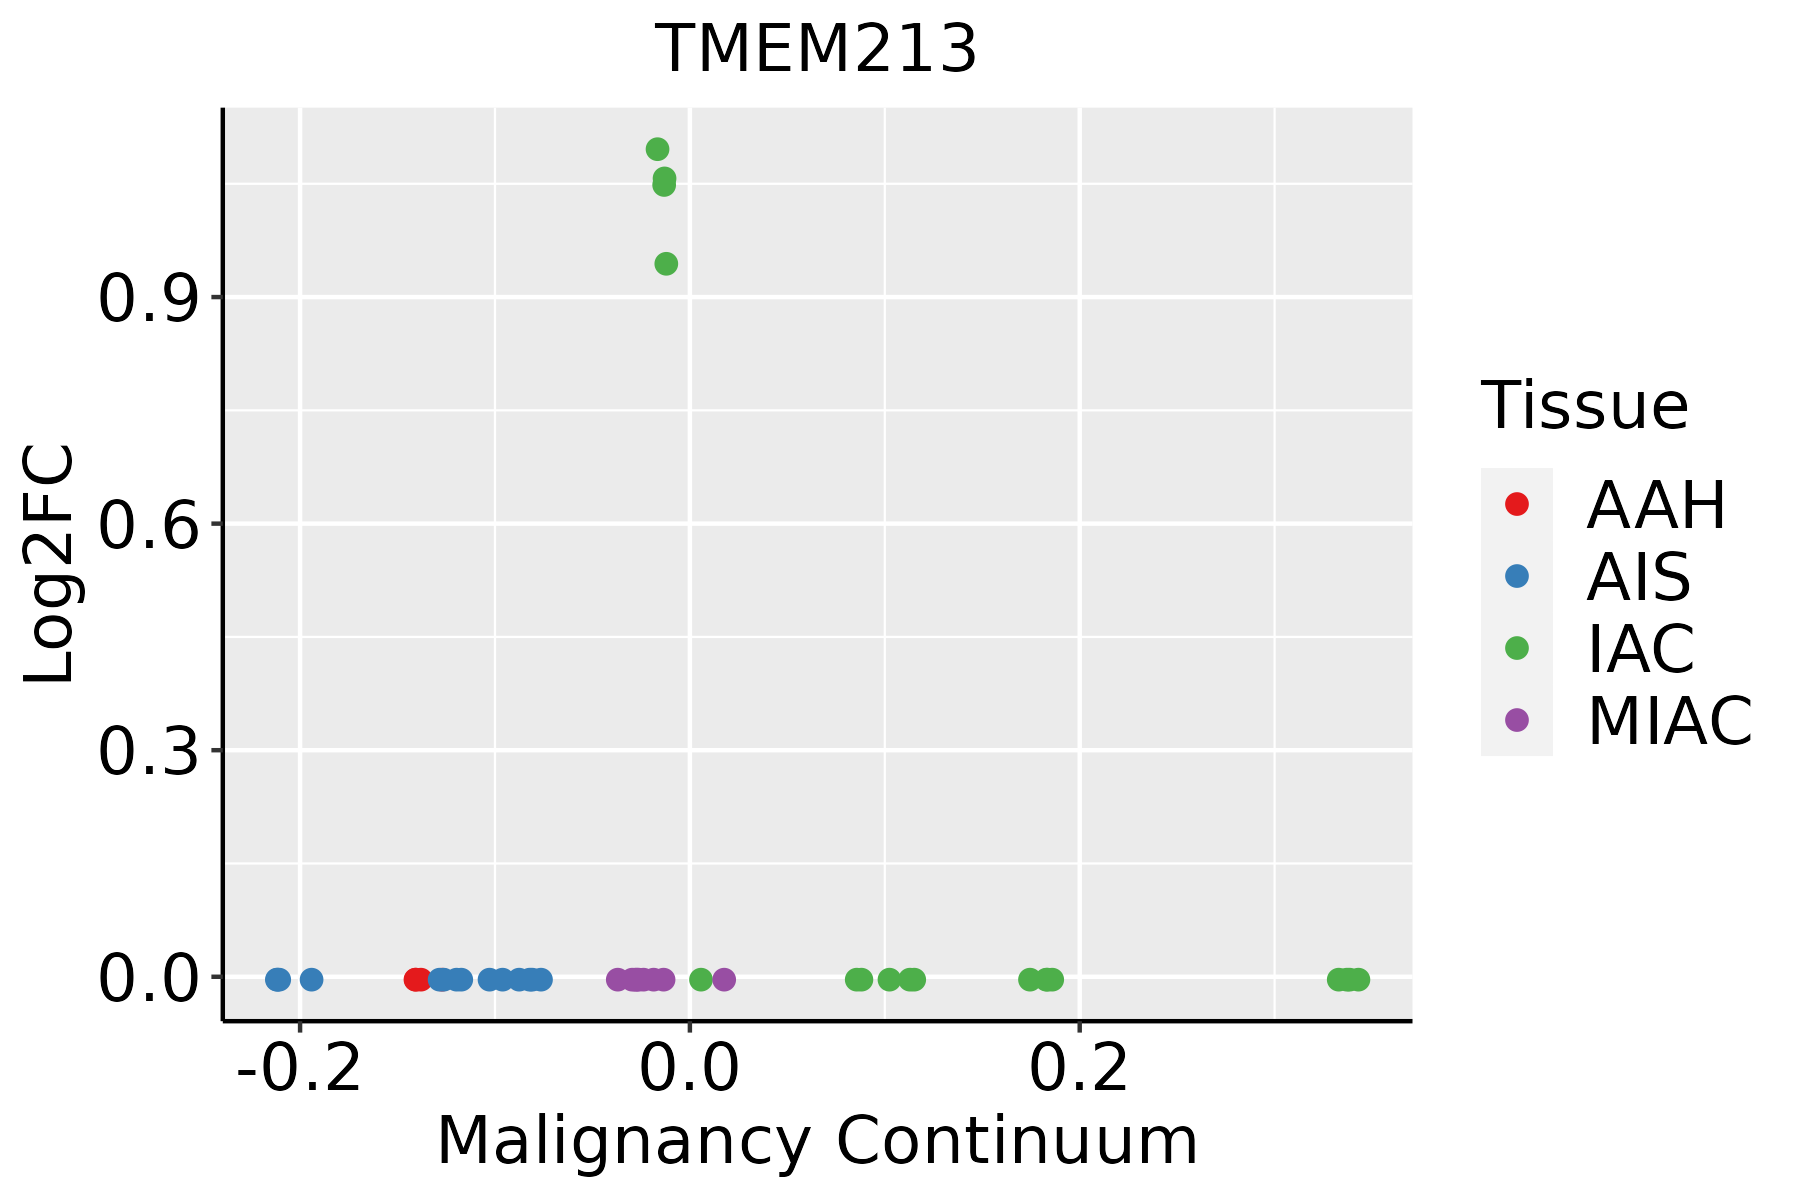 | AAH: Atypical adenomatous hyperplasia |
| AIS: Adenocarcinoma in situ | ||
| IAC: Invasive lung adenocarcinoma | ||
| MIA: Minimally invasive adenocarcinoma |
| ∗log2FC in expression of this searched gene in stem-like cells from each diseased tissue sample relative to stem-like cells in normal samples in each tissue plotted against the malignancy continuum. Samples are colored based on if they are from different disease stage. |
Top |
Malignant transformation related pathway analysis |
| Find out the enriched GO biological processes and KEGG pathways involved in transition from healthy to precancer to cancer |
| Tissue | Disease Stage | Enriched GO biological Processes |
| Colorectum | AD |  |
| Colorectum | SER |  |
| Colorectum | MSS |  |
| Colorectum | MSI-H |  |
| Colorectum | FAP |  |
| ∗Top 15 enriched GO BP terms are showed in the bar plot of each disease state in each tissue. Each row represents a significant GO biological process which is colored according to the -log10(p.adjust). |
| Page: 1 2 3 4 5 6 7 8 9 |
| GO ID | Tissue | Disease Stage | Description | Gene Ratio | Bg Ratio | pvalue | p.adjust | Count |
| Page: 1 |
| Pathway ID | Tissue | Disease Stage | Description | Gene Ratio | Bg Ratio | pvalue | p.adjust | qvalue | Count |
| Page: 1 |
Top |
Cell-cell communication analysis |
| Identification of potential cell-cell interactions between two cell types and their ligand-receptor pairs for different disease states |
| Ligand | Receptor | LRpair | Pathway | Tissue | Disease Stage |
| Page: 1 |
Top |
Single-cell gene regulatory network inference analysis |
| Find out the significant the regulons (TFs) and the target genes of each regulon across cell types for different disease states |
| TF | Cell Type | Tissue | Disease Stage | Target Gene | RSS | Regulon Activity |
| ∗The dot plots of a searched regulon are shown for all cell subpopulations in each disease state of each tissue based on the regulon specific score inferred using pySCENIC and by calculating the average expression. |
| Page: 1 |
Top |
Somatic mutation of malignant transformation related genes |
| Annotation of somatic variants for genes involved in malignant transformation |
| Hugo Symbol | Variant Class | Variant Classification | dbSNP RS | HGVSc | HGVSp | HGVSp Short | SWISSPROT | BIOTYPE | SIFT | PolyPhen | Tumor Sample Barcode | Tissue | Histology | Sex | Age | Stage | Therapy Types | Drugs | Outcome |
| TMEM213 | SNV | Missense_Mutation | c.179C>A | p.Ala60Asp | p.A60D | A2RRL7 | protein_coding | deleterious(0.03) | benign(0.139) | TCGA-CM-4747-01 | Colorectum | colon adenocarcinoma | Male | <65 | I/II | Chemotherapy | fluorouracil | SD | |
| TMEM213 | SNV | Missense_Mutation | rs770119379 | c.220G>A | p.Ala74Thr | p.A74T | A2RRL7 | protein_coding | deleterious(0) | benign(0.169) | TCGA-A5-A0G2-01 | Endometrium | uterine corpus endometrioid carcinoma | Female | <65 | III/IV | Unknown | Unknown | SD |
| TMEM213 | SNV | Missense_Mutation | rs763336540 | c.320C>T | p.Ala107Val | p.A107V | A2RRL7 | protein_coding | deleterious(0) | benign(0.046) | TCGA-A5-A0G2-01 | Endometrium | uterine corpus endometrioid carcinoma | Female | <65 | III/IV | Unknown | Unknown | SD |
| TMEM213 | SNV | Missense_Mutation | novel | c.250N>A | p.Leu84Ile | p.L84I | A2RRL7 | protein_coding | deleterious(0.03) | possibly_damaging(0.536) | TCGA-AJ-A2QO-01 | Endometrium | uterine corpus endometrioid carcinoma | Female | >=65 | I/II | Unknown | Unknown | SD |
| TMEM213 | SNV | Missense_Mutation | c.165C>A | p.Phe55Leu | p.F55L | A2RRL7 | protein_coding | deleterious(0.01) | benign(0.441) | TCGA-AX-A05Z-01 | Endometrium | uterine corpus endometrioid carcinoma | Female | <65 | III/IV | Chemotherapy | adriamycin | SD | |
| TMEM213 | SNV | Missense_Mutation | rs779847207 | c.115G>A | p.Ala39Thr | p.A39T | A2RRL7 | protein_coding | tolerated(1) | benign(0.007) | TCGA-D1-A168-01 | Endometrium | uterine corpus endometrioid carcinoma | Female | >=65 | I/II | Unknown | Unknown | SD |
| TMEM213 | SNV | Missense_Mutation | rs200196482 | c.274N>A | p.Asp92Asn | p.D92N | A2RRL7 | protein_coding | tolerated(0.13) | benign(0.066) | TCGA-FI-A2F8-01 | Endometrium | uterine corpus endometrioid carcinoma | Female | <65 | I/II | Chemotherapy | cisplatin | CR |
| TMEM213 | SNV | Missense_Mutation | novel | c.240N>A | p.Ser80Arg | p.S80R | A2RRL7 | protein_coding | deleterious(0) | probably_damaging(0.999) | TCGA-56-8625-01 | Lung | lung squamous cell carcinoma | Female | >=65 | III/IV | Chemotherapy | cisplatin | PD |
| TMEM213 | SNV | Missense_Mutation | rs200306735 | c.191G>A | p.Arg64His | p.R64H | A2RRL7 | protein_coding | tolerated(0.19) | benign(0) | TCGA-CV-7440-01 | Oral cavity | head & neck squamous cell carcinoma | Male | <65 | I/II | Unknown | Unknown | SD |
| TMEM213 | SNV | Missense_Mutation | rs780125224 | c.221N>T | p.Ala74Val | p.A74V | A2RRL7 | protein_coding | deleterious(0) | possibly_damaging(0.574) | TCGA-HU-A4GF-01 | Stomach | stomach adenocarcinoma | Male | >=65 | I/II | Unknown | Unknown | SD |
| Page: 1 2 |
Top |
Related drugs of malignant transformation related genes |
| Identification of chemicals and drugs interact with genes involved in malignant transfromation |
| (DGIdb 4.0) |
| Entrez ID | Symbol | Category | Interaction Types | Drug Claim Name | Drug Name | PMIDs |
| Page: 1 |

Copyright 2023-Present -The University of Texas Health Science Center at Houston |