
|
|||||
|
 | |
| |
| |
| |
| |
| |
|
Gene: TMEM212 |
Gene summary for TMEM212 |
| Gene information | Species | Human | Gene symbol | TMEM212 | Gene ID | 389177 |
| Gene name | transmembrane protein 212 | |
| Gene Alias | TMEM212 | |
| Cytomap | 3q26.31 | |
| Gene Type | protein-coding | GO ID | GO:0005575 | UniProtAcc | A6NML5 |
Top |
Malignant transformation analysis |
| Identification of the aberrant gene expression in precancerous and cancerous lesions by comparing the gene expression of stem-like cells in diseased tissues with normal stem cells |
| Entrez ID | Symbol | Replicates | Species | Organ | Tissue | Adj P-value | Log2FC | Malignancy |
| 389177 | TMEM212 | HCC1 | Human | Liver | HCC | 2.64e-38 | 4.22e+00 | 0.5336 |
| 389177 | TMEM212 | HCC2 | Human | Liver | HCC | 1.82e-55 | 4.41e+00 | 0.5341 |
| 389177 | TMEM212 | HCC5 | Human | Liver | HCC | 1.01e-23 | 2.70e+00 | 0.4932 |
| Page: 1 |
| Tissue | Expression Dynamics | Abbreviation |
| Liver | 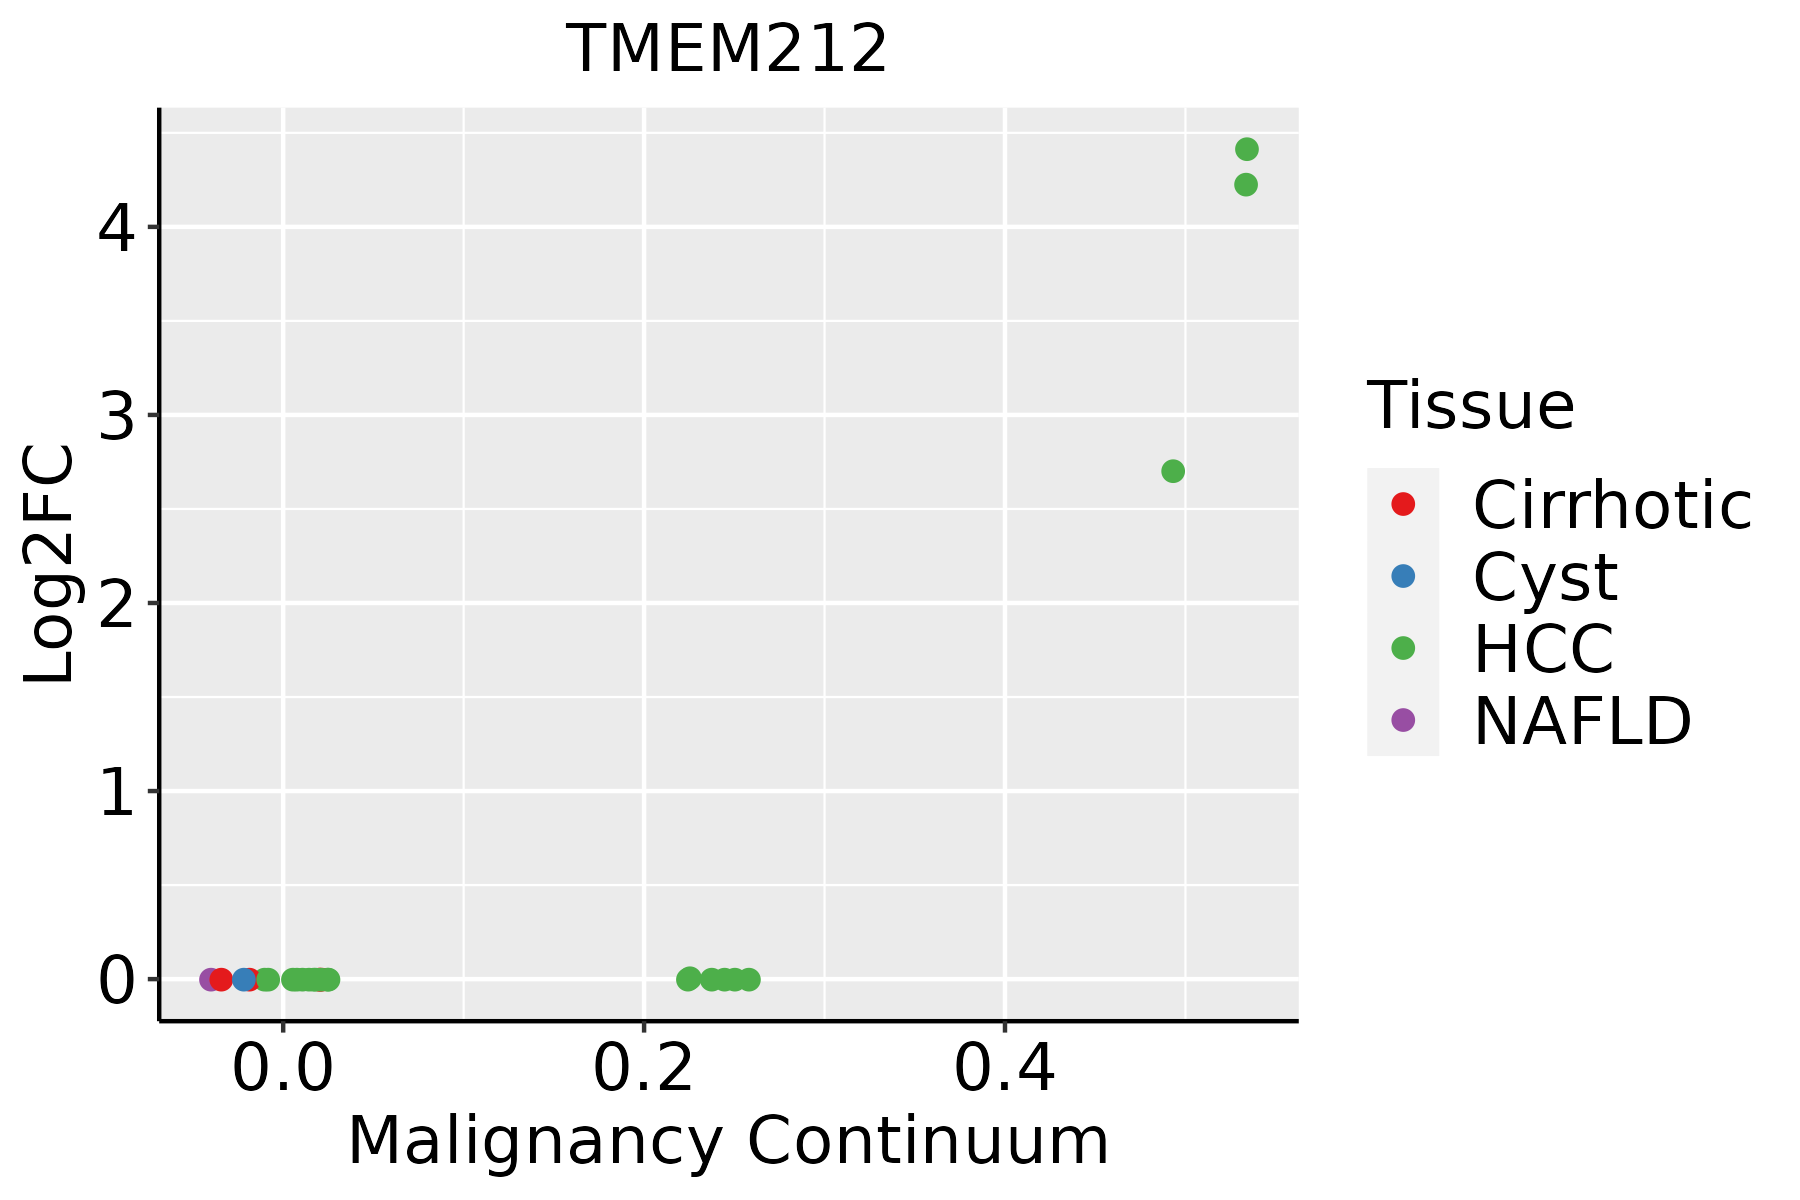 | HCC: Hepatocellular carcinoma |
| NAFLD: Non-alcoholic fatty liver disease |
| ∗log2FC in expression of this searched gene in stem-like cells from each diseased tissue sample relative to stem-like cells in normal samples in each tissue plotted against the malignancy continuum. Samples are colored based on if they are from different disease stage. |
Top |
Malignant transformation related pathway analysis |
| Find out the enriched GO biological processes and KEGG pathways involved in transition from healthy to precancer to cancer |
| Tissue | Disease Stage | Enriched GO biological Processes |
| Colorectum | AD |  |
| Colorectum | SER |  |
| Colorectum | MSS |  |
| Colorectum | MSI-H |  |
| Colorectum | FAP |  |
| ∗Top 15 enriched GO BP terms are showed in the bar plot of each disease state in each tissue. Each row represents a significant GO biological process which is colored according to the -log10(p.adjust). |
| Page: 1 2 3 4 5 6 7 8 9 |
| GO ID | Tissue | Disease Stage | Description | Gene Ratio | Bg Ratio | pvalue | p.adjust | Count |
| Page: 1 |
| Pathway ID | Tissue | Disease Stage | Description | Gene Ratio | Bg Ratio | pvalue | p.adjust | qvalue | Count |
| Page: 1 |
Top |
Cell-cell communication analysis |
| Identification of potential cell-cell interactions between two cell types and their ligand-receptor pairs for different disease states |
| Ligand | Receptor | LRpair | Pathway | Tissue | Disease Stage |
| Page: 1 |
Top |
Single-cell gene regulatory network inference analysis |
| Find out the significant the regulons (TFs) and the target genes of each regulon across cell types for different disease states |
| TF | Cell Type | Tissue | Disease Stage | Target Gene | RSS | Regulon Activity |
| ∗The dot plots of a searched regulon are shown for all cell subpopulations in each disease state of each tissue based on the regulon specific score inferred using pySCENIC and by calculating the average expression. |
| Page: 1 |
Top |
Somatic mutation of malignant transformation related genes |
| Annotation of somatic variants for genes involved in malignant transformation |
| Hugo Symbol | Variant Class | Variant Classification | dbSNP RS | HGVSc | HGVSp | HGVSp Short | SWISSPROT | BIOTYPE | SIFT | PolyPhen | Tumor Sample Barcode | Tissue | Histology | Sex | Age | Stage | Therapy Types | Drugs | Outcome |
| TMEM212 | SNV | Missense_Mutation | c.355N>A | p.Gly119Ser | p.G119S | A6NML5 | protein_coding | tolerated(0.11) | probably_damaging(1) | TCGA-AC-A6IW-01 | Breast | breast invasive carcinoma | Female | >=65 | I/II | Unknown | Unknown | SD | |
| TMEM212 | SNV | Missense_Mutation | rs746133172 | c.368C>T | p.Thr123Ile | p.T123I | A6NML5 | protein_coding | tolerated(0.17) | benign(0.024) | TCGA-D8-A73W-01 | Breast | breast invasive carcinoma | Female | >=65 | III/IV | Hormone Therapy | tamoxiphen | PD |
| TMEM212 | insertion | Nonsense_Mutation | novel | c.413_414insTAGTGTGCACACAACTGGCTCATCTTTCTAA | p.Pro139SerfsTer10 | p.P139Sfs*10 | A6NML5 | protein_coding | TCGA-A2-A0ER-01 | Breast | breast invasive carcinoma | Female | <65 | I/II | Chemotherapy | cytoxan | SD | ||
| TMEM212 | insertion | In_Frame_Ins | novel | c.281_282insCTACACCAG | p.Ile94_Ala95insTyrThrArg | p.I94_A95insYTR | A6NML5 | protein_coding | TCGA-AR-A0U0-01 | Breast | breast invasive carcinoma | Female | >=65 | I/II | Unknown | Unknown | SD | ||
| TMEM212 | SNV | Missense_Mutation | novel | c.178N>A | p.Leu60Ile | p.L60I | A6NML5 | protein_coding | deleterious(0.02) | probably_damaging(0.936) | TCGA-A5-A2K5-01 | Endometrium | uterine corpus endometrioid carcinoma | Female | >=65 | I/II | Unknown | Unknown | SD |
| TMEM212 | SNV | Missense_Mutation | c.187T>G | p.Leu63Val | p.L63V | A6NML5 | protein_coding | deleterious(0.05) | benign(0.037) | TCGA-AX-A2H5-01 | Endometrium | uterine corpus endometrioid carcinoma | Female | >=65 | III/IV | Chemotherapy | carboplatin | CR | |
| TMEM212 | SNV | Missense_Mutation | rs377114413 | c.29N>A | p.Arg10Gln | p.R10Q | A6NML5 | protein_coding | tolerated(0.35) | benign(0.006) | TCGA-AX-A2HG-01 | Endometrium | uterine corpus endometrioid carcinoma | Female | <65 | I/II | Unknown | Unknown | SD |
| TMEM212 | SNV | Missense_Mutation | novel | c.220N>A | p.Gly74Arg | p.G74R | A6NML5 | protein_coding | deleterious(0.04) | benign(0.003) | TCGA-B5-A3FA-01 | Endometrium | uterine corpus endometrioid carcinoma | Female | >=65 | I/II | Unknown | Unknown | SD |
| TMEM212 | SNV | Missense_Mutation | c.318N>A | p.Phe106Leu | p.F106L | A6NML5 | protein_coding | deleterious(0.04) | benign(0.015) | TCGA-D1-A17Q-01 | Endometrium | uterine corpus endometrioid carcinoma | Female | <65 | I/II | Unknown | Unknown | SD | |
| TMEM212 | SNV | Missense_Mutation | novel | c.542N>G | p.Asn181Ser | p.N181S | A6NML5 | protein_coding | deleterious(0.04) | benign(0.057) | TCGA-DI-A1BU-01 | Endometrium | uterine corpus endometrioid carcinoma | Female | <65 | I/II | Chemotherapy | paclitaxel | SD |
| Page: 1 2 |
Top |
Related drugs of malignant transformation related genes |
| Identification of chemicals and drugs interact with genes involved in malignant transfromation |
| (DGIdb 4.0) |
| Entrez ID | Symbol | Category | Interaction Types | Drug Claim Name | Drug Name | PMIDs |
| Page: 1 |

Copyright 2023-Present -The University of Texas Health Science Center at Houston |