
|
|||||
|
 | |
| |
| |
| |
| |
| |
|
Gene: TMEM209 |
Gene summary for TMEM209 |
| Gene information | Species | Human | Gene symbol | TMEM209 | Gene ID | 84928 |
| Gene name | transmembrane protein 209 | |
| Gene Alias | NET31 | |
| Cytomap | 7q32.2 | |
| Gene Type | protein-coding | GO ID | GO:0005575 | UniProtAcc | Q96SK2 |
Top |
Malignant transformation analysis |
| Identification of the aberrant gene expression in precancerous and cancerous lesions by comparing the gene expression of stem-like cells in diseased tissues with normal stem cells |
| Entrez ID | Symbol | Replicates | Species | Organ | Tissue | Adj P-value | Log2FC | Malignancy |
| 84928 | TMEM209 | LZE2T | Human | Esophagus | ESCC | 4.73e-03 | 2.96e-01 | 0.082 |
| 84928 | TMEM209 | LZE7T | Human | Esophagus | ESCC | 1.40e-08 | 3.23e-01 | 0.0667 |
| 84928 | TMEM209 | LZE20T | Human | Esophagus | ESCC | 1.26e-02 | 1.30e-01 | 0.0662 |
| 84928 | TMEM209 | LZE24T | Human | Esophagus | ESCC | 5.64e-10 | 2.14e-01 | 0.0596 |
| 84928 | TMEM209 | LZE6T | Human | Esophagus | ESCC | 2.96e-03 | 1.76e-01 | 0.0845 |
| 84928 | TMEM209 | P1T-E | Human | Esophagus | ESCC | 4.62e-03 | 1.73e-01 | 0.0875 |
| 84928 | TMEM209 | P2T-E | Human | Esophagus | ESCC | 7.40e-20 | 2.26e-01 | 0.1177 |
| 84928 | TMEM209 | P4T-E | Human | Esophagus | ESCC | 3.18e-14 | 2.86e-01 | 0.1323 |
| 84928 | TMEM209 | P5T-E | Human | Esophagus | ESCC | 1.66e-11 | 2.85e-01 | 0.1327 |
| 84928 | TMEM209 | P8T-E | Human | Esophagus | ESCC | 5.96e-07 | 2.01e-01 | 0.0889 |
| 84928 | TMEM209 | P9T-E | Human | Esophagus | ESCC | 8.38e-03 | 1.30e-01 | 0.1131 |
| 84928 | TMEM209 | P10T-E | Human | Esophagus | ESCC | 1.55e-11 | 2.68e-01 | 0.116 |
| 84928 | TMEM209 | P11T-E | Human | Esophagus | ESCC | 3.25e-05 | 1.81e-01 | 0.1426 |
| 84928 | TMEM209 | P12T-E | Human | Esophagus | ESCC | 9.64e-22 | 5.33e-01 | 0.1122 |
| 84928 | TMEM209 | P15T-E | Human | Esophagus | ESCC | 2.27e-23 | 4.37e-01 | 0.1149 |
| 84928 | TMEM209 | P16T-E | Human | Esophagus | ESCC | 8.40e-11 | 2.84e-01 | 0.1153 |
| 84928 | TMEM209 | P17T-E | Human | Esophagus | ESCC | 2.68e-03 | 1.62e-01 | 0.1278 |
| 84928 | TMEM209 | P20T-E | Human | Esophagus | ESCC | 2.86e-10 | 2.21e-01 | 0.1124 |
| 84928 | TMEM209 | P21T-E | Human | Esophagus | ESCC | 6.84e-23 | 4.64e-01 | 0.1617 |
| 84928 | TMEM209 | P22T-E | Human | Esophagus | ESCC | 9.21e-10 | 1.03e-01 | 0.1236 |
| Page: 1 2 3 4 |
| Tissue | Expression Dynamics | Abbreviation |
| Esophagus | 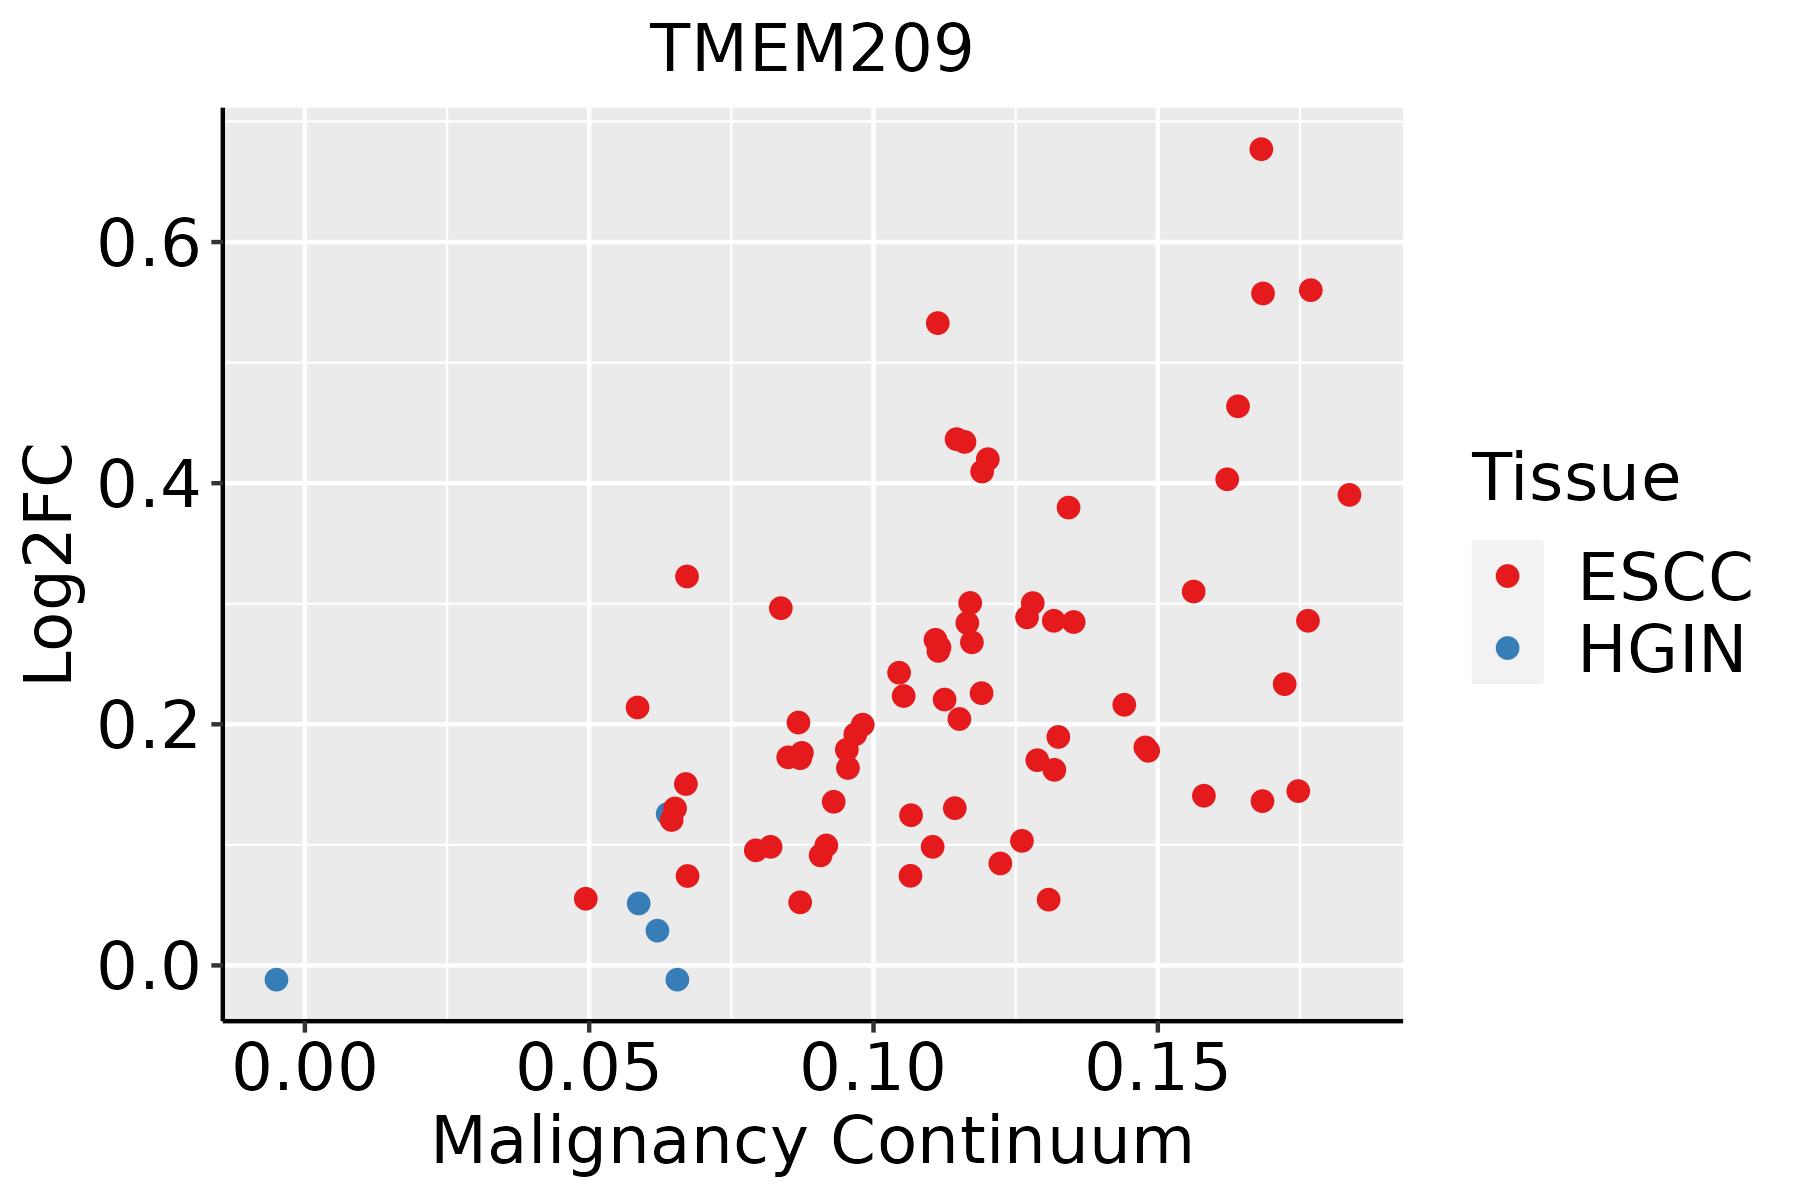 | ESCC: Esophageal squamous cell carcinoma |
| HGIN: High-grade intraepithelial neoplasias | ||
| LGIN: Low-grade intraepithelial neoplasias | ||
| Liver | 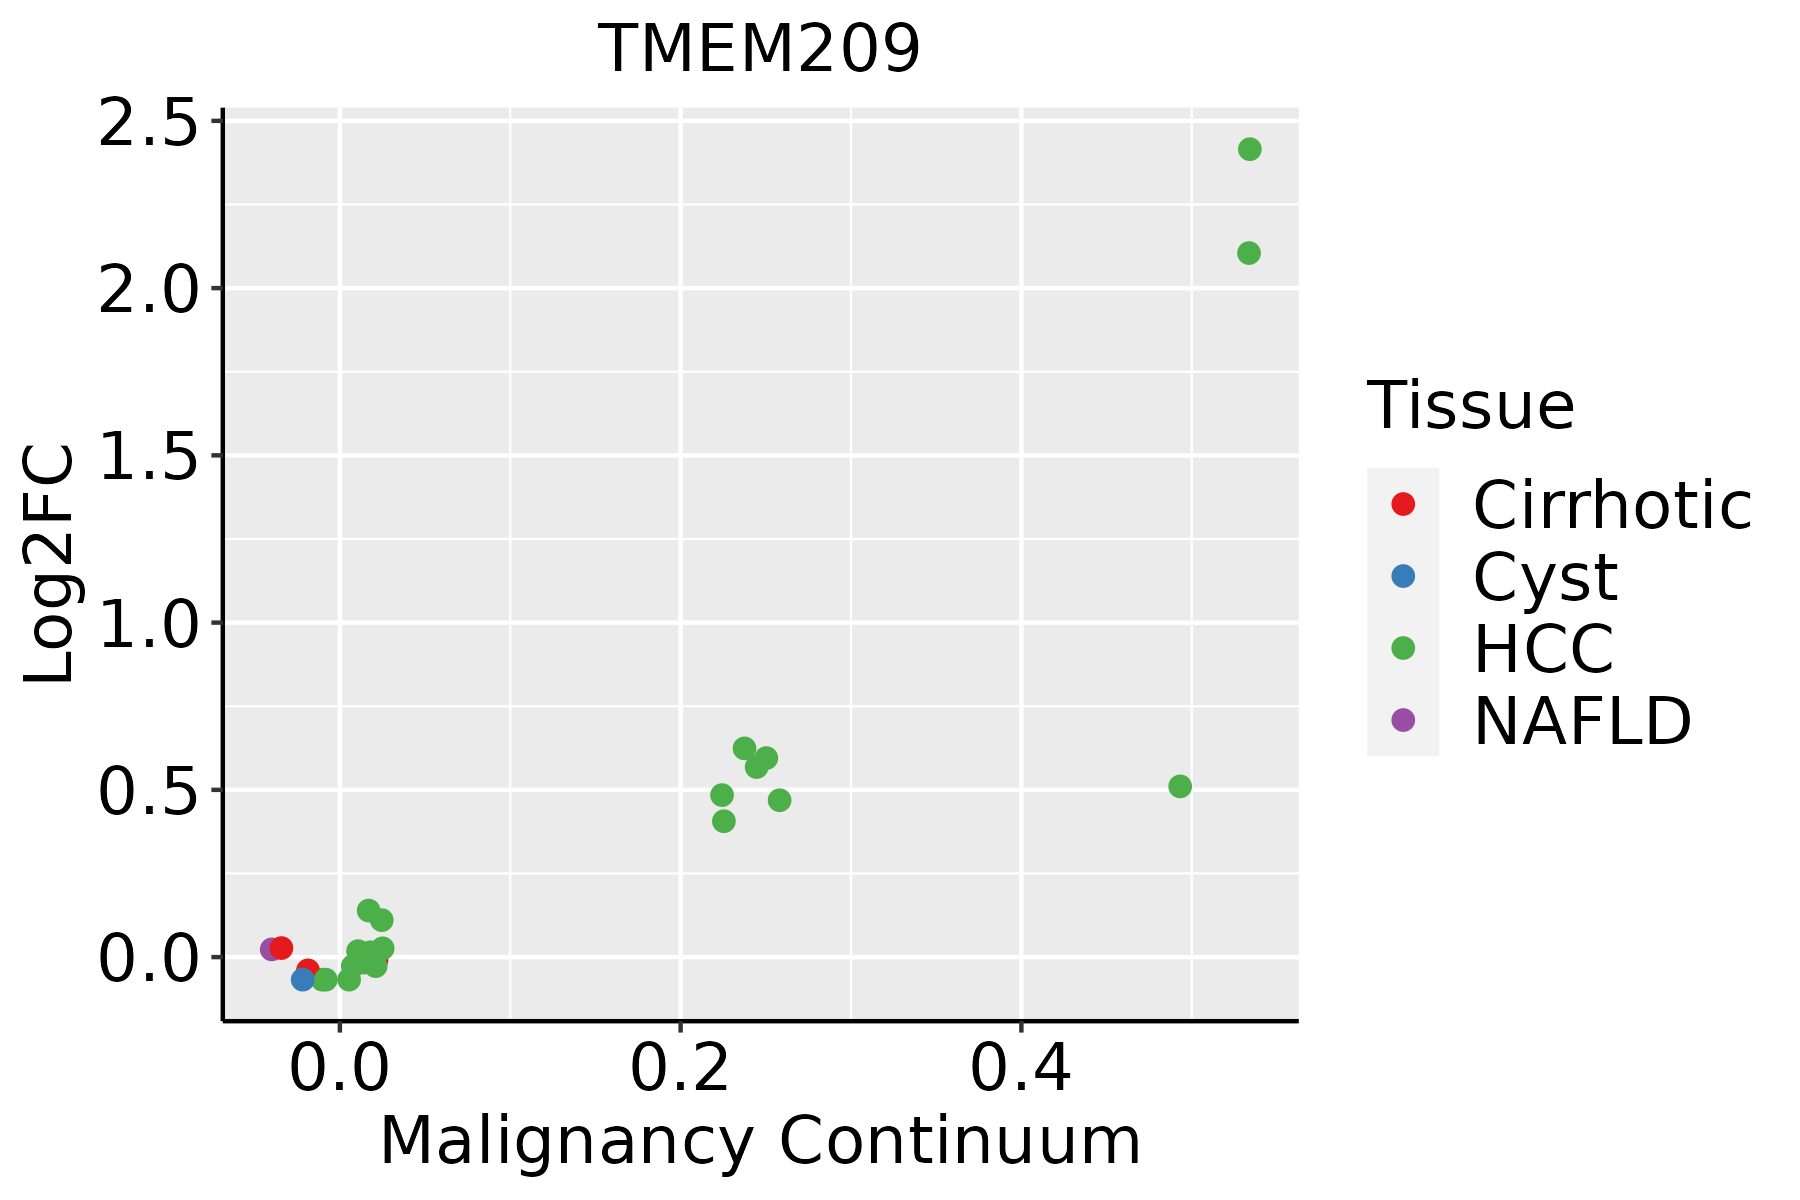 | HCC: Hepatocellular carcinoma |
| NAFLD: Non-alcoholic fatty liver disease |
| ∗log2FC in expression of this searched gene in stem-like cells from each diseased tissue sample relative to stem-like cells in normal samples in each tissue plotted against the malignancy continuum. Samples are colored based on if they are from different disease stage. |
Top |
Malignant transformation related pathway analysis |
| Find out the enriched GO biological processes and KEGG pathways involved in transition from healthy to precancer to cancer |
| Tissue | Disease Stage | Enriched GO biological Processes |
| Colorectum | AD |  |
| Colorectum | SER |  |
| Colorectum | MSS |  |
| Colorectum | MSI-H |  |
| Colorectum | FAP |  |
| ∗Top 15 enriched GO BP terms are showed in the bar plot of each disease state in each tissue. Each row represents a significant GO biological process which is colored according to the -log10(p.adjust). |
| Page: 1 2 3 4 5 6 7 8 9 |
| GO ID | Tissue | Disease Stage | Description | Gene Ratio | Bg Ratio | pvalue | p.adjust | Count |
| Page: 1 |
| Pathway ID | Tissue | Disease Stage | Description | Gene Ratio | Bg Ratio | pvalue | p.adjust | qvalue | Count |
| Page: 1 |
Top |
Cell-cell communication analysis |
| Identification of potential cell-cell interactions between two cell types and their ligand-receptor pairs for different disease states |
| Ligand | Receptor | LRpair | Pathway | Tissue | Disease Stage |
| Page: 1 |
Top |
Single-cell gene regulatory network inference analysis |
| Find out the significant the regulons (TFs) and the target genes of each regulon across cell types for different disease states |
| TF | Cell Type | Tissue | Disease Stage | Target Gene | RSS | Regulon Activity |
| ∗The dot plots of a searched regulon are shown for all cell subpopulations in each disease state of each tissue based on the regulon specific score inferred using pySCENIC and by calculating the average expression. |
| Page: 1 |
Top |
Somatic mutation of malignant transformation related genes |
| Annotation of somatic variants for genes involved in malignant transformation |
| Hugo Symbol | Variant Class | Variant Classification | dbSNP RS | HGVSc | HGVSp | HGVSp Short | SWISSPROT | BIOTYPE | SIFT | PolyPhen | Tumor Sample Barcode | Tissue | Histology | Sex | Age | Stage | Therapy Types | Drugs | Outcome |
| TMEM209 | SNV | Missense_Mutation | c.736N>T | p.Leu246Phe | p.L246F | Q96SK2 | protein_coding | deleterious(0.01) | probably_damaging(0.995) | TCGA-A8-A081-01 | Breast | breast invasive carcinoma | Female | >=65 | I/II | Unknown | Unknown | SD | |
| TMEM209 | SNV | Missense_Mutation | c.424N>A | p.Tyr142Asn | p.Y142N | Q96SK2 | protein_coding | deleterious(0.02) | probably_damaging(0.929) | TCGA-C8-A1HJ-01 | Breast | breast invasive carcinoma | Female | <65 | I/II | Unknown | Unknown | SD | |
| TMEM209 | SNV | Missense_Mutation | c.1030N>G | p.Asn344Asp | p.N344D | Q96SK2 | protein_coding | tolerated(0.06) | benign(0.089) | TCGA-D8-A1XQ-01 | Breast | breast invasive carcinoma | Female | >=65 | I/II | Unknown | Unknown | SD | |
| TMEM209 | SNV | Missense_Mutation | novel | c.1060N>C | p.Glu354Gln | p.E354Q | Q96SK2 | protein_coding | deleterious(0) | possibly_damaging(0.86) | TCGA-XX-A89A-01 | Breast | breast invasive carcinoma | Female | >=65 | I/II | Unknown | Unknown | SD |
| TMEM209 | deletion | Frame_Shift_Del | novel | c.13delN | p.Glu5ArgfsTer15 | p.E5Rfs*15 | Q96SK2 | protein_coding | TCGA-EW-A2FV-01 | Breast | breast invasive carcinoma | Female | <65 | III/IV | Chemotherapy | docetaxel | SD | ||
| TMEM209 | SNV | Missense_Mutation | novel | c.1253C>A | p.Ser418Tyr | p.S418Y | Q96SK2 | protein_coding | deleterious(0) | possibly_damaging(0.452) | TCGA-2W-A8YY-01 | Cervix | cervical & endocervical cancer | Female | <65 | I/II | Chemotherapy | cisplatin | CR |
| TMEM209 | SNV | Missense_Mutation | c.1289N>A | p.Arg430Lys | p.R430K | Q96SK2 | protein_coding | tolerated(1) | benign(0.003) | TCGA-EA-A3QD-01 | Cervix | cervical & endocervical cancer | Female | <65 | III/IV | Chemotherapy | cisplatin | CR | |
| TMEM209 | SNV | Missense_Mutation | c.645N>C | p.Leu215Phe | p.L215F | Q96SK2 | protein_coding | tolerated(0.16) | possibly_damaging(0.875) | TCGA-EK-A2PG-01 | Cervix | cervical & endocervical cancer | Female | >=65 | I/II | Unknown | Unknown | SD | |
| TMEM209 | SNV | Missense_Mutation | c.1105N>C | p.Glu369Gln | p.E369Q | Q96SK2 | protein_coding | deleterious(0.01) | possibly_damaging(0.721) | TCGA-VS-A8EL-01 | Cervix | cervical & endocervical cancer | Female | <65 | I/II | Chemotherapy | cisplatin | CR | |
| TMEM209 | SNV | Missense_Mutation | c.574N>G | p.Leu192Val | p.L192V | Q96SK2 | protein_coding | tolerated(0.51) | benign(0) | TCGA-AA-3510-01 | Colorectum | colon adenocarcinoma | Male | >=65 | I/II | Unknown | Unknown | SD |
| Page: 1 2 3 4 5 |
Top |
Related drugs of malignant transformation related genes |
| Identification of chemicals and drugs interact with genes involved in malignant transfromation |
| (DGIdb 4.0) |
| Entrez ID | Symbol | Category | Interaction Types | Drug Claim Name | Drug Name | PMIDs |
| Page: 1 |

Copyright 2023-Present -The University of Texas Health Science Center at Houston |