
|
|||||
|
 | |
| |
| |
| |
| |
| |
|
Gene: TMEM199 |
Gene summary for TMEM199 |
| Gene information | Species | Human | Gene symbol | TMEM199 | Gene ID | 147007 |
| Gene name | transmembrane protein 199 | |
| Gene Alias | C17orf32 | |
| Cytomap | 17q11.2 | |
| Gene Type | protein-coding | GO ID | GO:0006807 | UniProtAcc | Q8N511 |
Top |
Malignant transformation analysis |
| Identification of the aberrant gene expression in precancerous and cancerous lesions by comparing the gene expression of stem-like cells in diseased tissues with normal stem cells |
| Entrez ID | Symbol | Replicates | Species | Organ | Tissue | Adj P-value | Log2FC | Malignancy |
| 147007 | TMEM199 | LZE4T | Human | Esophagus | ESCC | 1.24e-04 | 2.37e-01 | 0.0811 |
| 147007 | TMEM199 | LZE7T | Human | Esophagus | ESCC | 7.64e-08 | 4.53e-01 | 0.0667 |
| 147007 | TMEM199 | LZE8T | Human | Esophagus | ESCC | 2.71e-06 | 2.62e-01 | 0.067 |
| 147007 | TMEM199 | LZE24T | Human | Esophagus | ESCC | 8.15e-19 | 4.94e-01 | 0.0596 |
| 147007 | TMEM199 | LZE6T | Human | Esophagus | ESCC | 4.90e-03 | 2.42e-01 | 0.0845 |
| 147007 | TMEM199 | P1T-E | Human | Esophagus | ESCC | 2.19e-05 | 3.41e-01 | 0.0875 |
| 147007 | TMEM199 | P2T-E | Human | Esophagus | ESCC | 4.70e-21 | 4.30e-01 | 0.1177 |
| 147007 | TMEM199 | P4T-E | Human | Esophagus | ESCC | 8.73e-29 | 5.96e-01 | 0.1323 |
| 147007 | TMEM199 | P5T-E | Human | Esophagus | ESCC | 3.05e-16 | 3.69e-01 | 0.1327 |
| 147007 | TMEM199 | P8T-E | Human | Esophagus | ESCC | 4.79e-12 | 2.91e-01 | 0.0889 |
| 147007 | TMEM199 | P9T-E | Human | Esophagus | ESCC | 1.19e-10 | 2.72e-01 | 0.1131 |
| 147007 | TMEM199 | P10T-E | Human | Esophagus | ESCC | 1.98e-29 | 5.38e-01 | 0.116 |
| 147007 | TMEM199 | P11T-E | Human | Esophagus | ESCC | 1.46e-13 | 5.61e-01 | 0.1426 |
| 147007 | TMEM199 | P12T-E | Human | Esophagus | ESCC | 8.73e-30 | 5.71e-01 | 0.1122 |
| 147007 | TMEM199 | P15T-E | Human | Esophagus | ESCC | 3.41e-22 | 5.07e-01 | 0.1149 |
| 147007 | TMEM199 | P16T-E | Human | Esophagus | ESCC | 1.67e-26 | 4.89e-01 | 0.1153 |
| 147007 | TMEM199 | P17T-E | Human | Esophagus | ESCC | 4.62e-08 | 3.77e-01 | 0.1278 |
| 147007 | TMEM199 | P19T-E | Human | Esophagus | ESCC | 1.24e-06 | 6.49e-01 | 0.1662 |
| 147007 | TMEM199 | P20T-E | Human | Esophagus | ESCC | 2.48e-22 | 4.70e-01 | 0.1124 |
| 147007 | TMEM199 | P21T-E | Human | Esophagus | ESCC | 2.06e-43 | 7.96e-01 | 0.1617 |
| Page: 1 2 3 4 5 |
| Tissue | Expression Dynamics | Abbreviation |
| Esophagus | 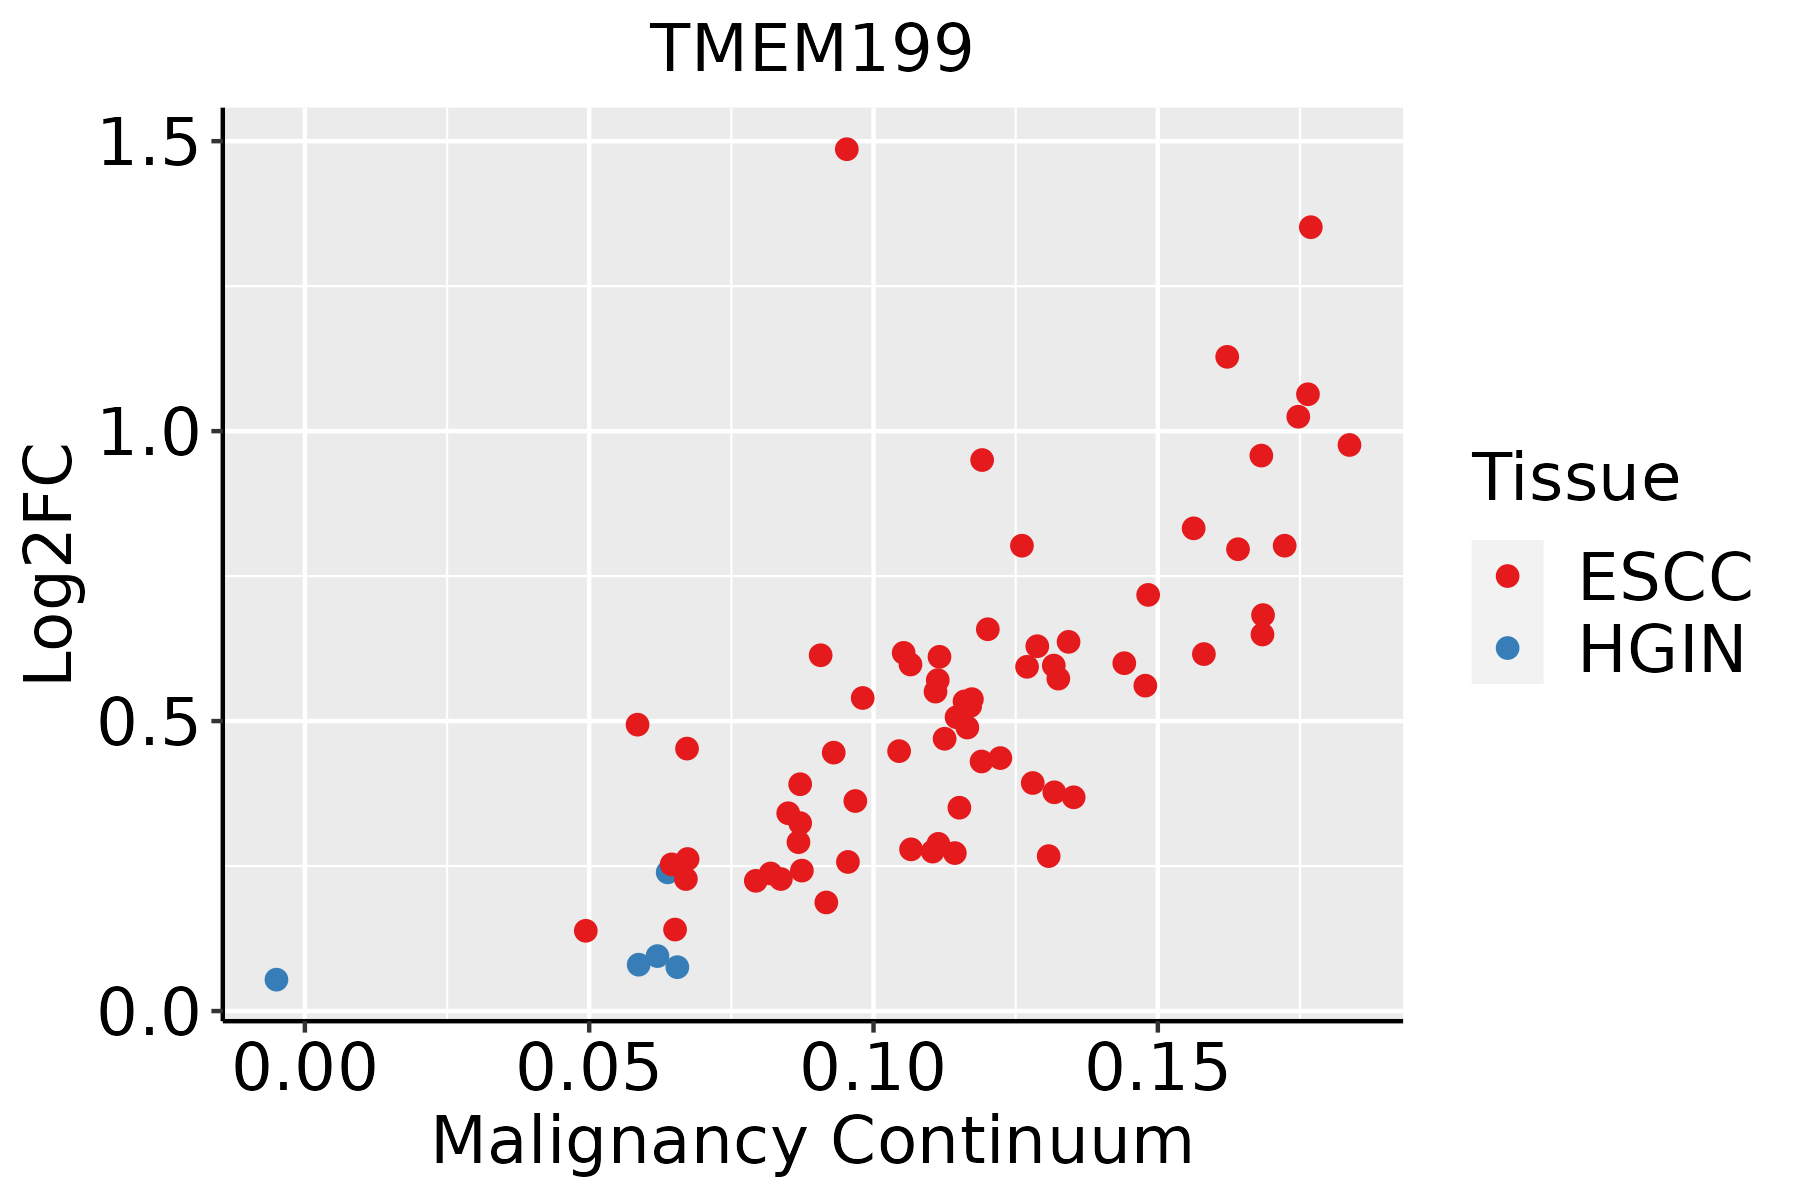 | ESCC: Esophageal squamous cell carcinoma |
| HGIN: High-grade intraepithelial neoplasias | ||
| LGIN: Low-grade intraepithelial neoplasias | ||
| Liver | 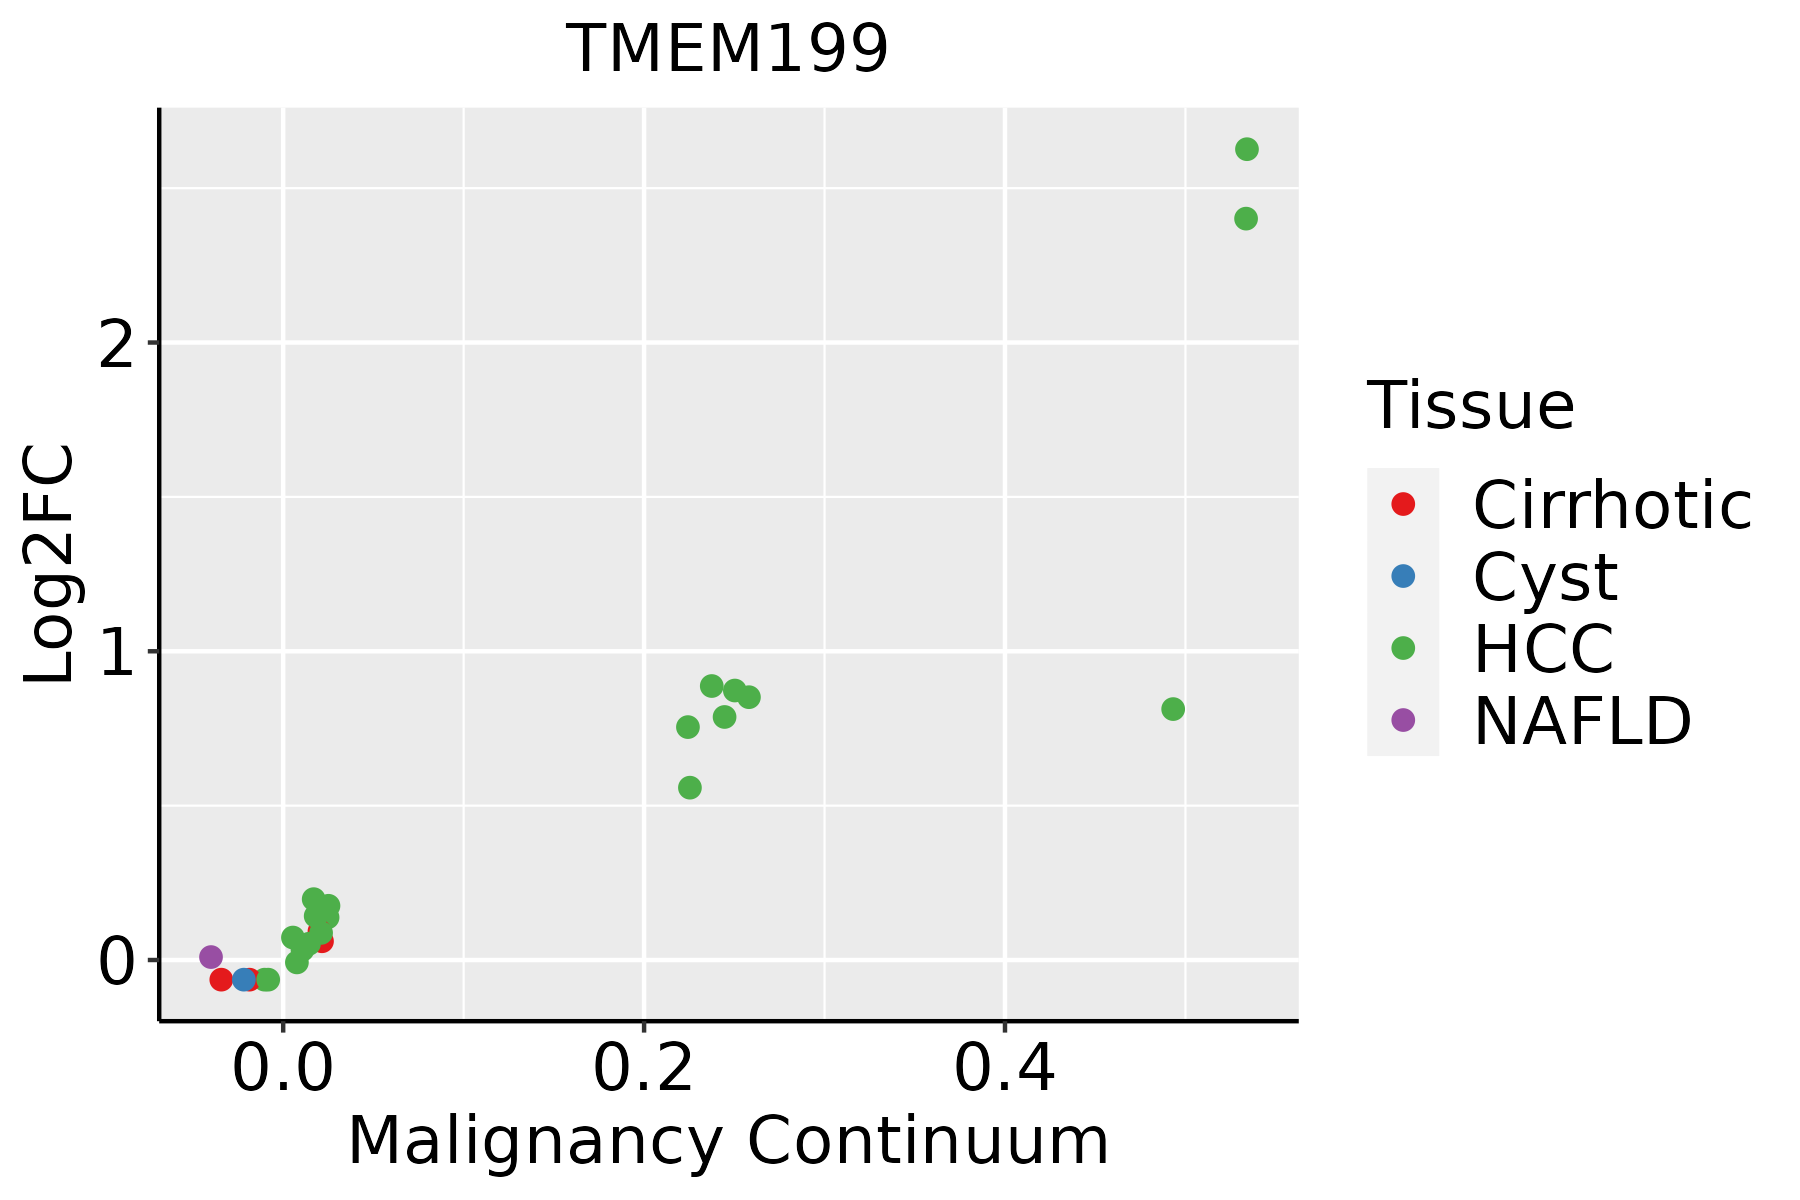 | HCC: Hepatocellular carcinoma |
| NAFLD: Non-alcoholic fatty liver disease | ||
| Oral Cavity |  | EOLP: Erosive Oral lichen planus |
| LP: leukoplakia | ||
| NEOLP: Non-erosive oral lichen planus | ||
| OSCC: Oral squamous cell carcinoma | ||
| Skin |  | AK: Actinic keratosis |
| cSCC: Cutaneous squamous cell carcinoma | ||
| SCCIS:squamous cell carcinoma in situ |
| ∗log2FC in expression of this searched gene in stem-like cells from each diseased tissue sample relative to stem-like cells in normal samples in each tissue plotted against the malignancy continuum. Samples are colored based on if they are from different disease stage. |
Top |
Malignant transformation related pathway analysis |
| Find out the enriched GO biological processes and KEGG pathways involved in transition from healthy to precancer to cancer |
| Tissue | Disease Stage | Enriched GO biological Processes |
| Colorectum | AD |  |
| Colorectum | SER |  |
| Colorectum | MSS |  |
| Colorectum | MSI-H |  |
| Colorectum | FAP |  |
| ∗Top 15 enriched GO BP terms are showed in the bar plot of each disease state in each tissue. Each row represents a significant GO biological process which is colored according to the -log10(p.adjust). |
| Page: 1 2 3 4 5 6 7 8 9 |
| GO ID | Tissue | Disease Stage | Description | Gene Ratio | Bg Ratio | pvalue | p.adjust | Count |
| GO:000703314 | Esophagus | ESCC | vacuole organization | 127/8552 | 180/18723 | 1.04e-11 | 3.85e-10 | 127 |
| GO:0070482111 | Esophagus | ESCC | response to oxygen levels | 218/8552 | 347/18723 | 6.91e-11 | 2.17e-09 | 218 |
| GO:0071453110 | Esophagus | ESCC | cellular response to oxygen levels | 114/8552 | 177/18723 | 3.63e-07 | 5.06e-06 | 114 |
| GO:00070403 | Esophagus | ESCC | lysosome organization | 53/8552 | 74/18723 | 5.34e-06 | 5.57e-05 | 53 |
| GO:00801713 | Esophagus | ESCC | lytic vacuole organization | 53/8552 | 74/18723 | 5.34e-06 | 5.57e-05 | 53 |
| GO:005507617 | Esophagus | ESCC | transition metal ion homeostasis | 87/8552 | 138/18723 | 2.85e-05 | 2.37e-04 | 87 |
| GO:00070353 | Esophagus | ESCC | vacuolar acidification | 20/8552 | 24/18723 | 1.69e-04 | 1.11e-03 | 20 |
| GO:00070423 | Esophagus | ESCC | lysosomal lumen acidification | 11/8552 | 11/18723 | 1.80e-04 | 1.16e-03 | 11 |
| GO:00070393 | Esophagus | ESCC | protein catabolic process in the vacuole | 16/8552 | 19/18723 | 6.45e-04 | 3.43e-03 | 16 |
| GO:00469169 | Esophagus | ESCC | cellular transition metal ion homeostasis | 70/8552 | 115/18723 | 7.28e-04 | 3.79e-03 | 70 |
| GO:19051463 | Esophagus | ESCC | lysosomal protein catabolic process | 13/8552 | 15/18723 | 1.31e-03 | 6.26e-03 | 13 |
| GO:00514521 | Esophagus | ESCC | intracellular pH reduction | 29/8552 | 42/18723 | 1.87e-03 | 8.46e-03 | 29 |
| GO:00458511 | Esophagus | ESCC | pH reduction | 31/8552 | 46/18723 | 2.42e-03 | 1.06e-02 | 31 |
| GO:00550729 | Esophagus | ESCC | iron ion homeostasis | 52/8552 | 85/18723 | 2.86e-03 | 1.21e-02 | 52 |
| GO:00700711 | Esophagus | ESCC | proton-transporting two-sector ATPase complex assembly | 12/8552 | 15/18723 | 7.31e-03 | 2.63e-02 | 12 |
| GO:00070332 | Liver | Cirrhotic | vacuole organization | 80/4634 | 180/18723 | 5.73e-09 | 2.25e-07 | 80 |
| GO:00704827 | Liver | Cirrhotic | response to oxygen levels | 125/4634 | 347/18723 | 1.55e-06 | 3.02e-05 | 125 |
| GO:00550766 | Liver | Cirrhotic | transition metal ion homeostasis | 59/4634 | 138/18723 | 2.59e-06 | 4.65e-05 | 59 |
| GO:0007040 | Liver | Cirrhotic | lysosome organization | 35/4634 | 74/18723 | 2.10e-05 | 2.77e-04 | 35 |
| GO:0080171 | Liver | Cirrhotic | lytic vacuole organization | 35/4634 | 74/18723 | 2.10e-05 | 2.77e-04 | 35 |
| Page: 1 2 3 4 5 |
| Pathway ID | Tissue | Disease Stage | Description | Gene Ratio | Bg Ratio | pvalue | p.adjust | qvalue | Count |
| Page: 1 |
Top |
Cell-cell communication analysis |
| Identification of potential cell-cell interactions between two cell types and their ligand-receptor pairs for different disease states |
| Ligand | Receptor | LRpair | Pathway | Tissue | Disease Stage |
| Page: 1 |
Top |
Single-cell gene regulatory network inference analysis |
| Find out the significant the regulons (TFs) and the target genes of each regulon across cell types for different disease states |
| TF | Cell Type | Tissue | Disease Stage | Target Gene | RSS | Regulon Activity |
| ∗The dot plots of a searched regulon are shown for all cell subpopulations in each disease state of each tissue based on the regulon specific score inferred using pySCENIC and by calculating the average expression. |
| Page: 1 |
Top |
Somatic mutation of malignant transformation related genes |
| Annotation of somatic variants for genes involved in malignant transformation |
| Hugo Symbol | Variant Class | Variant Classification | dbSNP RS | HGVSc | HGVSp | HGVSp Short | SWISSPROT | BIOTYPE | SIFT | PolyPhen | Tumor Sample Barcode | Tissue | Histology | Sex | Age | Stage | Therapy Types | Drugs | Outcome |
| TMEM199 | deletion | Frame_Shift_Del | c.499delN | p.Gly167GlufsTer14 | p.G167Efs*14 | Q8N511 | protein_coding | TCGA-D8-A27V-01 | Breast | breast invasive carcinoma | Female | <65 | I/II | Hormone Therapy | tamoxiphen | SD | |||
| TMEM199 | SNV | Missense_Mutation | c.167N>A | p.Ser56Tyr | p.S56Y | Q8N511 | protein_coding | deleterious(0) | possibly_damaging(0.594) | TCGA-F5-6814-01 | Colorectum | rectum adenocarcinoma | Male | <65 | I/II | Unknown | Unknown | SD | |
| TMEM199 | SNV | Missense_Mutation | rs142566184 | c.610N>A | p.Glu204Lys | p.E204K | Q8N511 | protein_coding | tolerated(0.08) | benign(0.255) | TCGA-F5-6814-01 | Colorectum | rectum adenocarcinoma | Male | <65 | I/II | Unknown | Unknown | SD |
| TMEM199 | SNV | Missense_Mutation | novel | c.467N>G | p.Thr156Arg | p.T156R | Q8N511 | protein_coding | deleterious(0) | probably_damaging(0.999) | TCGA-A5-A0G1-01 | Endometrium | uterine corpus endometrioid carcinoma | Female | >=65 | I/II | Unknown | Unknown | SD |
| TMEM199 | SNV | Missense_Mutation | c.283N>T | p.Arg95Trp | p.R95W | Q8N511 | protein_coding | deleterious(0) | probably_damaging(0.999) | TCGA-AJ-A3BH-01 | Endometrium | uterine corpus endometrioid carcinoma | Female | Unknown | I/II | Unknown | Unknown | SD | |
| TMEM199 | SNV | Missense_Mutation | novel | c.72N>T | p.Glu24Asp | p.E24D | Q8N511 | protein_coding | tolerated(0.1) | benign(0.049) | TCGA-AP-A1DV-01 | Endometrium | uterine corpus endometrioid carcinoma | Female | <65 | I/II | Unknown | Unknown | SD |
| TMEM199 | SNV | Missense_Mutation | novel | c.163N>A | p.Val55Ile | p.V55I | Q8N511 | protein_coding | tolerated(0.67) | benign(0.001) | TCGA-AX-A1CE-01 | Endometrium | uterine corpus endometrioid carcinoma | Female | <65 | I/II | Unspecific | Paclitaxel | SD |
| TMEM199 | SNV | Missense_Mutation | c.167C>A | p.Ser56Tyr | p.S56Y | Q8N511 | protein_coding | deleterious(0) | possibly_damaging(0.594) | TCGA-B5-A0JY-01 | Endometrium | uterine corpus endometrioid carcinoma | Female | <65 | III/IV | Chemotherapy | doxorubicin | SD | |
| TMEM199 | SNV | Missense_Mutation | rs782624450 | c.556N>A | p.Ala186Thr | p.A186T | Q8N511 | protein_coding | deleterious(0) | probably_damaging(0.999) | TCGA-DF-A2KU-01 | Endometrium | uterine corpus endometrioid carcinoma | Female | Unknown | I/II | Unknown | Unknown | SD |
| TMEM199 | SNV | Missense_Mutation | novel | c.476N>T | p.Ala159Val | p.A159V | Q8N511 | protein_coding | deleterious(0) | probably_damaging(0.998) | TCGA-EY-A1GO-01 | Endometrium | uterine corpus endometrioid carcinoma | Female | >=65 | III/IV | Chemotherapy | carboplatin | PD |
| Page: 1 2 |
Top |
Related drugs of malignant transformation related genes |
| Identification of chemicals and drugs interact with genes involved in malignant transfromation |
| (DGIdb 4.0) |
| Entrez ID | Symbol | Category | Interaction Types | Drug Claim Name | Drug Name | PMIDs |
| Page: 1 |

Copyright 2023-Present -The University of Texas Health Science Center at Houston |