
|
|||||
|
 | |
| |
| |
| |
| |
| |
|
Gene: TMEM191B |
Gene summary for TMEM191B |
| Gene information | Species | Human | Gene symbol | TMEM191B | Gene ID | 728229 |
| Gene name | transmembrane protein 191B | |
| Gene Alias | TMEM191B | |
| Cytomap | 22q11.21 | |
| Gene Type | protein-coding | GO ID | GO:0005575 | UniProtAcc | P0C7N4 |
Top |
Malignant transformation analysis |
| Identification of the aberrant gene expression in precancerous and cancerous lesions by comparing the gene expression of stem-like cells in diseased tissues with normal stem cells |
| Entrez ID | Symbol | Replicates | Species | Organ | Tissue | Adj P-value | Log2FC | Malignancy |
| 728229 | TMEM191B | C04 | Human | Oral cavity | OSCC | 6.76e-09 | 4.04e-01 | 0.2633 |
| 728229 | TMEM191B | C21 | Human | Oral cavity | OSCC | 1.03e-16 | 4.90e-01 | 0.2678 |
| 728229 | TMEM191B | C30 | Human | Oral cavity | OSCC | 2.25e-16 | 6.80e-01 | 0.3055 |
| 728229 | TMEM191B | C43 | Human | Oral cavity | OSCC | 1.37e-13 | 2.42e-01 | 0.1704 |
| 728229 | TMEM191B | C46 | Human | Oral cavity | OSCC | 3.38e-07 | 1.90e-01 | 0.1673 |
| 728229 | TMEM191B | C51 | Human | Oral cavity | OSCC | 6.69e-03 | 2.36e-01 | 0.2674 |
| 728229 | TMEM191B | C57 | Human | Oral cavity | OSCC | 3.59e-04 | 1.80e-01 | 0.1679 |
| 728229 | TMEM191B | C06 | Human | Oral cavity | OSCC | 4.85e-04 | 5.20e-01 | 0.2699 |
| 728229 | TMEM191B | C08 | Human | Oral cavity | OSCC | 1.47e-09 | 1.94e-01 | 0.1919 |
| 728229 | TMEM191B | C09 | Human | Oral cavity | OSCC | 1.27e-06 | 2.67e-01 | 0.1431 |
| 728229 | TMEM191B | LN46 | Human | Oral cavity | OSCC | 2.57e-02 | 1.89e-01 | 0.1666 |
| 728229 | TMEM191B | LP15 | Human | Oral cavity | LP | 2.56e-04 | 7.57e-01 | 0.2174 |
| 728229 | TMEM191B | SYSMH1 | Human | Oral cavity | OSCC | 5.01e-04 | 1.64e-01 | 0.1127 |
| 728229 | TMEM191B | SYSMH2 | Human | Oral cavity | OSCC | 1.64e-16 | 4.92e-01 | 0.2326 |
| 728229 | TMEM191B | SYSMH3 | Human | Oral cavity | OSCC | 1.90e-13 | 3.22e-01 | 0.2442 |
| 728229 | TMEM191B | SYSMH6 | Human | Oral cavity | OSCC | 4.48e-06 | 1.43e-01 | 0.1275 |
| Page: 1 |
| Tissue | Expression Dynamics | Abbreviation |
| Oral Cavity | 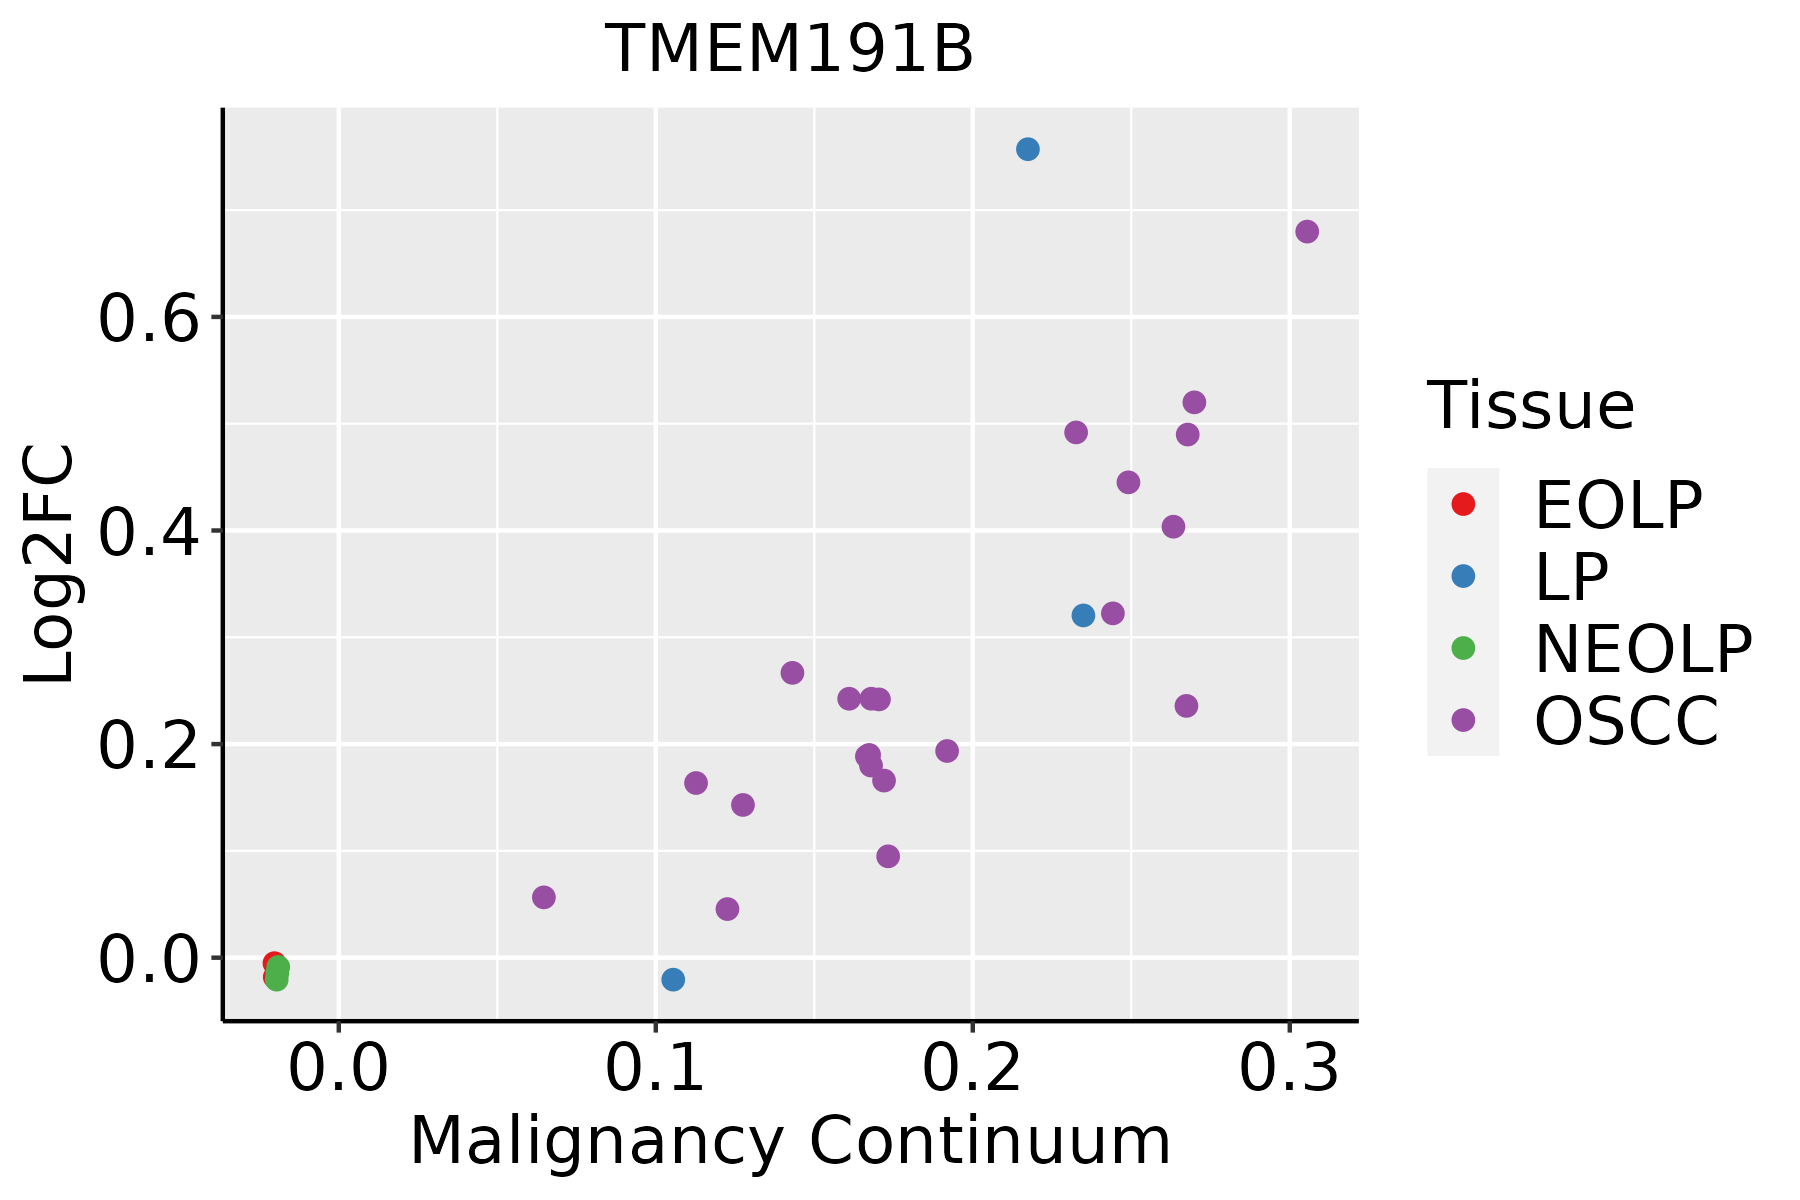 | EOLP: Erosive Oral lichen planus |
| LP: leukoplakia | ||
| NEOLP: Non-erosive oral lichen planus | ||
| OSCC: Oral squamous cell carcinoma |
| ∗log2FC in expression of this searched gene in stem-like cells from each diseased tissue sample relative to stem-like cells in normal samples in each tissue plotted against the malignancy continuum. Samples are colored based on if they are from different disease stage. |
Top |
Malignant transformation related pathway analysis |
| Find out the enriched GO biological processes and KEGG pathways involved in transition from healthy to precancer to cancer |
| Tissue | Disease Stage | Enriched GO biological Processes |
| Colorectum | AD |  |
| Colorectum | SER |  |
| Colorectum | MSS |  |
| Colorectum | MSI-H |  |
| Colorectum | FAP |  |
| ∗Top 15 enriched GO BP terms are showed in the bar plot of each disease state in each tissue. Each row represents a significant GO biological process which is colored according to the -log10(p.adjust). |
| Page: 1 2 3 4 5 6 7 8 9 |
| GO ID | Tissue | Disease Stage | Description | Gene Ratio | Bg Ratio | pvalue | p.adjust | Count |
| Page: 1 |
| Pathway ID | Tissue | Disease Stage | Description | Gene Ratio | Bg Ratio | pvalue | p.adjust | qvalue | Count |
| Page: 1 |
Top |
Cell-cell communication analysis |
| Identification of potential cell-cell interactions between two cell types and their ligand-receptor pairs for different disease states |
| Ligand | Receptor | LRpair | Pathway | Tissue | Disease Stage |
| Page: 1 |
Top |
Single-cell gene regulatory network inference analysis |
| Find out the significant the regulons (TFs) and the target genes of each regulon across cell types for different disease states |
| TF | Cell Type | Tissue | Disease Stage | Target Gene | RSS | Regulon Activity |
| ∗The dot plots of a searched regulon are shown for all cell subpopulations in each disease state of each tissue based on the regulon specific score inferred using pySCENIC and by calculating the average expression. |
| Page: 1 |
Top |
Somatic mutation of malignant transformation related genes |
| Annotation of somatic variants for genes involved in malignant transformation |
| Hugo Symbol | Variant Class | Variant Classification | dbSNP RS | HGVSc | HGVSp | HGVSp Short | SWISSPROT | BIOTYPE | SIFT | PolyPhen | Tumor Sample Barcode | Tissue | Histology | Sex | Age | Stage | Therapy Types | Drugs | Outcome |
| TMEM191B | SNV | Missense_Mutation | novel | c.305G>A | p.Arg102Gln | p.R102Q | P0C7N4 | protein_coding | deleterious(0.04) | probably_damaging(0.975) | TCGA-EK-A2RO-01 | Cervix | cervical & endocervical cancer | Female | <65 | I/II | Unknown | Unknown | SD |
| TMEM191B | SNV | Missense_Mutation | novel | c.409N>G | p.Lys137Glu | p.K137E | P0C7N4 | protein_coding | tolerated(0.17) | probably_damaging(0.979) | TCGA-AX-A3G8-01 | Endometrium | uterine corpus endometrioid carcinoma | Female | >=65 | I/II | Unknown | Unknown | SD |
| TMEM191B | SNV | Missense_Mutation | novel | c.377N>C | p.Val126Ala | p.V126A | P0C7N4 | protein_coding | tolerated(1) | possibly_damaging(0.657) | TCGA-BG-A222-01 | Endometrium | uterine corpus endometrioid carcinoma | Female | <65 | I/II | Unknown | Unknown | SD |
| TMEM191B | SNV | Missense_Mutation | novel | c.788C>T | p.Ala263Val | p.A263V | P0C7N4 | protein_coding | deleterious_low_confidence(0.02) | possibly_damaging(0.801) | TCGA-D1-A1NY-01 | Endometrium | uterine corpus endometrioid carcinoma | Female | >=65 | I/II | Chemotherapy | carboplatin | SD |
| TMEM191B | SNV | Missense_Mutation | novel | c.788N>T | p.Ala263Val | p.A263V | P0C7N4 | protein_coding | deleterious_low_confidence(0.02) | possibly_damaging(0.801) | TCGA-EY-A215-01 | Endometrium | uterine corpus endometrioid carcinoma | Female | <65 | I/II | Unknown | Unknown | SD |
| TMEM191B | insertion | In_Frame_Ins | novel | c.480_481insTAT | p.Tyr160dup | p.Y160dup | P0C7N4 | protein_coding | TCGA-DF-A2KU-01 | Endometrium | uterine corpus endometrioid carcinoma | Female | Unknown | I/II | Unknown | Unknown | SD |
| Page: 1 |
Top |
Related drugs of malignant transformation related genes |
| Identification of chemicals and drugs interact with genes involved in malignant transfromation |
| (DGIdb 4.0) |
| Entrez ID | Symbol | Category | Interaction Types | Drug Claim Name | Drug Name | PMIDs |
| Page: 1 |

Copyright 2023-Present -The University of Texas Health Science Center at Houston |