
|
|||||
|
 | |
| |
| |
| |
| |
| |
|
Gene: TMEM19 |
Gene summary for TMEM19 |
| Gene information | Species | Human | Gene symbol | TMEM19 | Gene ID | 55266 |
| Gene name | transmembrane protein 19 | |
| Gene Alias | TMEM19 | |
| Cytomap | 12q21.1 | |
| Gene Type | protein-coding | GO ID | GO:0005575 | UniProtAcc | A0A024RBA1 |
Top |
Malignant transformation analysis |
| Identification of the aberrant gene expression in precancerous and cancerous lesions by comparing the gene expression of stem-like cells in diseased tissues with normal stem cells |
| Entrez ID | Symbol | Replicates | Species | Organ | Tissue | Adj P-value | Log2FC | Malignancy |
| 55266 | TMEM19 | LZE4T | Human | Esophagus | ESCC | 3.54e-18 | 3.99e-01 | 0.0811 |
| 55266 | TMEM19 | LZE8T | Human | Esophagus | ESCC | 7.78e-07 | 2.11e-01 | 0.067 |
| 55266 | TMEM19 | LZE20T | Human | Esophagus | ESCC | 1.72e-03 | 1.12e-01 | 0.0662 |
| 55266 | TMEM19 | LZE24T | Human | Esophagus | ESCC | 1.57e-10 | 2.55e-01 | 0.0596 |
| 55266 | TMEM19 | LZE6T | Human | Esophagus | ESCC | 8.94e-03 | 8.10e-02 | 0.0845 |
| 55266 | TMEM19 | P1T-E | Human | Esophagus | ESCC | 8.02e-08 | 3.07e-01 | 0.0875 |
| 55266 | TMEM19 | P2T-E | Human | Esophagus | ESCC | 6.36e-24 | 5.69e-01 | 0.1177 |
| 55266 | TMEM19 | P4T-E | Human | Esophagus | ESCC | 5.21e-16 | 4.23e-01 | 0.1323 |
| 55266 | TMEM19 | P5T-E | Human | Esophagus | ESCC | 4.71e-08 | 2.25e-01 | 0.1327 |
| 55266 | TMEM19 | P8T-E | Human | Esophagus | ESCC | 2.60e-18 | 3.13e-01 | 0.0889 |
| 55266 | TMEM19 | P9T-E | Human | Esophagus | ESCC | 2.99e-08 | 1.40e-01 | 0.1131 |
| 55266 | TMEM19 | P10T-E | Human | Esophagus | ESCC | 2.51e-25 | 4.94e-01 | 0.116 |
| 55266 | TMEM19 | P11T-E | Human | Esophagus | ESCC | 1.48e-06 | 2.34e-01 | 0.1426 |
| 55266 | TMEM19 | P12T-E | Human | Esophagus | ESCC | 9.06e-21 | 5.06e-01 | 0.1122 |
| 55266 | TMEM19 | P15T-E | Human | Esophagus | ESCC | 3.13e-10 | 2.15e-01 | 0.1149 |
| 55266 | TMEM19 | P16T-E | Human | Esophagus | ESCC | 3.55e-09 | 1.36e-01 | 0.1153 |
| 55266 | TMEM19 | P17T-E | Human | Esophagus | ESCC | 1.60e-03 | 1.95e-01 | 0.1278 |
| 55266 | TMEM19 | P20T-E | Human | Esophagus | ESCC | 2.14e-18 | 5.65e-01 | 0.1124 |
| 55266 | TMEM19 | P21T-E | Human | Esophagus | ESCC | 1.68e-26 | 4.65e-01 | 0.1617 |
| 55266 | TMEM19 | P22T-E | Human | Esophagus | ESCC | 7.09e-14 | 1.75e-01 | 0.1236 |
| Page: 1 2 3 4 5 |
| Tissue | Expression Dynamics | Abbreviation |
| Esophagus | 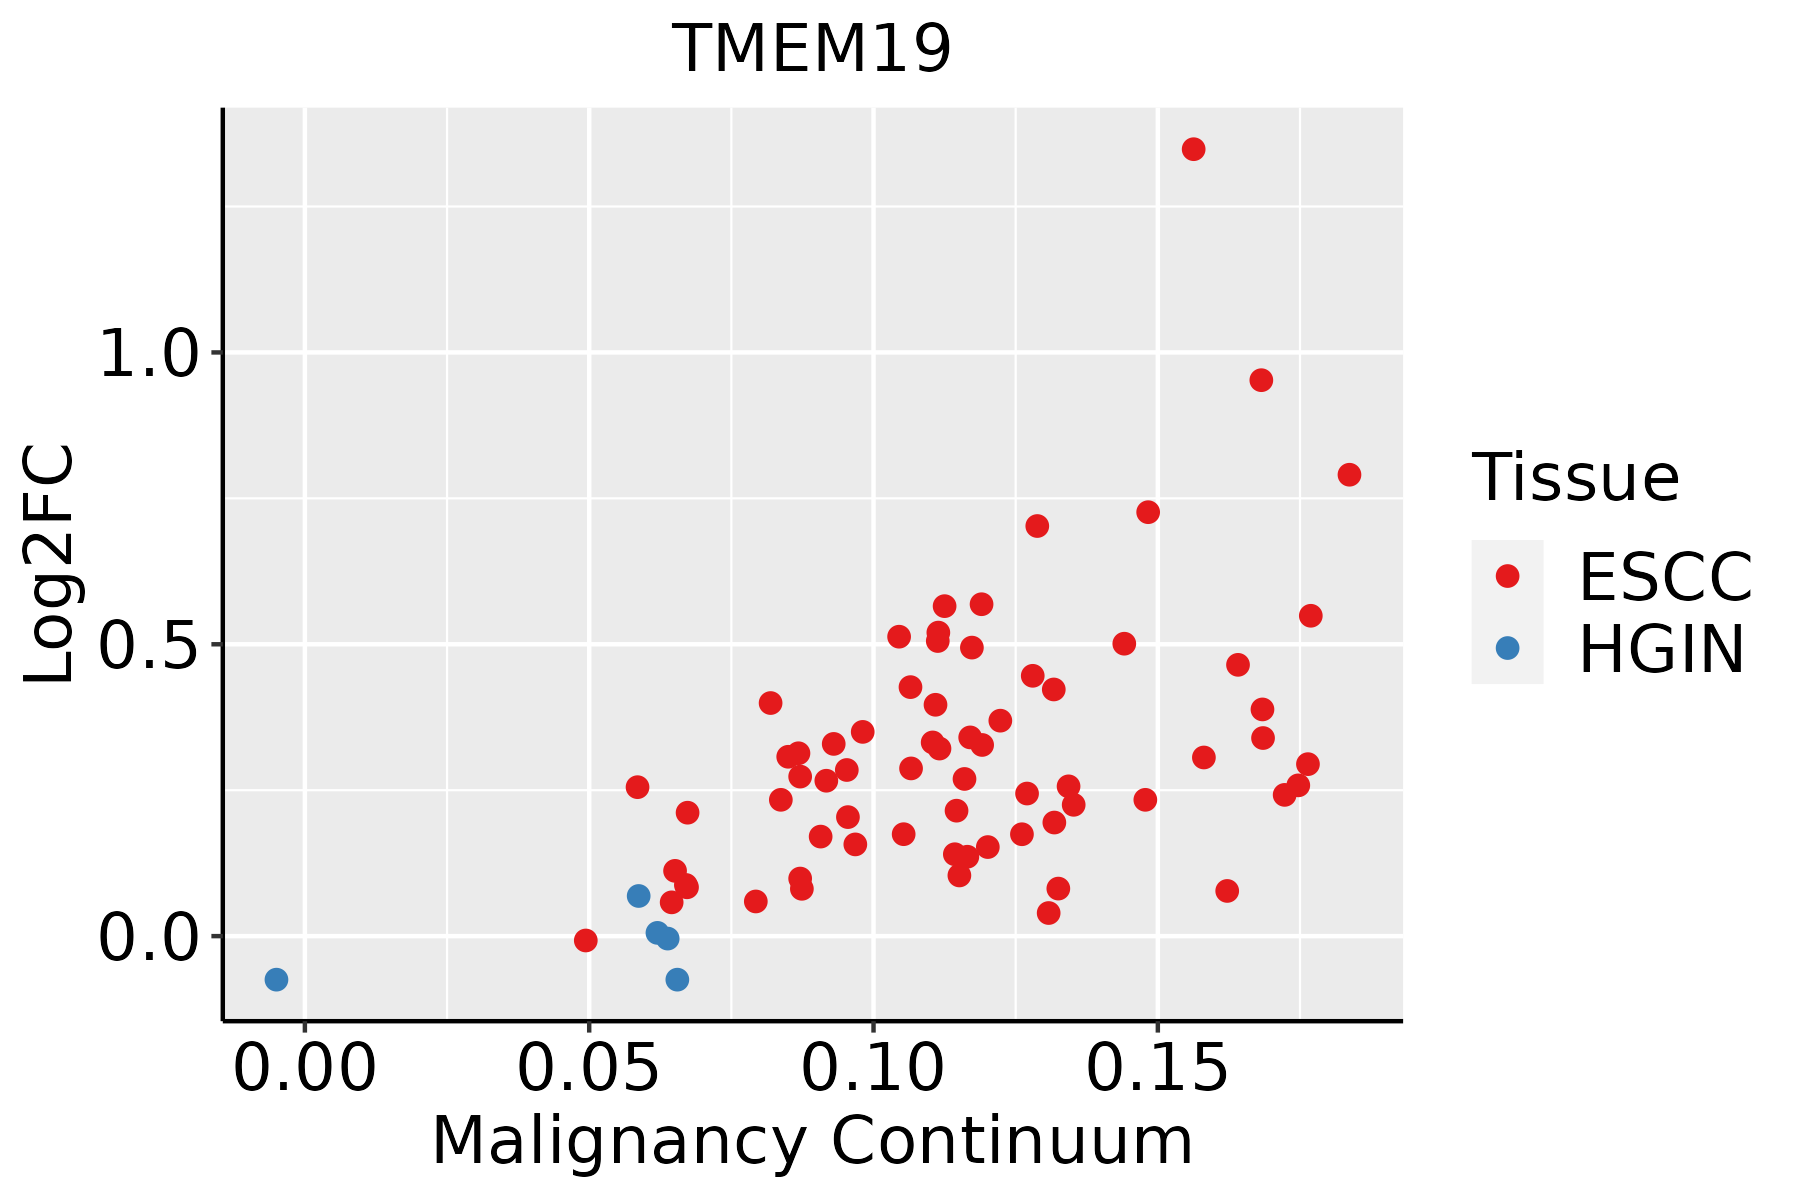 | ESCC: Esophageal squamous cell carcinoma |
| HGIN: High-grade intraepithelial neoplasias | ||
| LGIN: Low-grade intraepithelial neoplasias | ||
| Liver | 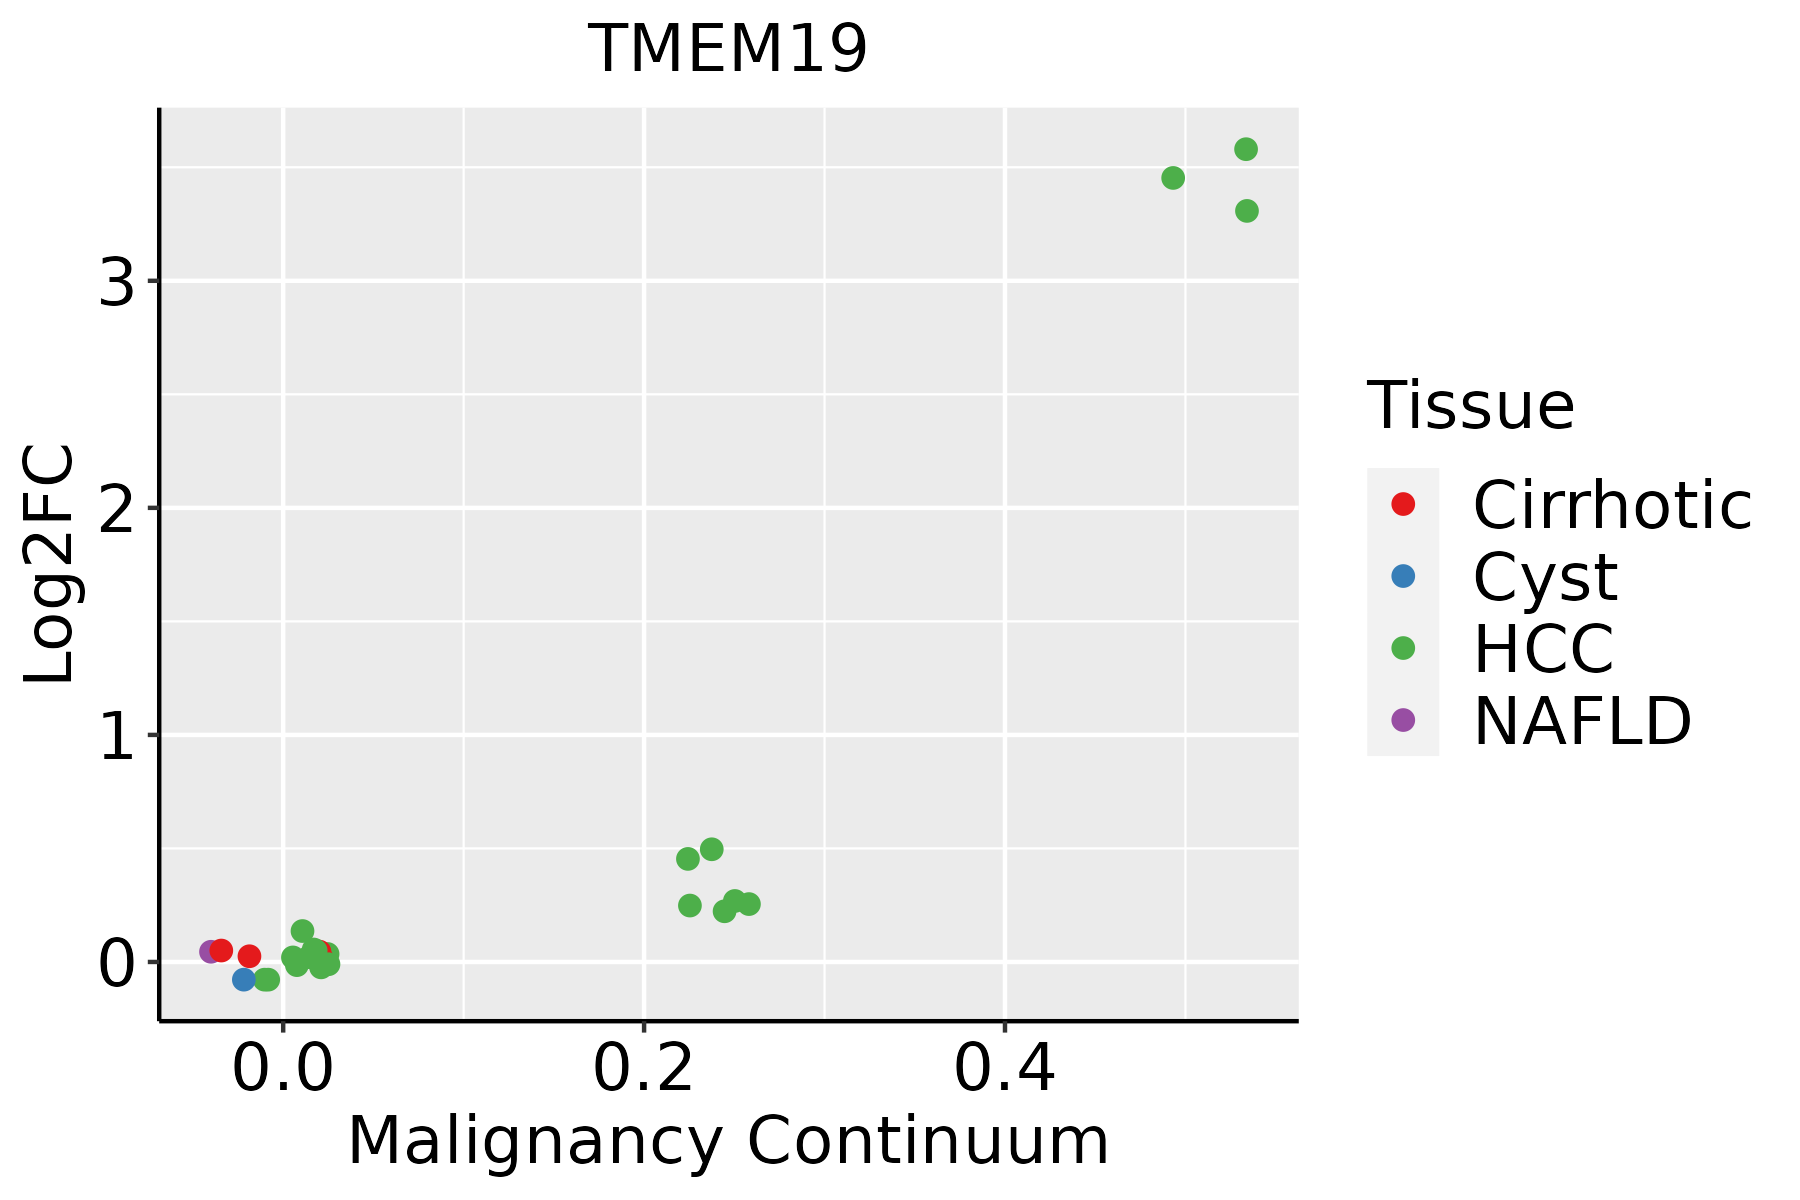 | HCC: Hepatocellular carcinoma |
| NAFLD: Non-alcoholic fatty liver disease | ||
| Oral Cavity | 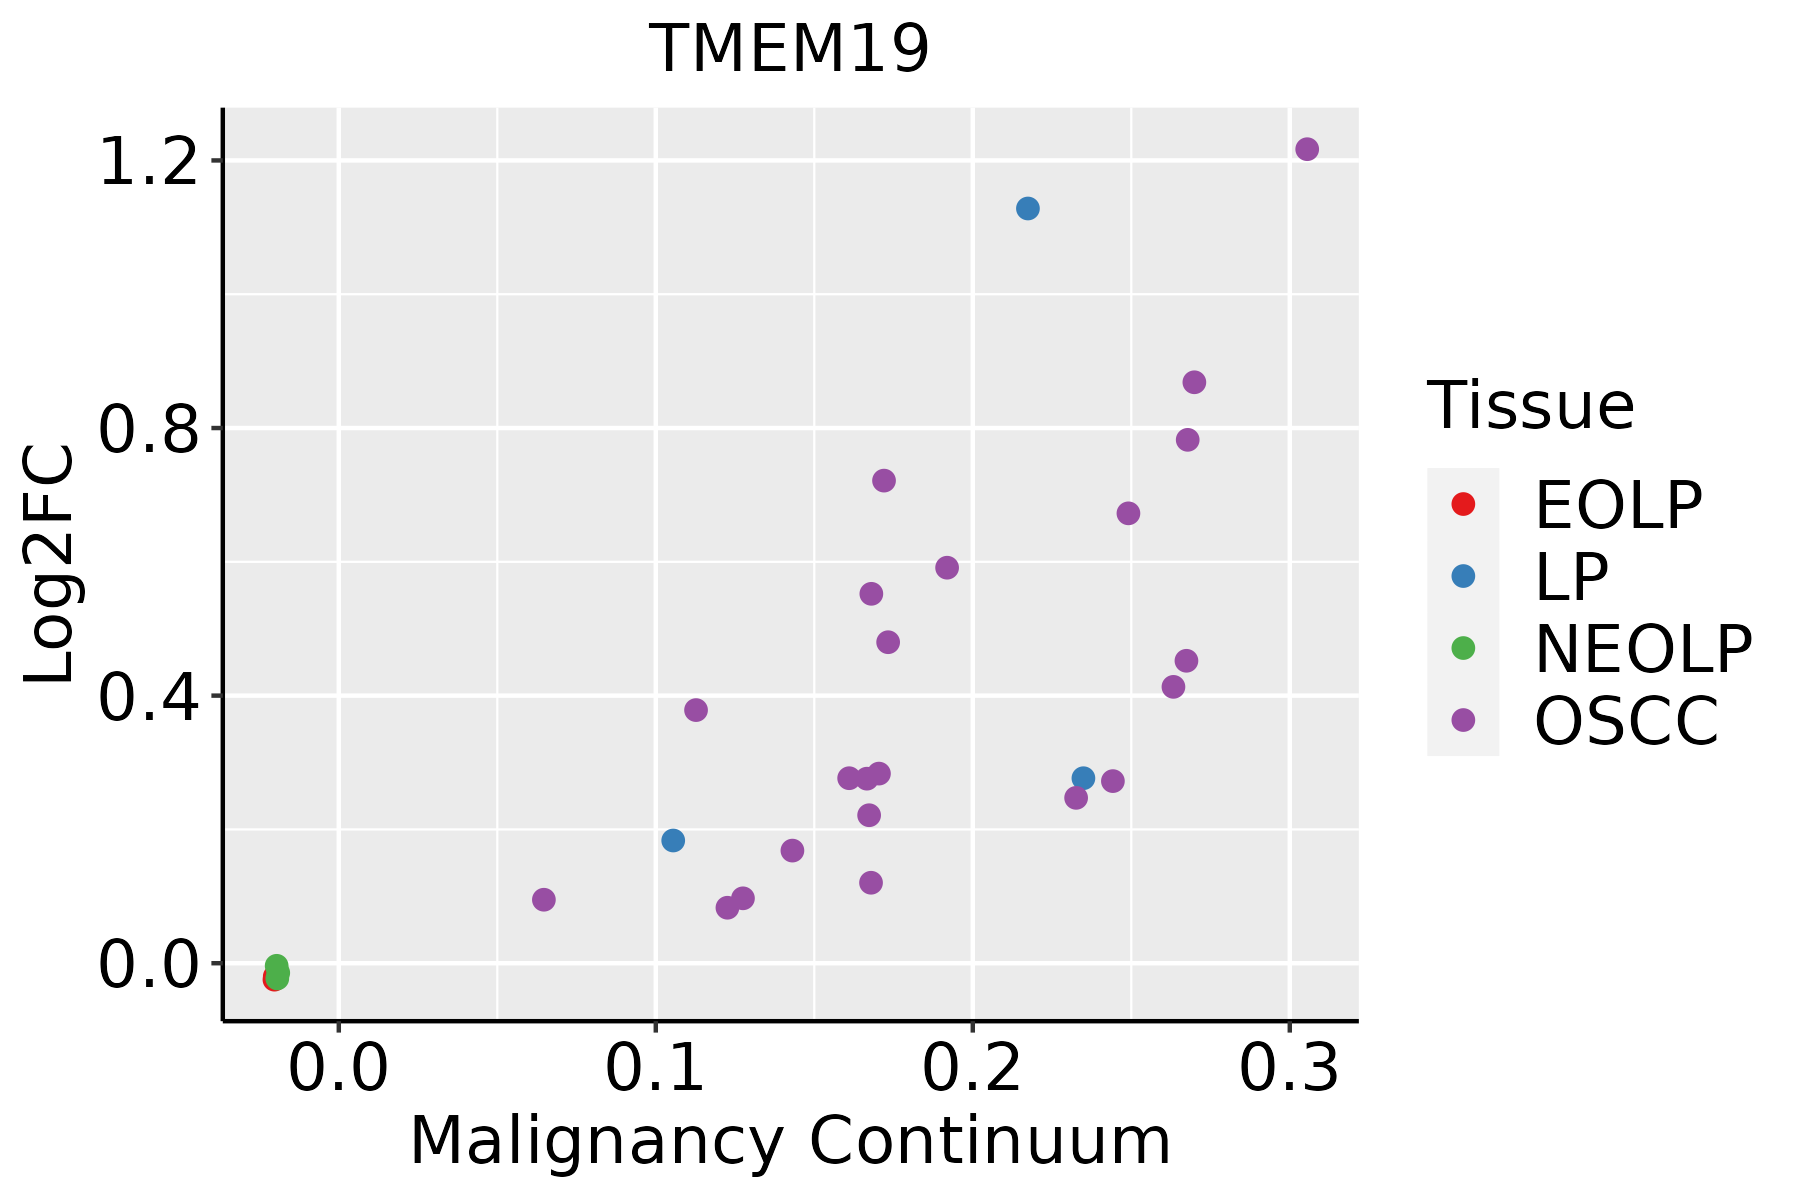 | EOLP: Erosive Oral lichen planus |
| LP: leukoplakia | ||
| NEOLP: Non-erosive oral lichen planus | ||
| OSCC: Oral squamous cell carcinoma | ||
| Skin | 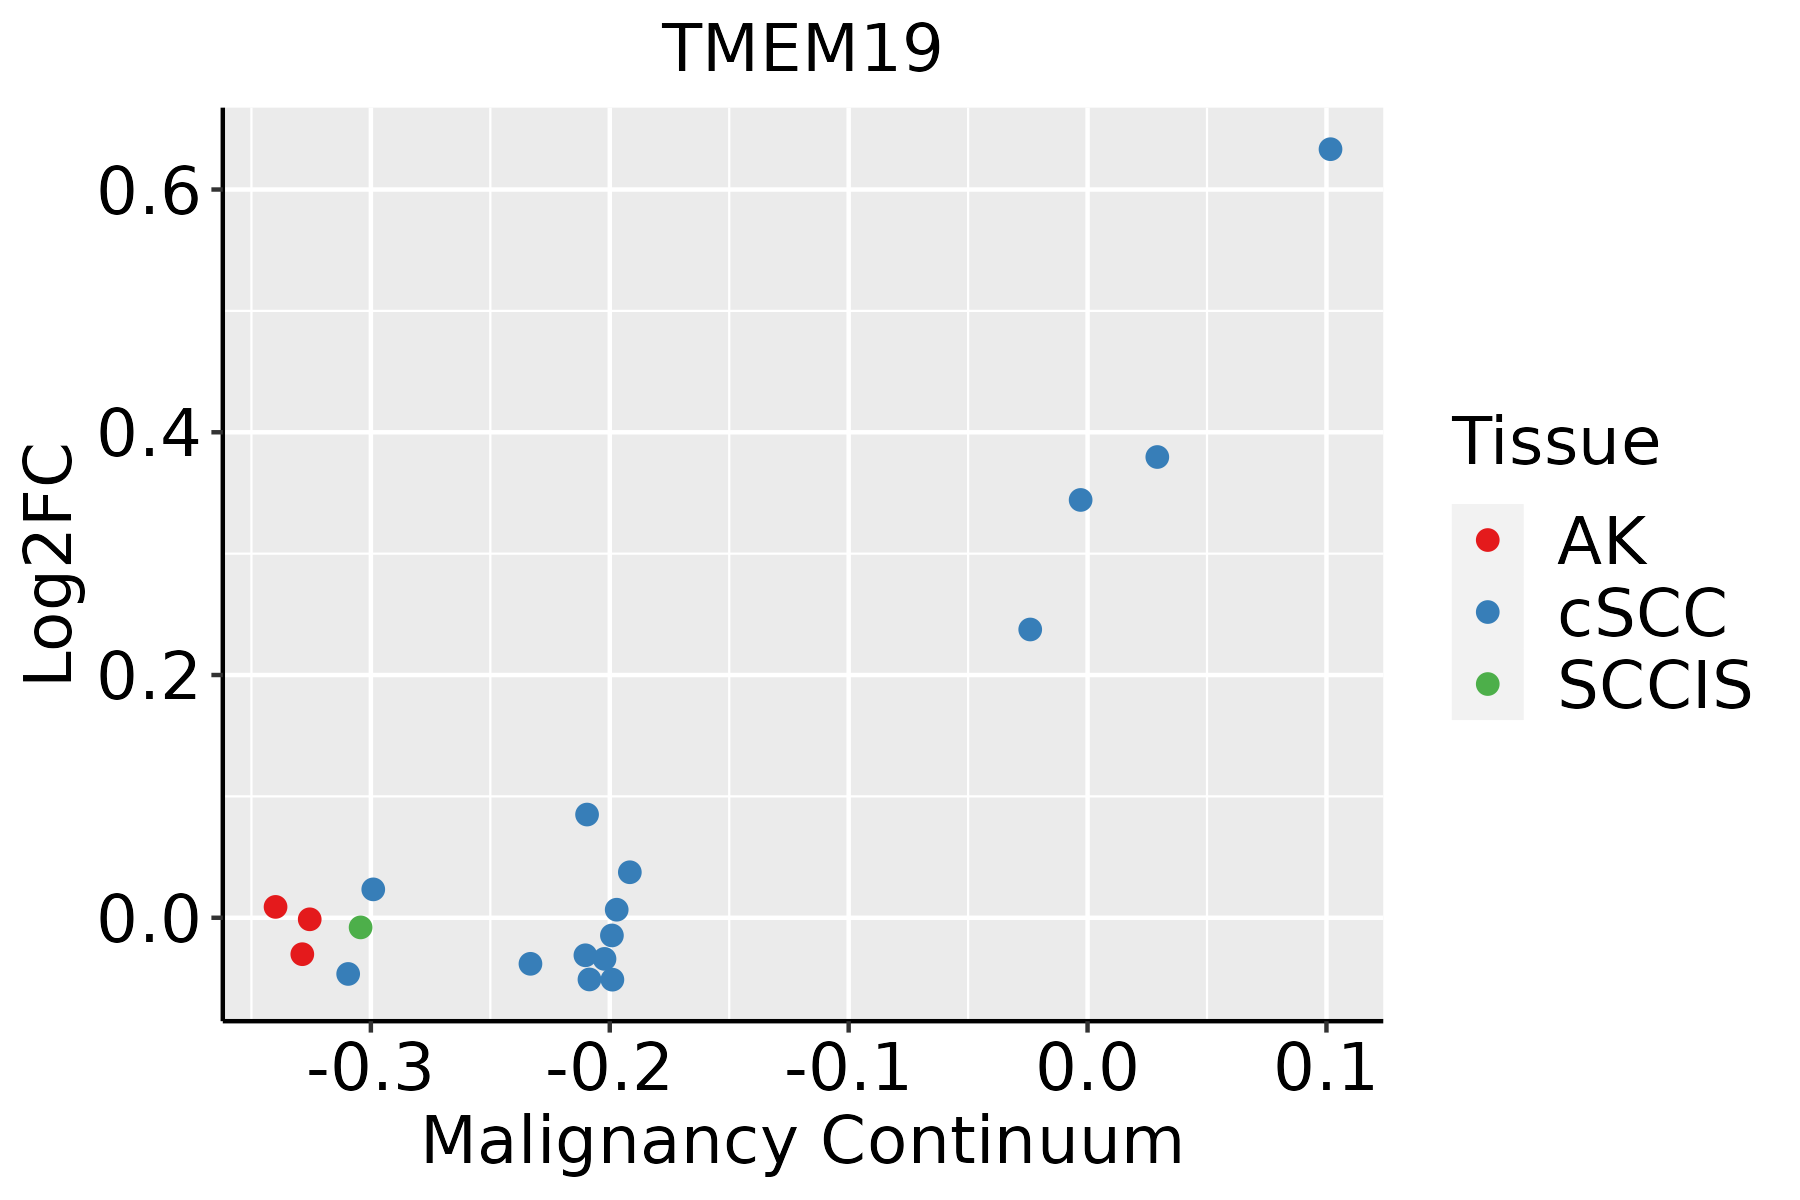 | AK: Actinic keratosis |
| cSCC: Cutaneous squamous cell carcinoma | ||
| SCCIS:squamous cell carcinoma in situ | ||
| Thyroid |  | ATC: Anaplastic thyroid cancer |
| HT: Hashimoto's thyroiditis | ||
| PTC: Papillary thyroid cancer |
| ∗log2FC in expression of this searched gene in stem-like cells from each diseased tissue sample relative to stem-like cells in normal samples in each tissue plotted against the malignancy continuum. Samples are colored based on if they are from different disease stage. |
Top |
Malignant transformation related pathway analysis |
| Find out the enriched GO biological processes and KEGG pathways involved in transition from healthy to precancer to cancer |
| Tissue | Disease Stage | Enriched GO biological Processes |
| Colorectum | AD |  |
| Colorectum | SER |  |
| Colorectum | MSS |  |
| Colorectum | MSI-H |  |
| Colorectum | FAP |  |
| ∗Top 15 enriched GO BP terms are showed in the bar plot of each disease state in each tissue. Each row represents a significant GO biological process which is colored according to the -log10(p.adjust). |
| Page: 1 2 3 4 5 6 7 8 9 |
| GO ID | Tissue | Disease Stage | Description | Gene Ratio | Bg Ratio | pvalue | p.adjust | Count |
| GO:000703314 | Esophagus | ESCC | vacuole organization | 127/8552 | 180/18723 | 1.04e-11 | 3.85e-10 | 127 |
| GO:0070482111 | Esophagus | ESCC | response to oxygen levels | 218/8552 | 347/18723 | 6.91e-11 | 2.17e-09 | 218 |
| GO:0071453110 | Esophagus | ESCC | cellular response to oxygen levels | 114/8552 | 177/18723 | 3.63e-07 | 5.06e-06 | 114 |
| GO:00070403 | Esophagus | ESCC | lysosome organization | 53/8552 | 74/18723 | 5.34e-06 | 5.57e-05 | 53 |
| GO:00801713 | Esophagus | ESCC | lytic vacuole organization | 53/8552 | 74/18723 | 5.34e-06 | 5.57e-05 | 53 |
| GO:005507617 | Esophagus | ESCC | transition metal ion homeostasis | 87/8552 | 138/18723 | 2.85e-05 | 2.37e-04 | 87 |
| GO:00070353 | Esophagus | ESCC | vacuolar acidification | 20/8552 | 24/18723 | 1.69e-04 | 1.11e-03 | 20 |
| GO:00070423 | Esophagus | ESCC | lysosomal lumen acidification | 11/8552 | 11/18723 | 1.80e-04 | 1.16e-03 | 11 |
| GO:00070393 | Esophagus | ESCC | protein catabolic process in the vacuole | 16/8552 | 19/18723 | 6.45e-04 | 3.43e-03 | 16 |
| GO:00469169 | Esophagus | ESCC | cellular transition metal ion homeostasis | 70/8552 | 115/18723 | 7.28e-04 | 3.79e-03 | 70 |
| GO:19051463 | Esophagus | ESCC | lysosomal protein catabolic process | 13/8552 | 15/18723 | 1.31e-03 | 6.26e-03 | 13 |
| GO:00514521 | Esophagus | ESCC | intracellular pH reduction | 29/8552 | 42/18723 | 1.87e-03 | 8.46e-03 | 29 |
| GO:00458511 | Esophagus | ESCC | pH reduction | 31/8552 | 46/18723 | 2.42e-03 | 1.06e-02 | 31 |
| GO:00550729 | Esophagus | ESCC | iron ion homeostasis | 52/8552 | 85/18723 | 2.86e-03 | 1.21e-02 | 52 |
| GO:00700711 | Esophagus | ESCC | proton-transporting two-sector ATPase complex assembly | 12/8552 | 15/18723 | 7.31e-03 | 2.63e-02 | 12 |
| GO:00070332 | Liver | Cirrhotic | vacuole organization | 80/4634 | 180/18723 | 5.73e-09 | 2.25e-07 | 80 |
| GO:00704827 | Liver | Cirrhotic | response to oxygen levels | 125/4634 | 347/18723 | 1.55e-06 | 3.02e-05 | 125 |
| GO:00550766 | Liver | Cirrhotic | transition metal ion homeostasis | 59/4634 | 138/18723 | 2.59e-06 | 4.65e-05 | 59 |
| GO:0007040 | Liver | Cirrhotic | lysosome organization | 35/4634 | 74/18723 | 2.10e-05 | 2.77e-04 | 35 |
| GO:0080171 | Liver | Cirrhotic | lytic vacuole organization | 35/4634 | 74/18723 | 2.10e-05 | 2.77e-04 | 35 |
| Page: 1 2 3 4 5 |
| Pathway ID | Tissue | Disease Stage | Description | Gene Ratio | Bg Ratio | pvalue | p.adjust | qvalue | Count |
| Page: 1 |
Top |
Cell-cell communication analysis |
| Identification of potential cell-cell interactions between two cell types and their ligand-receptor pairs for different disease states |
| Ligand | Receptor | LRpair | Pathway | Tissue | Disease Stage |
| Page: 1 |
Top |
Single-cell gene regulatory network inference analysis |
| Find out the significant the regulons (TFs) and the target genes of each regulon across cell types for different disease states |
| TF | Cell Type | Tissue | Disease Stage | Target Gene | RSS | Regulon Activity |
| ∗The dot plots of a searched regulon are shown for all cell subpopulations in each disease state of each tissue based on the regulon specific score inferred using pySCENIC and by calculating the average expression. |
| Page: 1 |
Top |
Somatic mutation of malignant transformation related genes |
| Annotation of somatic variants for genes involved in malignant transformation |
| Hugo Symbol | Variant Class | Variant Classification | dbSNP RS | HGVSc | HGVSp | HGVSp Short | SWISSPROT | BIOTYPE | SIFT | PolyPhen | Tumor Sample Barcode | Tissue | Histology | Sex | Age | Stage | Therapy Types | Drugs | Outcome |
| TMEM19 | SNV | Missense_Mutation | c.433N>A | p.Glu145Lys | p.E145K | Q96HH6 | protein_coding | deleterious(0.01) | possibly_damaging(0.575) | TCGA-A2-A0CX-01 | Breast | breast invasive carcinoma | Female | <65 | I/II | Chemotherapy | adriamycin | SD | |
| TMEM19 | SNV | Missense_Mutation | c.938N>C | p.Val313Ala | p.V313A | Q96HH6 | protein_coding | deleterious(0) | probably_damaging(0.953) | TCGA-D8-A1XK-01 | Breast | breast invasive carcinoma | Female | <65 | I/II | Chemotherapy | doxorubicine+cyclophosphamide | SD | |
| TMEM19 | insertion | Frame_Shift_Ins | novel | c.970_971insGTGAAACCCCATCTCTACTAAAAATACAAAAATTATC | p.Leu324CysfsTer41 | p.L324Cfs*41 | Q96HH6 | protein_coding | TCGA-A8-A09D-01 | Breast | breast invasive carcinoma | Female | <65 | I/II | Chemotherapy | doxorubicin | CR | ||
| TMEM19 | SNV | Missense_Mutation | rs185566519 | c.472G>A | p.Glu158Lys | p.E158K | Q96HH6 | protein_coding | deleterious(0) | possibly_damaging(0.575) | TCGA-C5-A8XJ-01 | Cervix | cervical & endocervical cancer | Female | >=65 | I/II | Chemotherapy | cisplatin | SD |
| TMEM19 | SNV | Missense_Mutation | novel | c.886N>T | p.Thr296Ser | p.T296S | Q96HH6 | protein_coding | tolerated(0.38) | benign(0) | TCGA-AA-A01K-01 | Colorectum | colon adenocarcinoma | Female | >=65 | III/IV | Chemotherapy | folinic | CR |
| TMEM19 | SNV | Missense_Mutation | novel | c.111N>T | p.Met37Ile | p.M37I | Q96HH6 | protein_coding | tolerated(0.69) | benign(0) | TCGA-CA-6717-01 | Colorectum | colon adenocarcinoma | Male | <65 | I/II | Chemotherapy | oxaliplatin | CR |
| TMEM19 | SNV | Missense_Mutation | c.727N>T | p.Ile243Phe | p.I243F | Q96HH6 | protein_coding | tolerated(0.3) | benign(0.104) | TCGA-F4-6570-01 | Colorectum | colon adenocarcinoma | Female | >=65 | I/II | Unknown | Unknown | SD | |
| TMEM19 | SNV | Missense_Mutation | novel | c.586N>A | p.Leu196Met | p.L196M | Q96HH6 | protein_coding | tolerated(0.18) | benign(0.133) | TCGA-F5-6814-01 | Colorectum | rectum adenocarcinoma | Male | <65 | I/II | Unknown | Unknown | SD |
| TMEM19 | SNV | Missense_Mutation | novel | c.449N>G | p.Tyr150Cys | p.Y150C | Q96HH6 | protein_coding | deleterious(0) | possibly_damaging(0.866) | TCGA-AP-A051-01 | Endometrium | uterine corpus endometrioid carcinoma | Female | >=65 | I/II | Unknown | Unknown | SD |
| TMEM19 | SNV | Missense_Mutation | c.899N>T | p.Arg300Met | p.R300M | Q96HH6 | protein_coding | deleterious(0) | benign(0.183) | TCGA-AP-A059-01 | Endometrium | uterine corpus endometrioid carcinoma | Female | >=65 | I/II | Unknown | Unknown | SD |
| Page: 1 2 3 |
Top |
Related drugs of malignant transformation related genes |
| Identification of chemicals and drugs interact with genes involved in malignant transfromation |
| (DGIdb 4.0) |
| Entrez ID | Symbol | Category | Interaction Types | Drug Claim Name | Drug Name | PMIDs |
| Page: 1 |

Copyright 2023-Present -The University of Texas Health Science Center at Houston |