
|
|||||
|
 | |
| |
| |
| |
| |
| |
|
Gene: TMEM185A |
Gene summary for TMEM185A |
| Gene information | Species | Human | Gene symbol | TMEM185A | Gene ID | 84548 |
| Gene name | transmembrane protein 185A | |
| Gene Alias | CXorf13 | |
| Cytomap | Xq28 | |
| Gene Type | protein-coding | GO ID | GO:0005575 | UniProtAcc | B7Z4G6 |
Top |
Malignant transformation analysis |
| Identification of the aberrant gene expression in precancerous and cancerous lesions by comparing the gene expression of stem-like cells in diseased tissues with normal stem cells |
| Entrez ID | Symbol | Replicates | Species | Organ | Tissue | Adj P-value | Log2FC | Malignancy |
| 84548 | TMEM185A | LZE2T | Human | Esophagus | ESCC | 9.16e-04 | 3.85e-01 | 0.082 |
| 84548 | TMEM185A | LZE20T | Human | Esophagus | ESCC | 5.26e-04 | 2.10e-01 | 0.0662 |
| 84548 | TMEM185A | LZE24T | Human | Esophagus | ESCC | 2.49e-24 | 5.68e-01 | 0.0596 |
| 84548 | TMEM185A | P1T-E | Human | Esophagus | ESCC | 5.22e-06 | 3.85e-01 | 0.0875 |
| 84548 | TMEM185A | P2T-E | Human | Esophagus | ESCC | 4.83e-15 | 2.82e-01 | 0.1177 |
| 84548 | TMEM185A | P4T-E | Human | Esophagus | ESCC | 3.50e-21 | 4.02e-01 | 0.1323 |
| 84548 | TMEM185A | P5T-E | Human | Esophagus | ESCC | 2.66e-07 | 1.07e-01 | 0.1327 |
| 84548 | TMEM185A | P8T-E | Human | Esophagus | ESCC | 1.88e-22 | 3.65e-01 | 0.0889 |
| 84548 | TMEM185A | P9T-E | Human | Esophagus | ESCC | 2.60e-06 | 1.39e-01 | 0.1131 |
| 84548 | TMEM185A | P10T-E | Human | Esophagus | ESCC | 2.46e-18 | 3.51e-01 | 0.116 |
| 84548 | TMEM185A | P11T-E | Human | Esophagus | ESCC | 5.34e-04 | 2.36e-01 | 0.1426 |
| 84548 | TMEM185A | P12T-E | Human | Esophagus | ESCC | 6.54e-22 | 4.98e-01 | 0.1122 |
| 84548 | TMEM185A | P15T-E | Human | Esophagus | ESCC | 9.50e-07 | 1.73e-01 | 0.1149 |
| 84548 | TMEM185A | P16T-E | Human | Esophagus | ESCC | 1.23e-05 | 1.09e-01 | 0.1153 |
| 84548 | TMEM185A | P19T-E | Human | Esophagus | ESCC | 2.70e-03 | 2.52e-01 | 0.1662 |
| 84548 | TMEM185A | P20T-E | Human | Esophagus | ESCC | 4.31e-05 | 1.35e-01 | 0.1124 |
| 84548 | TMEM185A | P21T-E | Human | Esophagus | ESCC | 1.56e-16 | 3.05e-01 | 0.1617 |
| 84548 | TMEM185A | P22T-E | Human | Esophagus | ESCC | 1.48e-40 | 6.57e-01 | 0.1236 |
| 84548 | TMEM185A | P23T-E | Human | Esophagus | ESCC | 2.57e-25 | 5.30e-01 | 0.108 |
| 84548 | TMEM185A | P24T-E | Human | Esophagus | ESCC | 4.54e-12 | 2.15e-01 | 0.1287 |
| Page: 1 2 3 4 |
| Tissue | Expression Dynamics | Abbreviation |
| Esophagus |  | ESCC: Esophageal squamous cell carcinoma |
| HGIN: High-grade intraepithelial neoplasias | ||
| LGIN: Low-grade intraepithelial neoplasias | ||
| Liver | 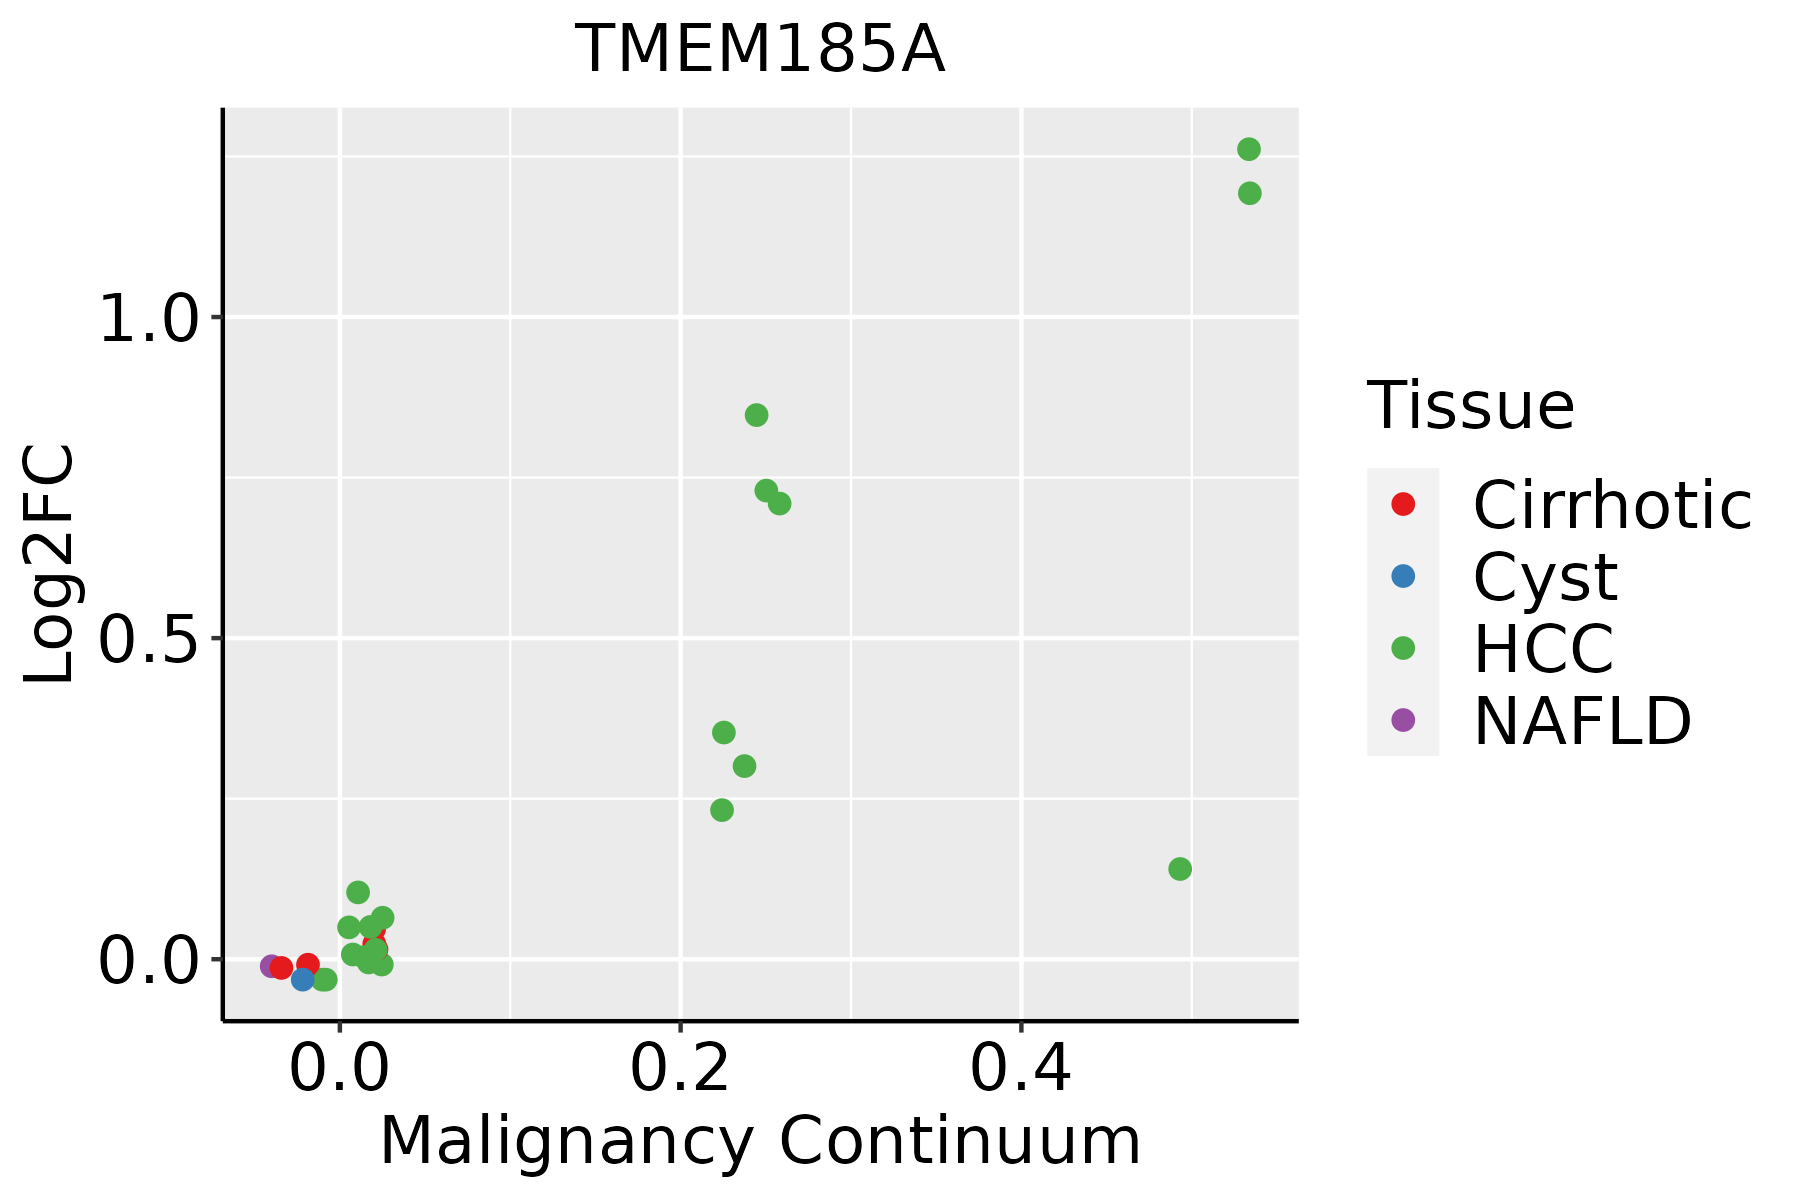 | HCC: Hepatocellular carcinoma |
| NAFLD: Non-alcoholic fatty liver disease | ||
| Oral Cavity | 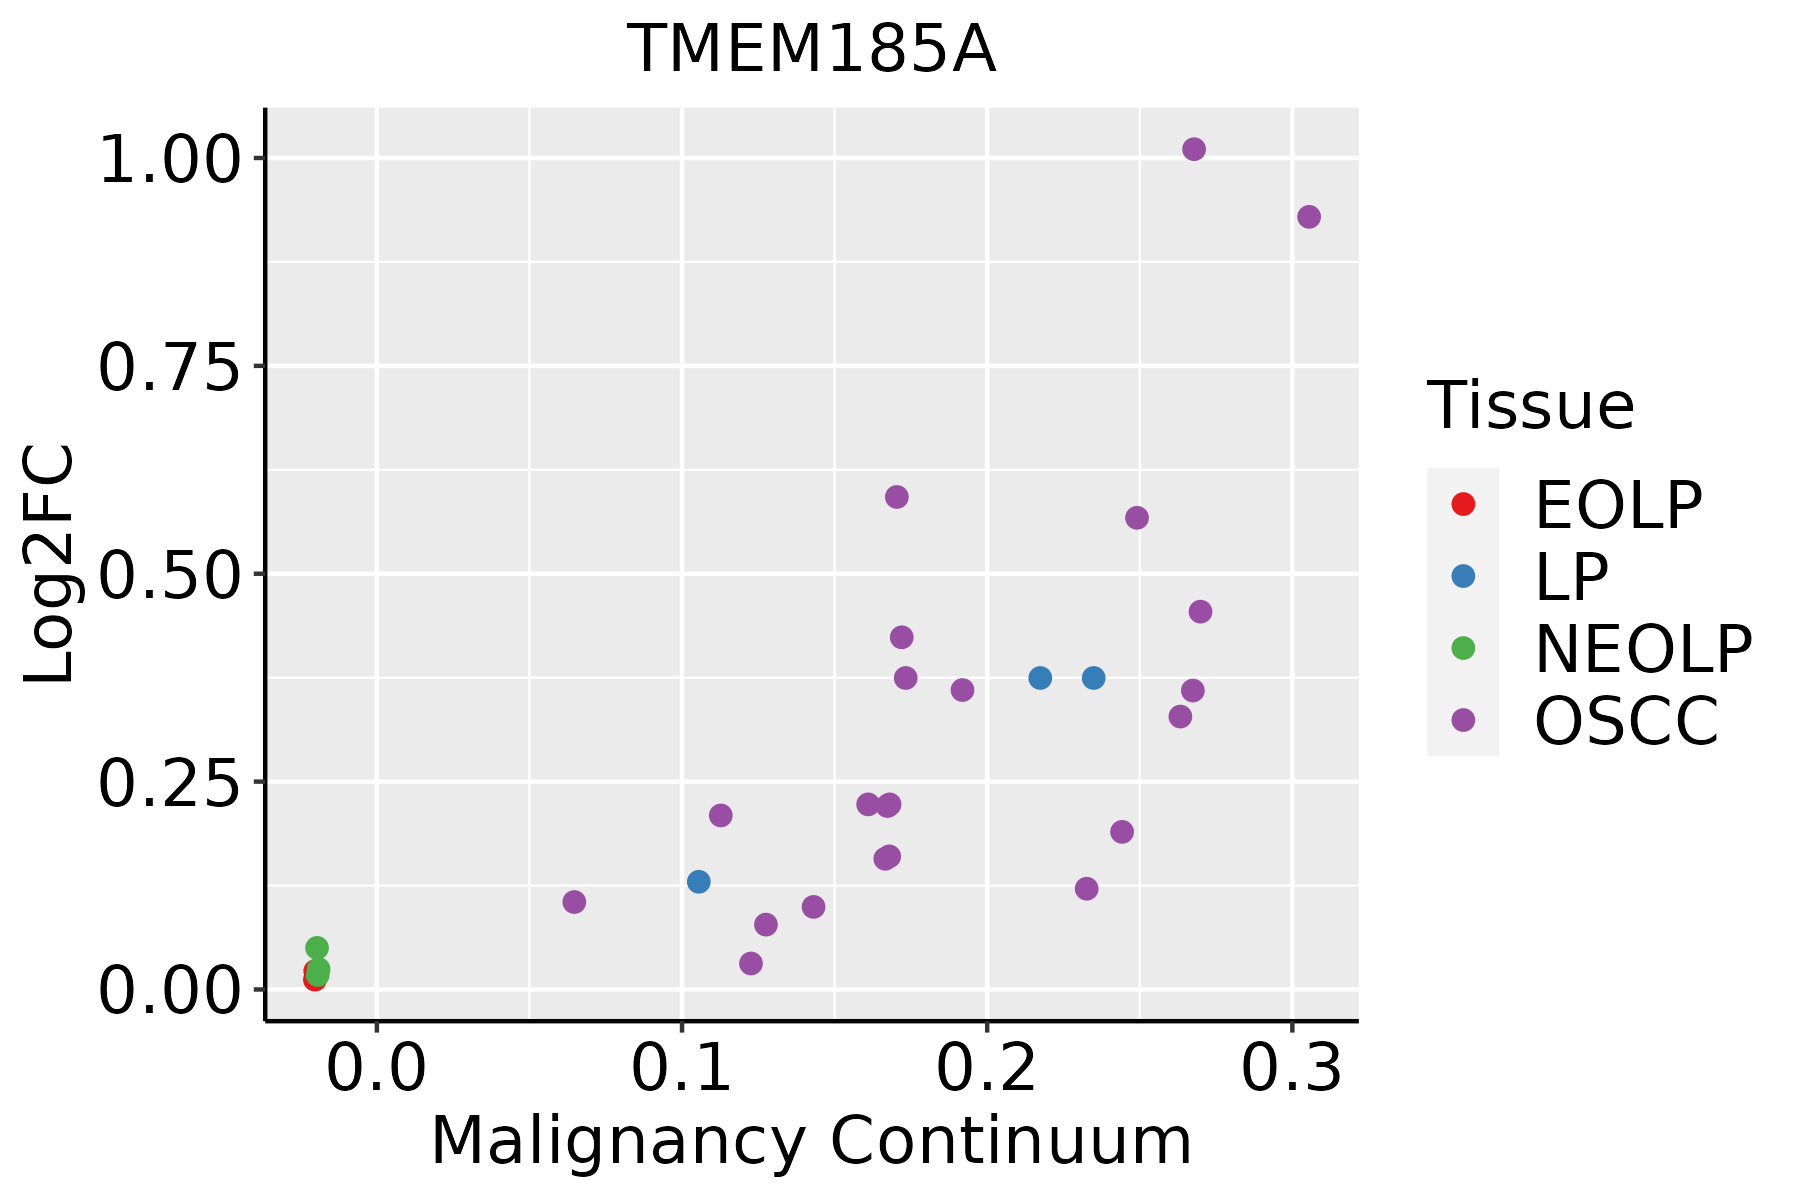 | EOLP: Erosive Oral lichen planus |
| LP: leukoplakia | ||
| NEOLP: Non-erosive oral lichen planus | ||
| OSCC: Oral squamous cell carcinoma |
| ∗log2FC in expression of this searched gene in stem-like cells from each diseased tissue sample relative to stem-like cells in normal samples in each tissue plotted against the malignancy continuum. Samples are colored based on if they are from different disease stage. |
Top |
Malignant transformation related pathway analysis |
| Find out the enriched GO biological processes and KEGG pathways involved in transition from healthy to precancer to cancer |
| Tissue | Disease Stage | Enriched GO biological Processes |
| Colorectum | AD |  |
| Colorectum | SER |  |
| Colorectum | MSS |  |
| Colorectum | MSI-H |  |
| Colorectum | FAP |  |
| ∗Top 15 enriched GO BP terms are showed in the bar plot of each disease state in each tissue. Each row represents a significant GO biological process which is colored according to the -log10(p.adjust). |
| Page: 1 2 3 4 5 6 7 8 9 |
| GO ID | Tissue | Disease Stage | Description | Gene Ratio | Bg Ratio | pvalue | p.adjust | Count |
| Page: 1 |
| Pathway ID | Tissue | Disease Stage | Description | Gene Ratio | Bg Ratio | pvalue | p.adjust | qvalue | Count |
| Page: 1 |
Top |
Cell-cell communication analysis |
| Identification of potential cell-cell interactions between two cell types and their ligand-receptor pairs for different disease states |
| Ligand | Receptor | LRpair | Pathway | Tissue | Disease Stage |
| Page: 1 |
Top |
Single-cell gene regulatory network inference analysis |
| Find out the significant the regulons (TFs) and the target genes of each regulon across cell types for different disease states |
| TF | Cell Type | Tissue | Disease Stage | Target Gene | RSS | Regulon Activity |
| ∗The dot plots of a searched regulon are shown for all cell subpopulations in each disease state of each tissue based on the regulon specific score inferred using pySCENIC and by calculating the average expression. |
| Page: 1 |
Top |
Somatic mutation of malignant transformation related genes |
| Annotation of somatic variants for genes involved in malignant transformation |
| Hugo Symbol | Variant Class | Variant Classification | dbSNP RS | HGVSc | HGVSp | HGVSp Short | SWISSPROT | BIOTYPE | SIFT | PolyPhen | Tumor Sample Barcode | Tissue | Histology | Sex | Age | Stage | Therapy Types | Drugs | Outcome |
| TMEM185A | SNV | Missense_Mutation | novel | c.938N>T | p.Pro313Leu | p.P313L | Q8NFB2 | protein_coding | deleterious(0.05) | benign(0.003) | TCGA-A8-A09Q-01 | Breast | breast invasive carcinoma | Female | >=65 | III/IV | Hormone Therapy | anastrozole | SD |
| TMEM185A | SNV | Missense_Mutation | novel | c.333C>A | p.Phe111Leu | p.F111L | Q8NFB2 | protein_coding | tolerated(1) | benign(0.003) | TCGA-AN-A046-01 | Breast | breast invasive carcinoma | Female | >=65 | I/II | Unknown | Unknown | SD |
| TMEM185A | SNV | Missense_Mutation | novel | c.968G>A | p.Arg323Gln | p.R323Q | Q8NFB2 | protein_coding | tolerated(0.65) | benign(0.031) | TCGA-AR-A1AS-01 | Breast | breast invasive carcinoma | Female | <65 | I/II | Chemotherapy | doxorubicin | SD |
| TMEM185A | SNV | Missense_Mutation | novel | c.493N>A | p.His165Asn | p.H165N | Q8NFB2 | protein_coding | tolerated(0.51) | benign(0) | TCGA-AR-A5QM-01 | Breast | breast invasive carcinoma | Female | <65 | I/II | Hormone Therapy | anastrozole | PD |
| TMEM185A | SNV | Missense_Mutation | c.170N>C | p.Gly57Ala | p.G57A | Q8NFB2 | protein_coding | deleterious(0) | probably_damaging(1) | TCGA-BH-A0DS-01 | Breast | breast invasive carcinoma | Female | >=65 | III/IV | Chemotherapy | cyclophosphamide | SD | |
| TMEM185A | insertion | In_Frame_Ins | novel | c.225_226insACTGGCTCACATTACTGTGGGGCTGGCAAGTCTGAAATCTCCAGG | p.Gly75_Glu76insThrGlySerHisTyrCysGlyAlaGlyLysSerGluIleSerArg | p.G75_E76insTGSHYCGAGKSEISR | Q8NFB2 | protein_coding | TCGA-A8-A07J-01 | Breast | breast invasive carcinoma | Female | <65 | I/II | Chemotherapy | 5-fluorouracil | CR | ||
| TMEM185A | SNV | Missense_Mutation | novel | c.697N>T | p.His233Tyr | p.H233Y | Q8NFB2 | protein_coding | tolerated(0.23) | benign(0.058) | TCGA-BI-A0VR-01 | Cervix | cervical & endocervical cancer | Female | <65 | III/IV | Unknown | Unknown | SD |
| TMEM185A | SNV | Missense_Mutation | novel | c.767N>T | p.Thr256Met | p.T256M | Q8NFB2 | protein_coding | deleterious(0) | possibly_damaging(0.639) | TCGA-DG-A2KH-01 | Cervix | cervical & endocervical cancer | Female | <65 | I/II | Unknown | Unknown | SD |
| TMEM185A | SNV | Missense_Mutation | novel | c.829N>T | p.Asp277Tyr | p.D277Y | Q8NFB2 | protein_coding | deleterious(0) | probably_damaging(0.987) | TCGA-EK-A3GN-01 | Cervix | cervical & endocervical cancer | Female | <65 | III/IV | Unknown | Unknown | SD |
| TMEM185A | SNV | Missense_Mutation | c.136C>T | p.Pro46Ser | p.P46S | Q8NFB2 | protein_coding | deleterious(0) | probably_damaging(0.999) | TCGA-A6-2677-01 | Colorectum | colon adenocarcinoma | Female | >=65 | III/IV | Ancillary | leucovorin | SD |
| Page: 1 2 3 4 5 6 |
Top |
Related drugs of malignant transformation related genes |
| Identification of chemicals and drugs interact with genes involved in malignant transfromation |
| (DGIdb 4.0) |
| Entrez ID | Symbol | Category | Interaction Types | Drug Claim Name | Drug Name | PMIDs |
| Page: 1 |

Copyright 2023-Present -The University of Texas Health Science Center at Houston |