
|
|||||
|
 | |
| |
| |
| |
| |
| |
|
Gene: TMEM184B |
Gene summary for TMEM184B |
| Gene information | Species | Human | Gene symbol | TMEM184B | Gene ID | 25829 |
| Gene name | transmembrane protein 184B | |
| Gene Alias | C22orf5 | |
| Cytomap | 22q13.1 | |
| Gene Type | protein-coding | GO ID | GO:0006810 | UniProtAcc | A0A024R1S0 |
Top |
Malignant transformation analysis |
| Identification of the aberrant gene expression in precancerous and cancerous lesions by comparing the gene expression of stem-like cells in diseased tissues with normal stem cells |
| Entrez ID | Symbol | Replicates | Species | Organ | Tissue | Adj P-value | Log2FC | Malignancy |
| 25829 | TMEM184B | LZE8T | Human | Esophagus | ESCC | 1.59e-05 | 9.92e-02 | 0.067 |
| 25829 | TMEM184B | LZE24T | Human | Esophagus | ESCC | 3.04e-10 | 3.26e-01 | 0.0596 |
| 25829 | TMEM184B | P1T-E | Human | Esophagus | ESCC | 4.02e-06 | 4.58e-01 | 0.0875 |
| 25829 | TMEM184B | P2T-E | Human | Esophagus | ESCC | 4.57e-14 | 1.54e-01 | 0.1177 |
| 25829 | TMEM184B | P4T-E | Human | Esophagus | ESCC | 1.70e-11 | 2.91e-01 | 0.1323 |
| 25829 | TMEM184B | P5T-E | Human | Esophagus | ESCC | 2.83e-11 | 1.22e-01 | 0.1327 |
| 25829 | TMEM184B | P8T-E | Human | Esophagus | ESCC | 9.61e-25 | 3.52e-01 | 0.0889 |
| 25829 | TMEM184B | P9T-E | Human | Esophagus | ESCC | 4.81e-04 | 1.96e-01 | 0.1131 |
| 25829 | TMEM184B | P10T-E | Human | Esophagus | ESCC | 2.75e-17 | 3.56e-01 | 0.116 |
| 25829 | TMEM184B | P11T-E | Human | Esophagus | ESCC | 7.50e-15 | 7.43e-01 | 0.1426 |
| 25829 | TMEM184B | P12T-E | Human | Esophagus | ESCC | 2.92e-23 | 3.87e-01 | 0.1122 |
| 25829 | TMEM184B | P15T-E | Human | Esophagus | ESCC | 2.31e-28 | 6.74e-01 | 0.1149 |
| 25829 | TMEM184B | P16T-E | Human | Esophagus | ESCC | 3.14e-13 | 2.19e-01 | 0.1153 |
| 25829 | TMEM184B | P17T-E | Human | Esophagus | ESCC | 3.87e-10 | 3.57e-01 | 0.1278 |
| 25829 | TMEM184B | P19T-E | Human | Esophagus | ESCC | 3.05e-04 | 5.61e-01 | 0.1662 |
| 25829 | TMEM184B | P20T-E | Human | Esophagus | ESCC | 2.26e-06 | 2.46e-01 | 0.1124 |
| 25829 | TMEM184B | P21T-E | Human | Esophagus | ESCC | 2.15e-58 | 1.15e+00 | 0.1617 |
| 25829 | TMEM184B | P22T-E | Human | Esophagus | ESCC | 2.86e-24 | 3.39e-01 | 0.1236 |
| 25829 | TMEM184B | P23T-E | Human | Esophagus | ESCC | 1.23e-24 | 6.21e-01 | 0.108 |
| 25829 | TMEM184B | P24T-E | Human | Esophagus | ESCC | 7.53e-16 | 3.34e-01 | 0.1287 |
| Page: 1 2 3 4 5 6 |
| Tissue | Expression Dynamics | Abbreviation |
| Esophagus | 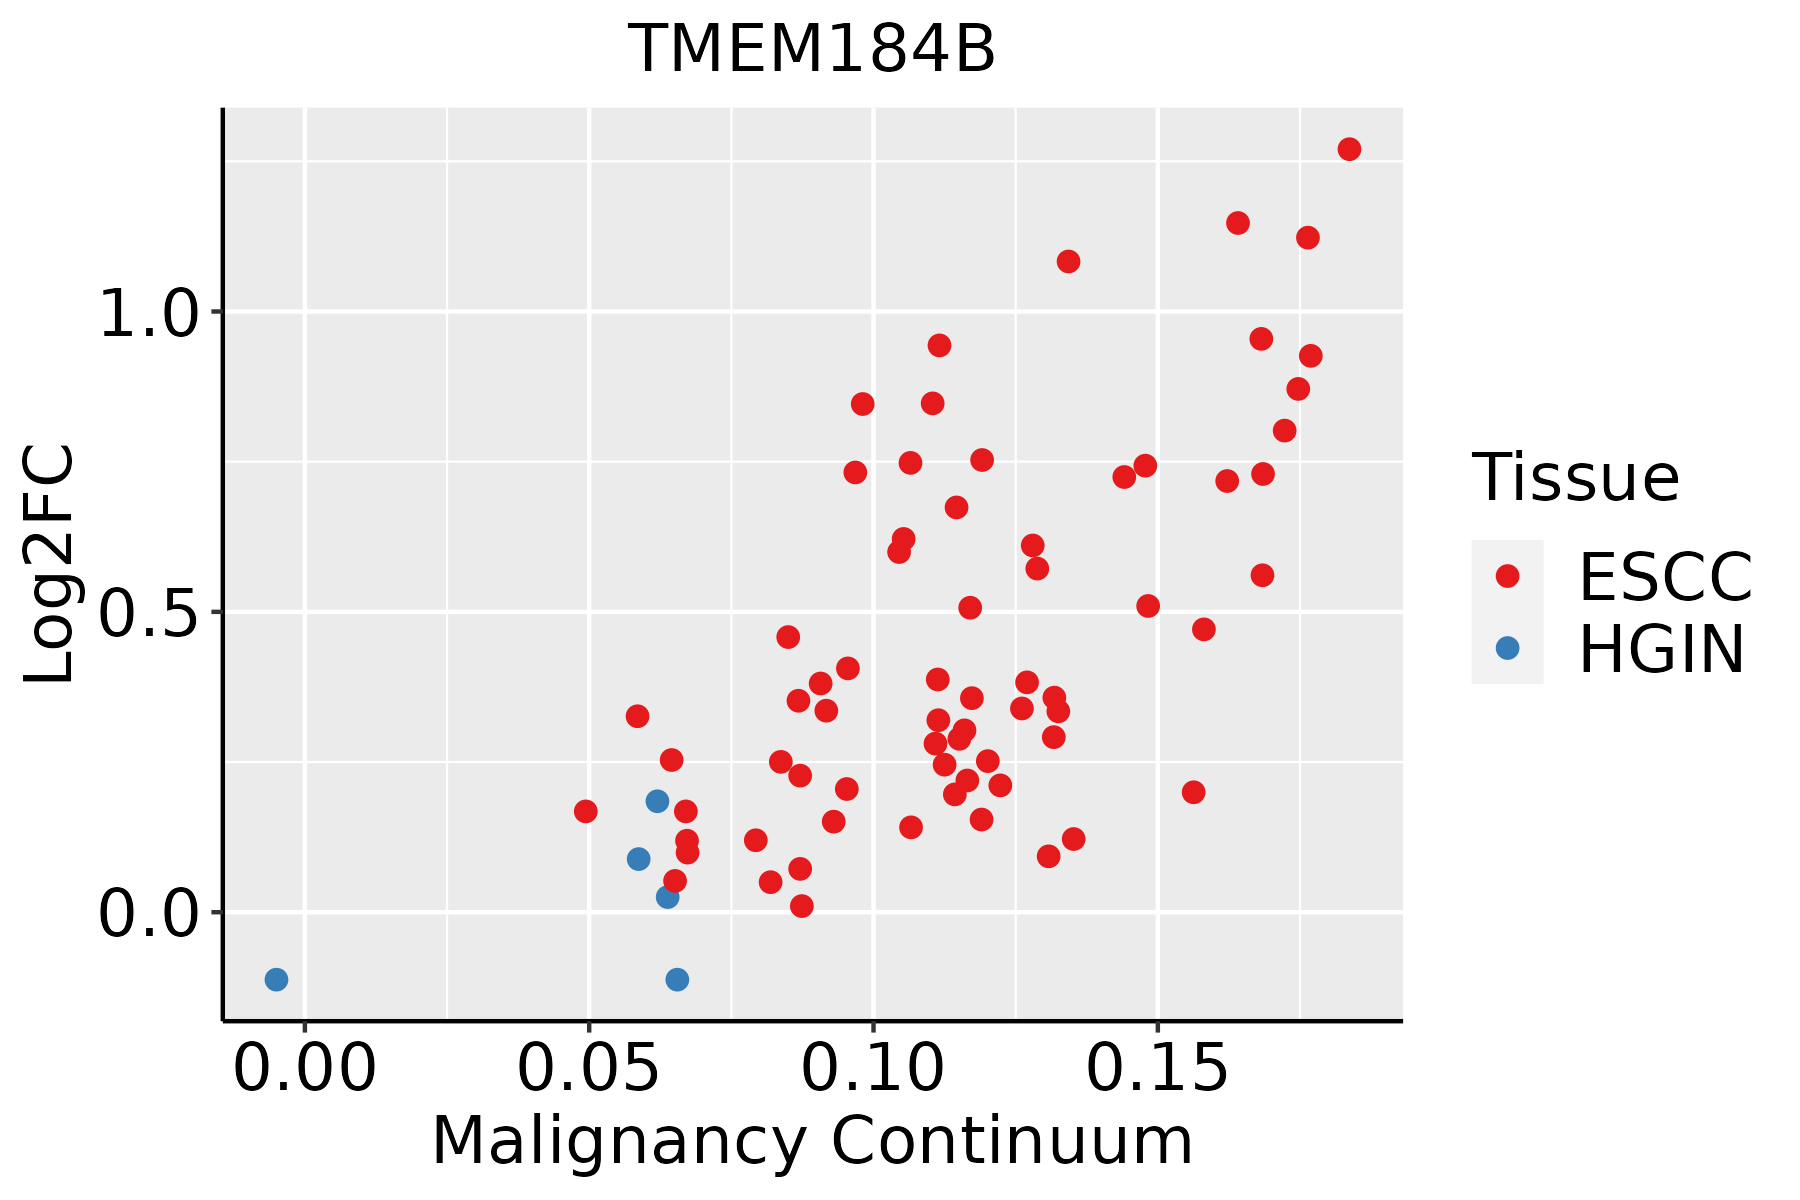 | ESCC: Esophageal squamous cell carcinoma |
| HGIN: High-grade intraepithelial neoplasias | ||
| LGIN: Low-grade intraepithelial neoplasias | ||
| GC |  | CAG: Chronic atrophic gastritis |
| CAG with IM: Chronic atrophic gastritis with intestinal metaplasia | ||
| CSG: Chronic superficial gastritis | ||
| GC: Gastric cancer | ||
| SIM: Severe intestinal metaplasia | ||
| WIM: Wild intestinal metaplasia | ||
| Liver |  | HCC: Hepatocellular carcinoma |
| NAFLD: Non-alcoholic fatty liver disease | ||
| Oral Cavity | 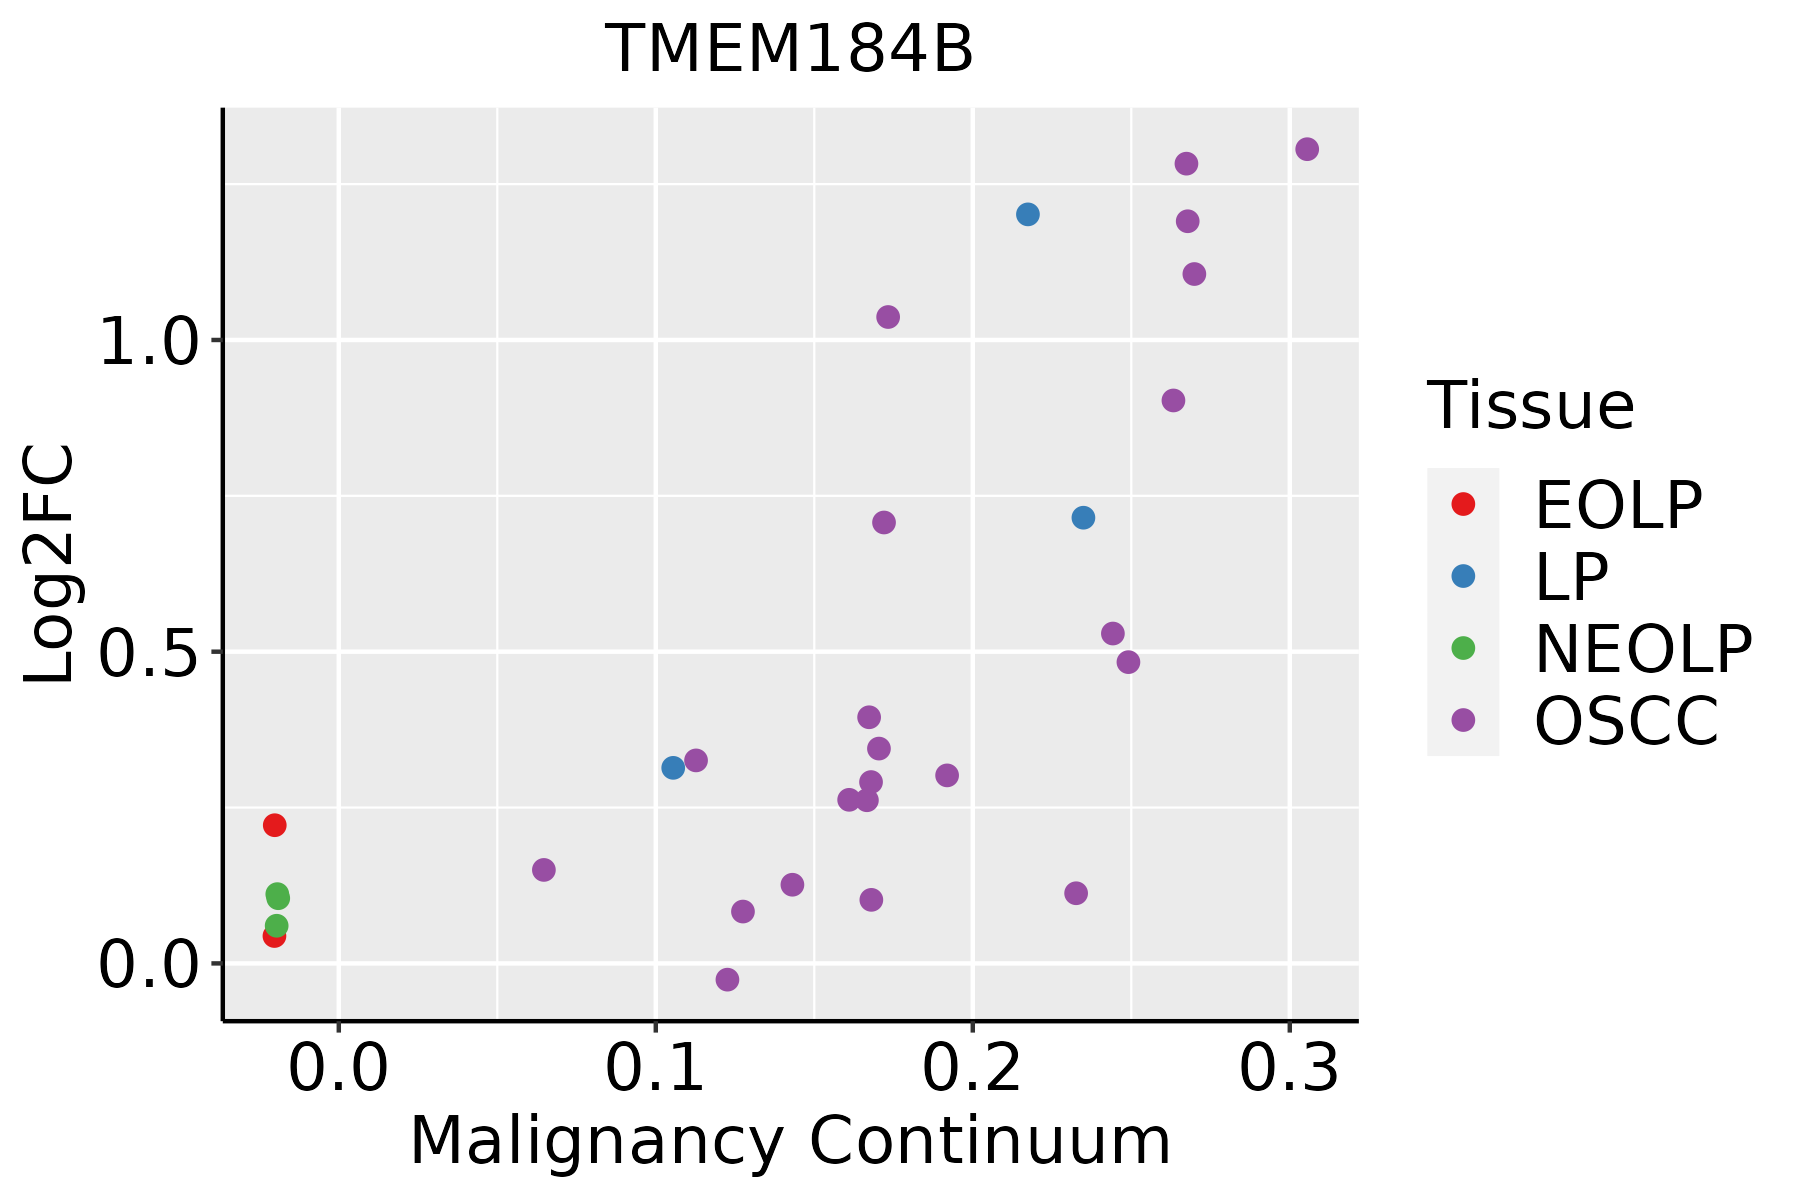 | EOLP: Erosive Oral lichen planus |
| LP: leukoplakia | ||
| NEOLP: Non-erosive oral lichen planus | ||
| OSCC: Oral squamous cell carcinoma | ||
| Skin |  | AK: Actinic keratosis |
| cSCC: Cutaneous squamous cell carcinoma | ||
| SCCIS:squamous cell carcinoma in situ | ||
| Thyroid |  | ATC: Anaplastic thyroid cancer |
| HT: Hashimoto's thyroiditis | ||
| PTC: Papillary thyroid cancer |
| ∗log2FC in expression of this searched gene in stem-like cells from each diseased tissue sample relative to stem-like cells in normal samples in each tissue plotted against the malignancy continuum. Samples are colored based on if they are from different disease stage. |
Top |
Malignant transformation related pathway analysis |
| Find out the enriched GO biological processes and KEGG pathways involved in transition from healthy to precancer to cancer |
| Tissue | Disease Stage | Enriched GO biological Processes |
| Colorectum | AD |  |
| Colorectum | SER |  |
| Colorectum | MSS |  |
| Colorectum | MSI-H |  |
| Colorectum | FAP |  |
| ∗Top 15 enriched GO BP terms are showed in the bar plot of each disease state in each tissue. Each row represents a significant GO biological process which is colored according to the -log10(p.adjust). |
| Page: 1 2 3 4 5 6 7 8 9 |
| GO ID | Tissue | Disease Stage | Description | Gene Ratio | Bg Ratio | pvalue | p.adjust | Count |
| Page: 1 |
| Pathway ID | Tissue | Disease Stage | Description | Gene Ratio | Bg Ratio | pvalue | p.adjust | qvalue | Count |
| Page: 1 |
Top |
Cell-cell communication analysis |
| Identification of potential cell-cell interactions between two cell types and their ligand-receptor pairs for different disease states |
| Ligand | Receptor | LRpair | Pathway | Tissue | Disease Stage |
| Page: 1 |
Top |
Single-cell gene regulatory network inference analysis |
| Find out the significant the regulons (TFs) and the target genes of each regulon across cell types for different disease states |
| TF | Cell Type | Tissue | Disease Stage | Target Gene | RSS | Regulon Activity |
| ∗The dot plots of a searched regulon are shown for all cell subpopulations in each disease state of each tissue based on the regulon specific score inferred using pySCENIC and by calculating the average expression. |
| Page: 1 |
Top |
Somatic mutation of malignant transformation related genes |
| Annotation of somatic variants for genes involved in malignant transformation |
| Hugo Symbol | Variant Class | Variant Classification | dbSNP RS | HGVSc | HGVSp | HGVSp Short | SWISSPROT | BIOTYPE | SIFT | PolyPhen | Tumor Sample Barcode | Tissue | Histology | Sex | Age | Stage | Therapy Types | Drugs | Outcome |
| TMEM184B | SNV | Missense_Mutation | c.209G>T | p.Arg70Leu | p.R70L | Q9Y519 | protein_coding | tolerated(0.28) | benign(0.143) | TCGA-A2-A1FW-01 | Breast | breast invasive carcinoma | Female | <65 | III/IV | Chemotherapy | cytoxan | SD | |
| TMEM184B | SNV | Missense_Mutation | novel | c.258N>A | p.Phe86Leu | p.F86L | Q9Y519 | protein_coding | tolerated(0.25) | benign(0.05) | TCGA-AC-A5XS-01 | Breast | breast invasive carcinoma | Female | >=65 | I/II | Hormone Therapy | femara | SD |
| TMEM184B | insertion | In_Frame_Ins | novel | c.1069_1070insCTCCCCTCCACCTCATACCCTGTGCAATAGCTG | p.Phe357delinsSerProLeuHisLeuIleProCysAlaIleAlaVal | p.F357delinsSPLHLIPCAIAV | Q9Y519 | protein_coding | TCGA-A2-A0EY-01 | Breast | breast invasive carcinoma | Female | <65 | I/II | Chemotherapy | adriamycin | SD | ||
| TMEM184B | insertion | Frame_Shift_Ins | novel | c.732_733insTGTGGCCCTGCTCACAT | p.Pro245CysfsTer95 | p.P245Cfs*95 | Q9Y519 | protein_coding | TCGA-AN-A0AR-01 | Breast | breast invasive carcinoma | Female | <65 | I/II | Unknown | Unknown | SD | ||
| TMEM184B | insertion | Frame_Shift_Ins | novel | c.695_696insGGAAGAAGGGGGAG | p.Phe232LeufsTer107 | p.F232Lfs*107 | Q9Y519 | protein_coding | TCGA-BH-A0DS-01 | Breast | breast invasive carcinoma | Female | >=65 | III/IV | Chemotherapy | cyclophosphamide | SD | ||
| TMEM184B | insertion | Nonsense_Mutation | novel | c.694_695insGAATGGGGCATTG | p.Phe232Ter | p.F232* | Q9Y519 | protein_coding | TCGA-BH-A0DS-01 | Breast | breast invasive carcinoma | Female | >=65 | III/IV | Chemotherapy | cyclophosphamide | SD | ||
| TMEM184B | SNV | Missense_Mutation | rs201541960 | c.340N>A | p.Val114Ile | p.V114I | Q9Y519 | protein_coding | tolerated(0.81) | benign(0.021) | TCGA-UC-A7PF-01 | Cervix | cervical & endocervical cancer | Female | <65 | I/II | Unknown | Unknown | SD |
| TMEM184B | SNV | Missense_Mutation | c.247N>T | p.Arg83Cys | p.R83C | Q9Y519 | protein_coding | deleterious(0) | probably_damaging(0.999) | TCGA-A6-6780-01 | Colorectum | colon adenocarcinoma | Male | >=65 | I/II | Unknown | Unknown | SD | |
| TMEM184B | SNV | Missense_Mutation | rs764715358 | c.85G>A | p.Glu29Lys | p.E29K | Q9Y519 | protein_coding | tolerated(0.51) | benign(0) | TCGA-AA-3530-01 | Colorectum | colon adenocarcinoma | Male | >=65 | I/II | Unknown | Unknown | SD |
| TMEM184B | SNV | Missense_Mutation | c.374N>G | p.Asn125Ser | p.N125S | Q9Y519 | protein_coding | tolerated(0.57) | benign(0.01) | TCGA-CK-4951-01 | Colorectum | colon adenocarcinoma | Female | >=65 | I/II | Unknown | Unknown | PD |
| Page: 1 2 3 4 |
Top |
Related drugs of malignant transformation related genes |
| Identification of chemicals and drugs interact with genes involved in malignant transfromation |
| (DGIdb 4.0) |
| Entrez ID | Symbol | Category | Interaction Types | Drug Claim Name | Drug Name | PMIDs |
| Page: 1 |

Copyright 2023-Present -The University of Texas Health Science Center at Houston |