
|
|||||
|
 | |
| |
| |
| |
| |
| |
|
Gene: TMEM184A |
Gene summary for TMEM184A |
| Gene information | Species | Human | Gene symbol | TMEM184A | Gene ID | 202915 |
| Gene name | transmembrane protein 184A | |
| Gene Alias | SDMG1 | |
| Cytomap | 7p22.3 | |
| Gene Type | protein-coding | GO ID | GO:0006810 | UniProtAcc | Q6ZMB5 |
Top |
Malignant transformation analysis |
| Identification of the aberrant gene expression in precancerous and cancerous lesions by comparing the gene expression of stem-like cells in diseased tissues with normal stem cells |
| Entrez ID | Symbol | Replicates | Species | Organ | Tissue | Adj P-value | Log2FC | Malignancy |
| 202915 | TMEM184A | LZE20T | Human | Esophagus | ESCC | 1.59e-12 | 3.64e-01 | 0.0662 |
| 202915 | TMEM184A | LZE22T | Human | Esophagus | ESCC | 1.57e-03 | 3.28e-01 | 0.068 |
| 202915 | TMEM184A | LZE24T | Human | Esophagus | ESCC | 4.15e-02 | 9.91e-02 | 0.0596 |
| 202915 | TMEM184A | P1T-E | Human | Esophagus | ESCC | 3.58e-07 | 3.41e-01 | 0.0875 |
| 202915 | TMEM184A | P2T-E | Human | Esophagus | ESCC | 1.78e-03 | 8.78e-02 | 0.1177 |
| 202915 | TMEM184A | P5T-E | Human | Esophagus | ESCC | 8.84e-05 | 9.96e-02 | 0.1327 |
| 202915 | TMEM184A | P8T-E | Human | Esophagus | ESCC | 6.56e-15 | 2.90e-01 | 0.0889 |
| 202915 | TMEM184A | P11T-E | Human | Esophagus | ESCC | 1.20e-09 | 3.15e-01 | 0.1426 |
| 202915 | TMEM184A | P15T-E | Human | Esophagus | ESCC | 3.12e-08 | 2.34e-01 | 0.1149 |
| 202915 | TMEM184A | P17T-E | Human | Esophagus | ESCC | 8.50e-05 | 2.15e-01 | 0.1278 |
| 202915 | TMEM184A | P20T-E | Human | Esophagus | ESCC | 3.97e-02 | 8.10e-02 | 0.1124 |
| 202915 | TMEM184A | P22T-E | Human | Esophagus | ESCC | 2.61e-16 | 1.12e-01 | 0.1236 |
| 202915 | TMEM184A | P23T-E | Human | Esophagus | ESCC | 2.37e-12 | 3.49e-01 | 0.108 |
| 202915 | TMEM184A | P26T-E | Human | Esophagus | ESCC | 7.98e-13 | 2.14e-01 | 0.1276 |
| 202915 | TMEM184A | P27T-E | Human | Esophagus | ESCC | 4.17e-05 | 9.30e-02 | 0.1055 |
| 202915 | TMEM184A | P28T-E | Human | Esophagus | ESCC | 2.05e-07 | 1.75e-01 | 0.1149 |
| 202915 | TMEM184A | P31T-E | Human | Esophagus | ESCC | 2.05e-07 | 1.64e-01 | 0.1251 |
| 202915 | TMEM184A | P37T-E | Human | Esophagus | ESCC | 1.53e-03 | 1.01e-01 | 0.1371 |
| 202915 | TMEM184A | P38T-E | Human | Esophagus | ESCC | 5.18e-03 | 1.83e-01 | 0.127 |
| 202915 | TMEM184A | P39T-E | Human | Esophagus | ESCC | 8.56e-12 | 2.38e-01 | 0.0894 |
| Page: 1 2 3 |
| Tissue | Expression Dynamics | Abbreviation |
| Esophagus | 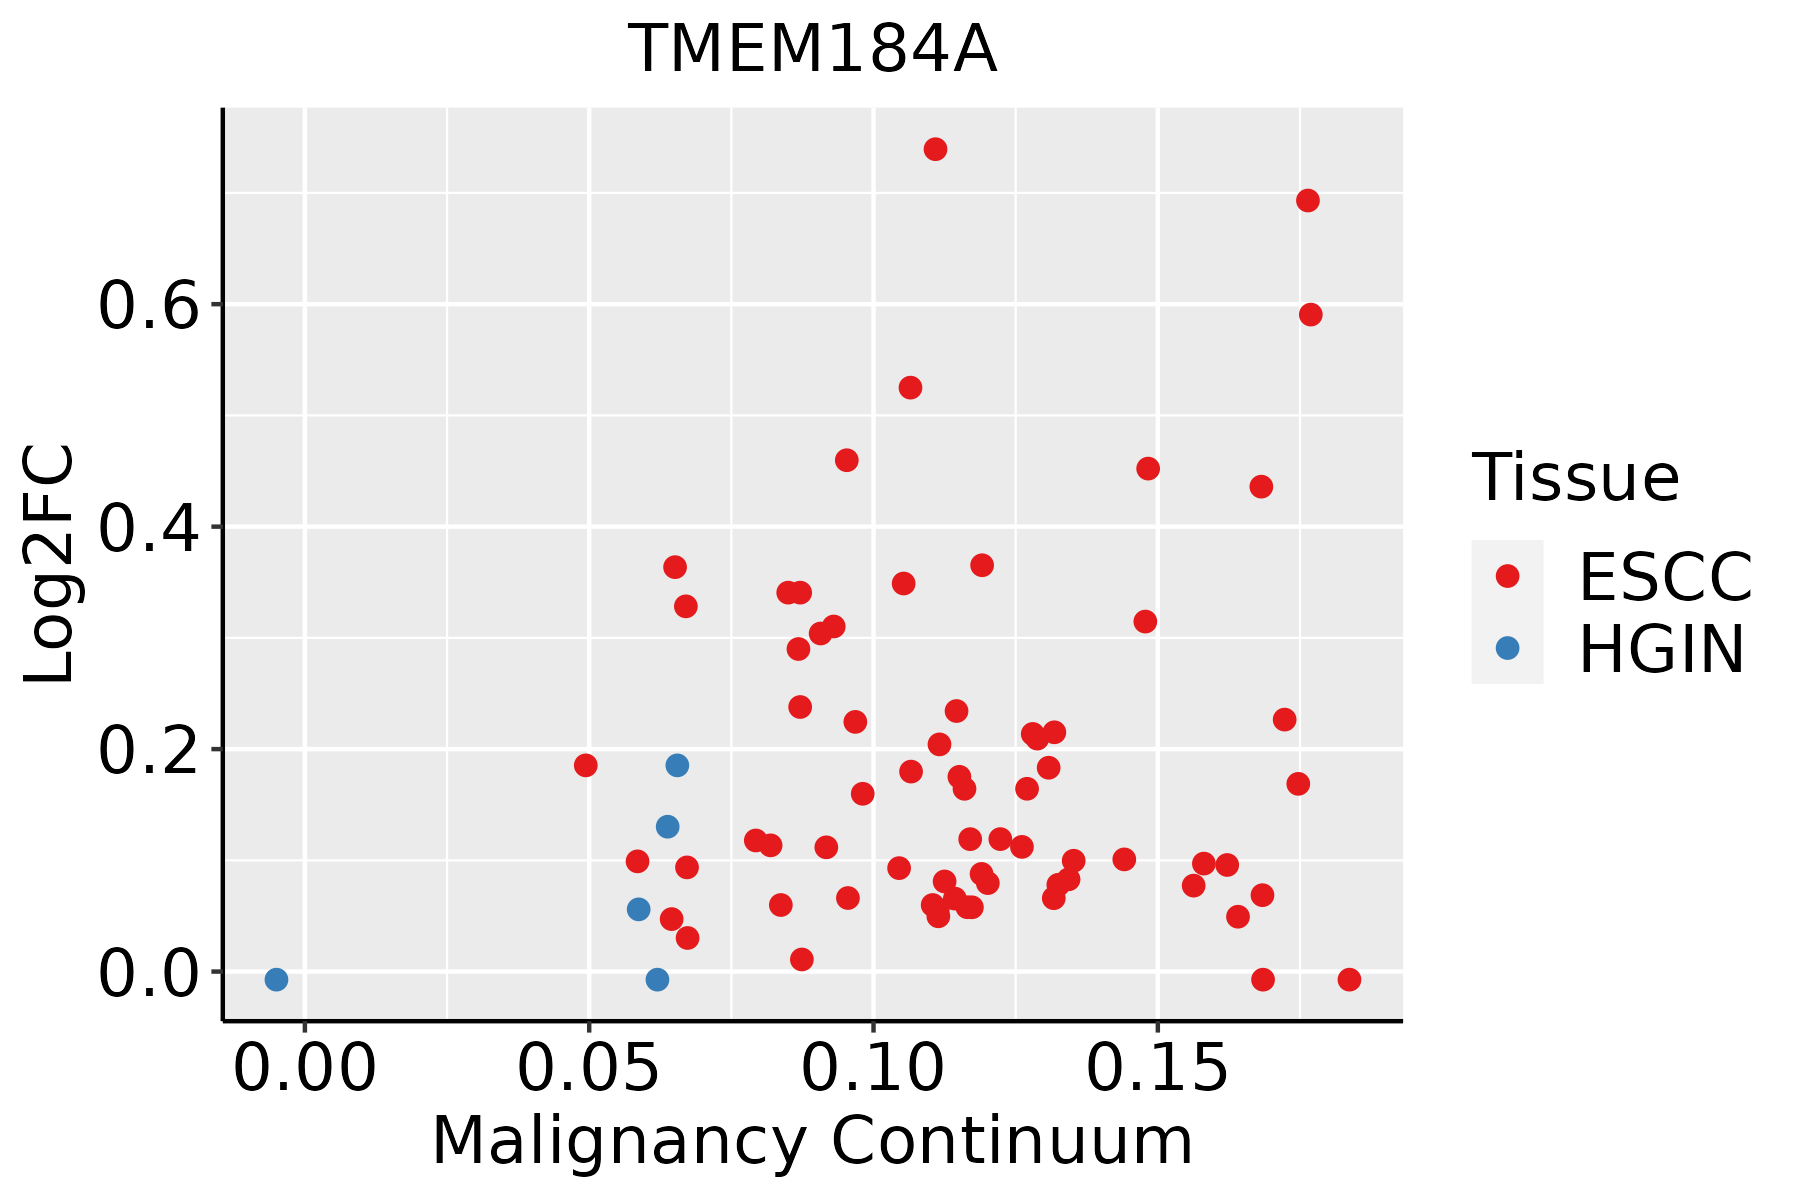 | ESCC: Esophageal squamous cell carcinoma |
| HGIN: High-grade intraepithelial neoplasias | ||
| LGIN: Low-grade intraepithelial neoplasias | ||
| Liver |  | HCC: Hepatocellular carcinoma |
| NAFLD: Non-alcoholic fatty liver disease | ||
| Oral Cavity |  | EOLP: Erosive Oral lichen planus |
| LP: leukoplakia | ||
| NEOLP: Non-erosive oral lichen planus | ||
| OSCC: Oral squamous cell carcinoma |
| ∗log2FC in expression of this searched gene in stem-like cells from each diseased tissue sample relative to stem-like cells in normal samples in each tissue plotted against the malignancy continuum. Samples are colored based on if they are from different disease stage. |
Top |
Malignant transformation related pathway analysis |
| Find out the enriched GO biological processes and KEGG pathways involved in transition from healthy to precancer to cancer |
| Tissue | Disease Stage | Enriched GO biological Processes |
| Colorectum | AD |  |
| Colorectum | SER |  |
| Colorectum | MSS |  |
| Colorectum | MSI-H |  |
| Colorectum | FAP |  |
| ∗Top 15 enriched GO BP terms are showed in the bar plot of each disease state in each tissue. Each row represents a significant GO biological process which is colored according to the -log10(p.adjust). |
| Page: 1 2 3 4 5 6 7 8 9 |
| GO ID | Tissue | Disease Stage | Description | Gene Ratio | Bg Ratio | pvalue | p.adjust | Count |
| Page: 1 |
| Pathway ID | Tissue | Disease Stage | Description | Gene Ratio | Bg Ratio | pvalue | p.adjust | qvalue | Count |
| Page: 1 |
Top |
Cell-cell communication analysis |
| Identification of potential cell-cell interactions between two cell types and their ligand-receptor pairs for different disease states |
| Ligand | Receptor | LRpair | Pathway | Tissue | Disease Stage |
| Page: 1 |
Top |
Single-cell gene regulatory network inference analysis |
| Find out the significant the regulons (TFs) and the target genes of each regulon across cell types for different disease states |
| TF | Cell Type | Tissue | Disease Stage | Target Gene | RSS | Regulon Activity |
| ∗The dot plots of a searched regulon are shown for all cell subpopulations in each disease state of each tissue based on the regulon specific score inferred using pySCENIC and by calculating the average expression. |
| Page: 1 |
Top |
Somatic mutation of malignant transformation related genes |
| Annotation of somatic variants for genes involved in malignant transformation |
| Hugo Symbol | Variant Class | Variant Classification | dbSNP RS | HGVSc | HGVSp | HGVSp Short | SWISSPROT | BIOTYPE | SIFT | PolyPhen | Tumor Sample Barcode | Tissue | Histology | Sex | Age | Stage | Therapy Types | Drugs | Outcome |
| TMEM184A | SNV | Missense_Mutation | rs766707030 | c.493N>A | p.Gly165Ser | p.G165S | Q6ZMB5 | protein_coding | tolerated(0.5) | possibly_damaging(0.603) | TCGA-AC-A2BK-01 | Breast | breast invasive carcinoma | Female | >=65 | III/IV | Chemotherapy | cytoxan | CR |
| TMEM184A | SNV | Missense_Mutation | novel | c.988G>A | p.Ala330Thr | p.A330T | Q6ZMB5 | protein_coding | tolerated(0.1) | benign(0.043) | TCGA-V7-A7HQ-01 | Breast | breast invasive carcinoma | Female | >=65 | III/IV | Hormone Therapy | letrozole | CR |
| TMEM184A | SNV | Missense_Mutation | c.304T>A | p.Phe102Ile | p.F102I | Q6ZMB5 | protein_coding | tolerated(0.08) | benign(0.14) | TCGA-C5-A7UE-01 | Cervix | cervical & endocervical cancer | Female | <65 | I/II | Chemotherapy | cisplatin | SD | |
| TMEM184A | SNV | Missense_Mutation | c.255G>T | p.Gln85His | p.Q85H | Q6ZMB5 | protein_coding | tolerated(0.11) | benign(0.007) | TCGA-A6-5665-01 | Colorectum | colon adenocarcinoma | Female | >=65 | I/II | Unknown | Unknown | PD | |
| TMEM184A | SNV | Missense_Mutation | rs201658924 | c.790N>A | p.Val264Ile | p.V264I | Q6ZMB5 | protein_coding | tolerated(0.2) | benign(0.19) | TCGA-AA-A010-01 | Colorectum | colon adenocarcinoma | Female | <65 | I/II | Chemotherapy | folinic | CR |
| TMEM184A | SNV | Missense_Mutation | rs769628960 | c.700N>A | p.Ala234Thr | p.A234T | Q6ZMB5 | protein_coding | deleterious(0) | probably_damaging(0.99) | TCGA-AZ-4682-01 | Colorectum | colon adenocarcinoma | Male | <65 | I/II | Chemotherapy | camptosar | PD |
| TMEM184A | SNV | Missense_Mutation | c.60G>T | p.Trp20Cys | p.W20C | Q6ZMB5 | protein_coding | deleterious_low_confidence(0.01) | possibly_damaging(0.533) | TCGA-CK-6748-01 | Colorectum | colon adenocarcinoma | Female | <65 | III/IV | Unknown | Unknown | SD | |
| TMEM184A | SNV | Missense_Mutation | c.456N>T | p.Glu152Asp | p.E152D | Q6ZMB5 | protein_coding | deleterious(0.02) | probably_damaging(0.928) | TCGA-DM-A28A-01 | Colorectum | colon adenocarcinoma | Male | >=65 | III/IV | Unknown | Unknown | SD | |
| TMEM184A | SNV | Missense_Mutation | rs200028247 | c.1019C>T | p.Pro340Leu | p.P340L | Q6ZMB5 | protein_coding | tolerated(0.57) | benign(0.001) | TCGA-F4-6570-01 | Colorectum | colon adenocarcinoma | Female | >=65 | I/II | Unknown | Unknown | SD |
| TMEM184A | SNV | Missense_Mutation | novel | c.439G>T | p.Gly147Cys | p.G147C | Q6ZMB5 | protein_coding | deleterious(0.03) | possibly_damaging(0.895) | TCGA-A5-A0G1-01 | Endometrium | uterine corpus endometrioid carcinoma | Female | >=65 | I/II | Unknown | Unknown | SD |
| Page: 1 2 3 4 5 |
Top |
Related drugs of malignant transformation related genes |
| Identification of chemicals and drugs interact with genes involved in malignant transfromation |
| (DGIdb 4.0) |
| Entrez ID | Symbol | Category | Interaction Types | Drug Claim Name | Drug Name | PMIDs |
| Page: 1 |

Copyright 2023-Present -The University of Texas Health Science Center at Houston |