
|
|||||
|
 | |
| |
| |
| |
| |
| |
|
Gene: TMEM183A |
Gene summary for TMEM183A |
| Gene information | Species | Human | Gene symbol | TMEM183A | Gene ID | 92703 |
| Gene name | transmembrane protein 183A | |
| Gene Alias | C1orf37 | |
| Cytomap | 1q32.1 | |
| Gene Type | protein-coding | GO ID | GO:0008150 | UniProtAcc | Q8IXX5 |
Top |
Malignant transformation analysis |
| Identification of the aberrant gene expression in precancerous and cancerous lesions by comparing the gene expression of stem-like cells in diseased tissues with normal stem cells |
| Entrez ID | Symbol | Replicates | Species | Organ | Tissue | Adj P-value | Log2FC | Malignancy |
| 92703 | TMEM183A | HTA11_1938_2000001011 | Human | Colorectum | AD | 4.94e-05 | 3.38e-01 | -0.0811 |
| 92703 | TMEM183A | HTA11_78_2000001011 | Human | Colorectum | AD | 1.17e-04 | 3.93e-01 | -0.1088 |
| 92703 | TMEM183A | HTA11_347_2000001011 | Human | Colorectum | AD | 8.85e-18 | 4.93e-01 | -0.1954 |
| 92703 | TMEM183A | HTA11_1391_2000001011 | Human | Colorectum | AD | 1.03e-04 | 3.35e-01 | -0.059 |
| 92703 | TMEM183A | HTA11_546_2000001011 | Human | Colorectum | AD | 3.64e-02 | 3.45e-01 | -0.0842 |
| 92703 | TMEM183A | HTA11_866_3004761011 | Human | Colorectum | AD | 1.99e-02 | 2.38e-01 | 0.096 |
| 92703 | TMEM183A | HTA11_6801_2000001011 | Human | Colorectum | SER | 1.66e-03 | 4.99e-01 | 0.0171 |
| 92703 | TMEM183A | HTA11_7696_3000711011 | Human | Colorectum | AD | 6.32e-03 | 2.22e-01 | 0.0674 |
| 92703 | TMEM183A | HTA11_99999970781_79442 | Human | Colorectum | MSS | 4.28e-08 | 3.17e-01 | 0.294 |
| 92703 | TMEM183A | HTA11_99999971662_82457 | Human | Colorectum | MSS | 4.12e-12 | 3.67e-01 | 0.3859 |
| 92703 | TMEM183A | LZE2D | Human | Esophagus | HGIN | 6.19e-03 | 4.06e-01 | 0.0642 |
| 92703 | TMEM183A | LZE2T | Human | Esophagus | ESCC | 6.66e-11 | 1.39e+00 | 0.082 |
| 92703 | TMEM183A | LZE4T | Human | Esophagus | ESCC | 3.74e-14 | 5.28e-01 | 0.0811 |
| 92703 | TMEM183A | LZE5T | Human | Esophagus | ESCC | 3.24e-03 | 4.59e-01 | 0.0514 |
| 92703 | TMEM183A | LZE7T | Human | Esophagus | ESCC | 7.32e-14 | 9.72e-01 | 0.0667 |
| 92703 | TMEM183A | LZE8T | Human | Esophagus | ESCC | 1.16e-03 | 2.48e-01 | 0.067 |
| 92703 | TMEM183A | LZE20T | Human | Esophagus | ESCC | 4.47e-14 | 5.06e-01 | 0.0662 |
| 92703 | TMEM183A | LZE22T | Human | Esophagus | ESCC | 7.32e-10 | 1.02e+00 | 0.068 |
| 92703 | TMEM183A | LZE24T | Human | Esophagus | ESCC | 4.58e-34 | 1.06e+00 | 0.0596 |
| 92703 | TMEM183A | LZE21T | Human | Esophagus | ESCC | 2.86e-03 | 3.49e-01 | 0.0655 |
| Page: 1 2 3 4 5 6 7 |
| Tissue | Expression Dynamics | Abbreviation |
| Colorectum (GSE201348) |  | FAP: Familial adenomatous polyposis |
| CRC: Colorectal cancer | ||
| Colorectum (HTA11) |  | AD: Adenomas |
| SER: Sessile serrated lesions | ||
| MSI-H: Microsatellite-high colorectal cancer | ||
| MSS: Microsatellite stable colorectal cancer | ||
| Esophagus |  | ESCC: Esophageal squamous cell carcinoma |
| HGIN: High-grade intraepithelial neoplasias | ||
| LGIN: Low-grade intraepithelial neoplasias | ||
| Liver |  | HCC: Hepatocellular carcinoma |
| NAFLD: Non-alcoholic fatty liver disease | ||
| Oral Cavity | 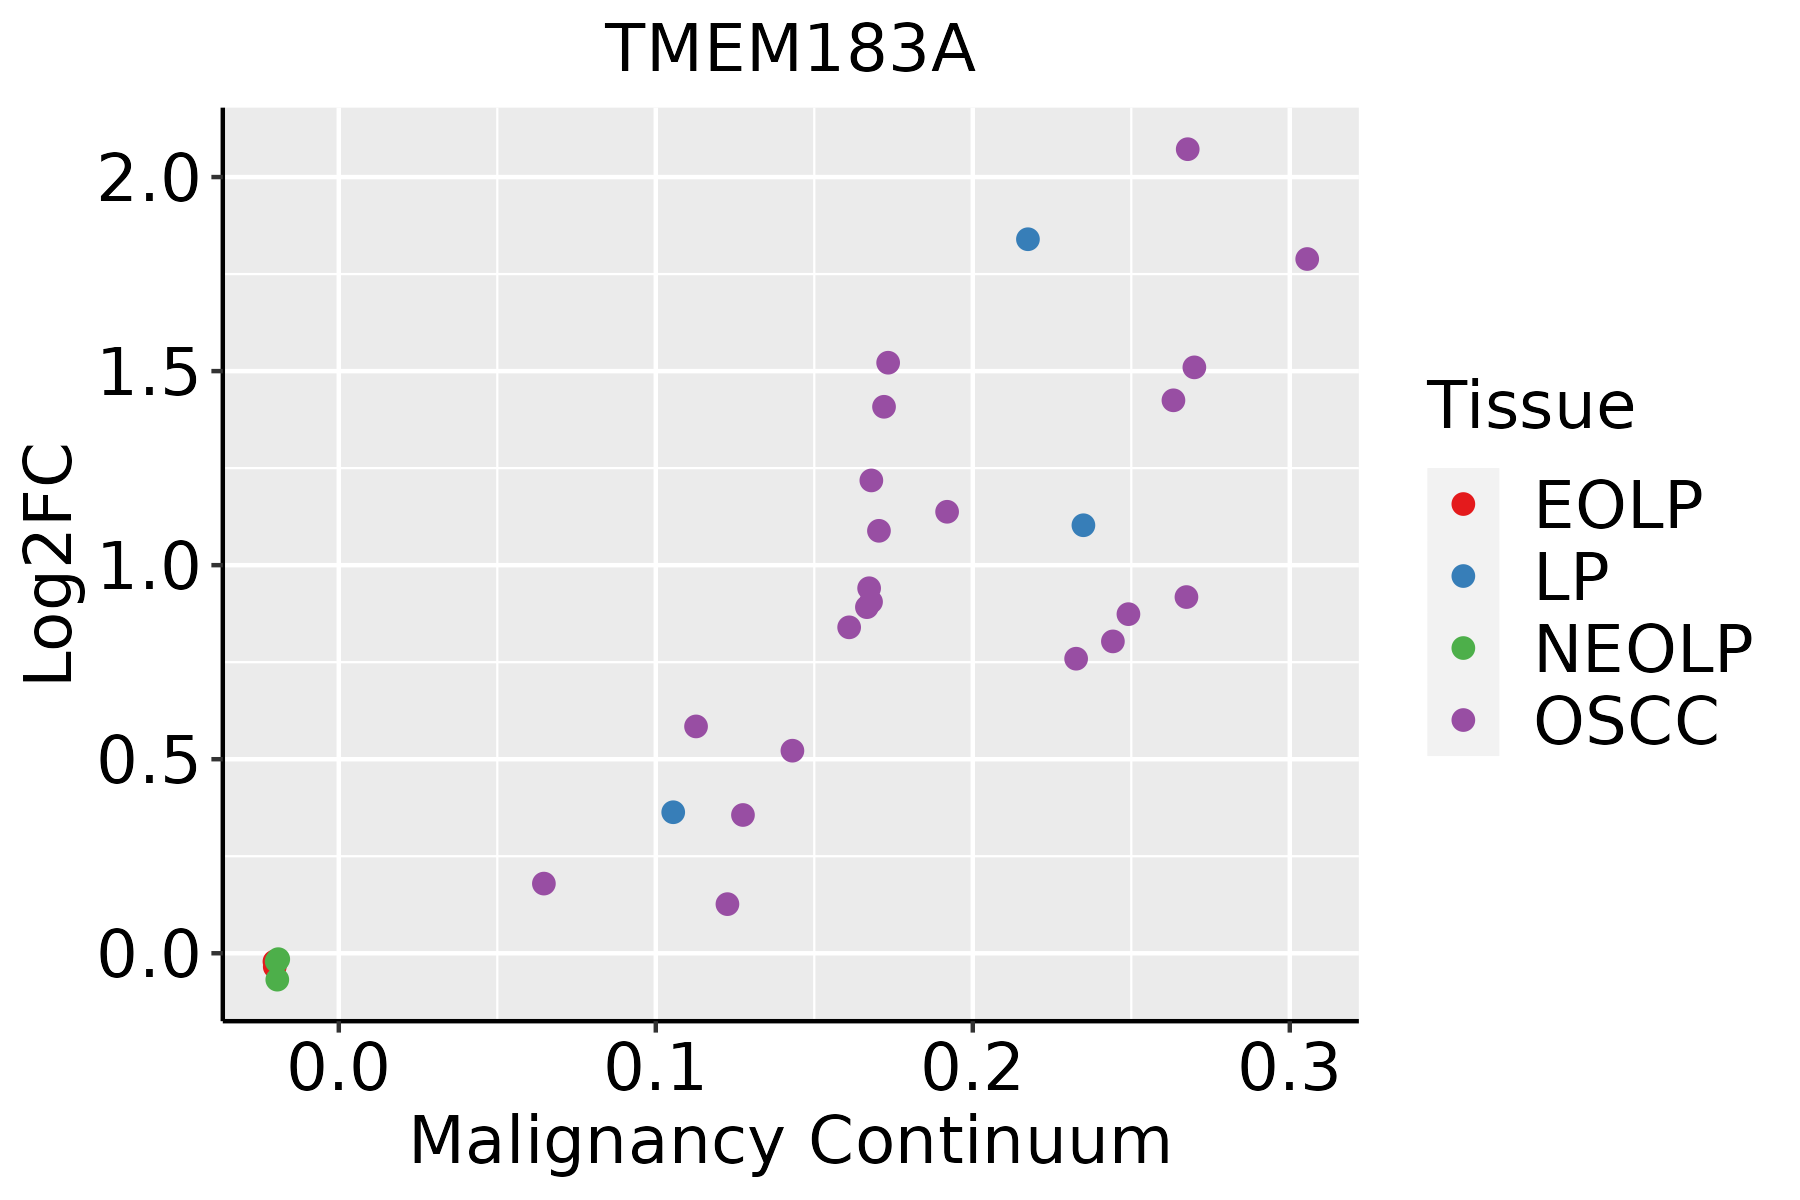 | EOLP: Erosive Oral lichen planus |
| LP: leukoplakia | ||
| NEOLP: Non-erosive oral lichen planus | ||
| OSCC: Oral squamous cell carcinoma | ||
| Skin | 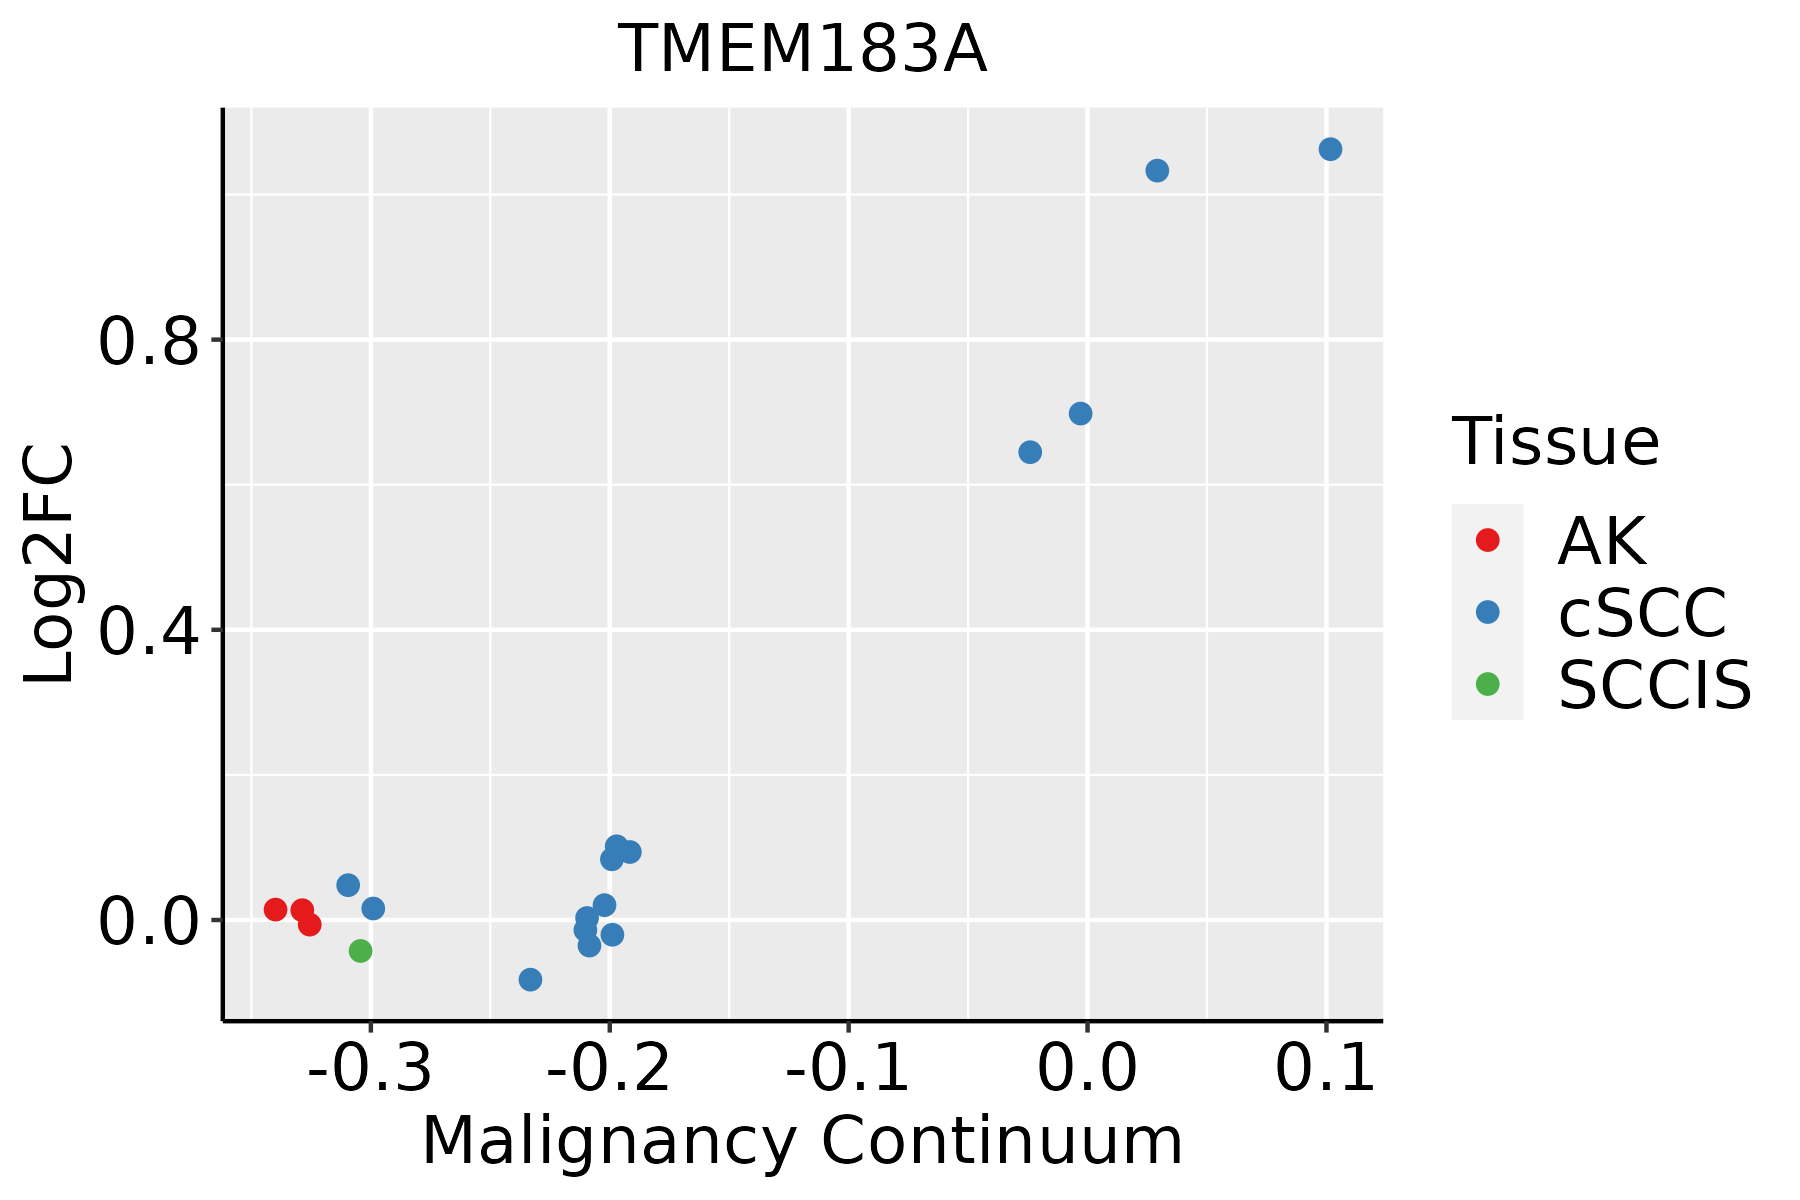 | AK: Actinic keratosis |
| cSCC: Cutaneous squamous cell carcinoma | ||
| SCCIS:squamous cell carcinoma in situ | ||
| Thyroid | 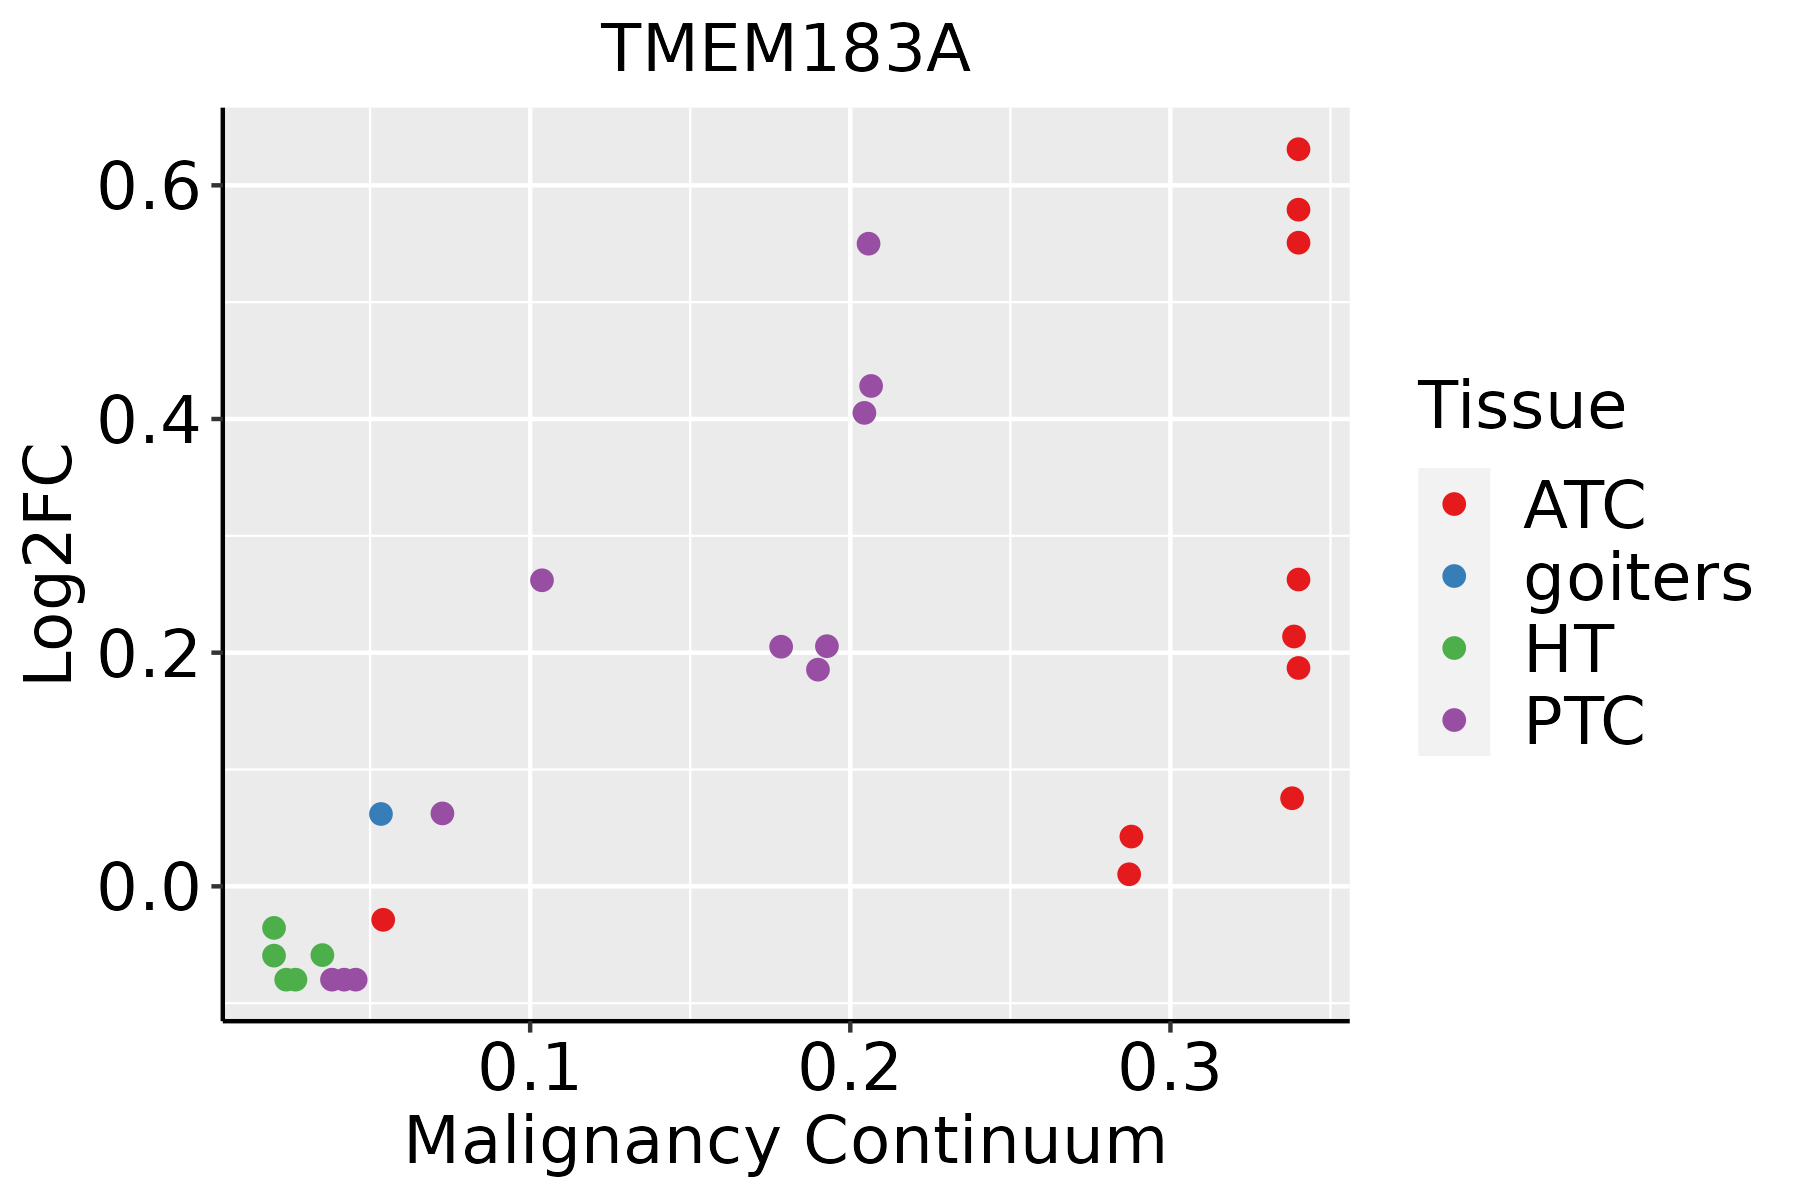 | ATC: Anaplastic thyroid cancer |
| HT: Hashimoto's thyroiditis | ||
| PTC: Papillary thyroid cancer |
| ∗log2FC in expression of this searched gene in stem-like cells from each diseased tissue sample relative to stem-like cells in normal samples in each tissue plotted against the malignancy continuum. Samples are colored based on if they are from different disease stage. |
Top |
Malignant transformation related pathway analysis |
| Find out the enriched GO biological processes and KEGG pathways involved in transition from healthy to precancer to cancer |
| Tissue | Disease Stage | Enriched GO biological Processes |
| Colorectum | AD |  |
| Colorectum | SER |  |
| Colorectum | MSS |  |
| Colorectum | MSI-H |  |
| Colorectum | FAP |  |
| ∗Top 15 enriched GO BP terms are showed in the bar plot of each disease state in each tissue. Each row represents a significant GO biological process which is colored according to the -log10(p.adjust). |
| Page: 1 2 3 4 5 6 7 8 9 |
| GO ID | Tissue | Disease Stage | Description | Gene Ratio | Bg Ratio | pvalue | p.adjust | Count |
| GO:0031647 | Colorectum | AD | regulation of protein stability | 108/3918 | 298/18723 | 6.33e-10 | 5.08e-08 | 108 |
| GO:00316471 | Colorectum | SER | regulation of protein stability | 86/2897 | 298/18723 | 2.56e-09 | 2.42e-07 | 86 |
| GO:00316472 | Colorectum | MSS | regulation of protein stability | 103/3467 | 298/18723 | 2.52e-11 | 3.49e-09 | 103 |
| GO:003164727 | Esophagus | HGIN | regulation of protein stability | 96/2587 | 298/18723 | 2.21e-16 | 5.76e-14 | 96 |
| GO:0031647111 | Esophagus | ESCC | regulation of protein stability | 223/8552 | 298/18723 | 5.76e-25 | 1.52e-22 | 223 |
| GO:003164712 | Liver | Cirrhotic | regulation of protein stability | 144/4634 | 298/18723 | 6.74e-19 | 1.28e-16 | 144 |
| GO:003164722 | Liver | HCC | regulation of protein stability | 211/7958 | 298/18723 | 2.29e-23 | 5.01e-21 | 211 |
| GO:003164720 | Oral cavity | OSCC | regulation of protein stability | 193/7305 | 298/18723 | 1.30e-19 | 1.95e-17 | 193 |
| GO:0031647110 | Oral cavity | LP | regulation of protein stability | 132/4623 | 298/18723 | 8.16e-14 | 7.99e-12 | 132 |
| GO:003164729 | Skin | cSCC | regulation of protein stability | 144/4864 | 298/18723 | 6.51e-17 | 6.80e-15 | 144 |
| GO:0031647113 | Thyroid | PTC | regulation of protein stability | 174/5968 | 298/18723 | 2.05e-21 | 4.05e-19 | 174 |
| GO:003164734 | Thyroid | ATC | regulation of protein stability | 177/6293 | 298/18723 | 4.08e-20 | 6.46e-18 | 177 |
| Page: 1 |
| Pathway ID | Tissue | Disease Stage | Description | Gene Ratio | Bg Ratio | pvalue | p.adjust | qvalue | Count |
| Page: 1 |
Top |
Cell-cell communication analysis |
| Identification of potential cell-cell interactions between two cell types and their ligand-receptor pairs for different disease states |
| Ligand | Receptor | LRpair | Pathway | Tissue | Disease Stage |
| Page: 1 |
Top |
Single-cell gene regulatory network inference analysis |
| Find out the significant the regulons (TFs) and the target genes of each regulon across cell types for different disease states |
| TF | Cell Type | Tissue | Disease Stage | Target Gene | RSS | Regulon Activity |
| ∗The dot plots of a searched regulon are shown for all cell subpopulations in each disease state of each tissue based on the regulon specific score inferred using pySCENIC and by calculating the average expression. |
| Page: 1 |
Top |
Somatic mutation of malignant transformation related genes |
| Annotation of somatic variants for genes involved in malignant transformation |
| Hugo Symbol | Variant Class | Variant Classification | dbSNP RS | HGVSc | HGVSp | HGVSp Short | SWISSPROT | BIOTYPE | SIFT | PolyPhen | Tumor Sample Barcode | Tissue | Histology | Sex | Age | Stage | Therapy Types | Drugs | Outcome |
| TMEM183A | SNV | Missense_Mutation | novel | c.957T>G | p.Asn319Lys | p.N319K | Q8IXX5 | protein_coding | tolerated(0.09) | benign(0.23) | TCGA-2W-A8YY-01 | Cervix | cervical & endocervical cancer | Female | <65 | I/II | Chemotherapy | cisplatin | CR |
| TMEM183A | SNV | Missense_Mutation | rs759000597 | c.656N>T | p.Ser219Phe | p.S219F | Q8IXX5 | protein_coding | tolerated(0.14) | possibly_damaging(0.814) | TCGA-JX-A3Q0-01 | Cervix | cervical & endocervical cancer | Female | <65 | III/IV | Unknown | Unknown | SD |
| TMEM183A | SNV | Missense_Mutation | c.699G>T | p.Lys233Asn | p.K233N | Q8IXX5 | protein_coding | tolerated(0.29) | possibly_damaging(0.476) | TCGA-AA-3977-01 | Colorectum | colon adenocarcinoma | Male | >=65 | I/II | Unknown | Unknown | SD | |
| TMEM183A | SNV | Missense_Mutation | c.677A>G | p.Glu226Gly | p.E226G | Q8IXX5 | protein_coding | deleterious(0) | possibly_damaging(0.564) | TCGA-AA-A02J-01 | Colorectum | colon adenocarcinoma | Female | >=65 | III/IV | Unknown | Unknown | PD | |
| TMEM183A | SNV | Missense_Mutation | rs760661763 | c.1025N>A | p.Arg342Gln | p.R342Q | Q8IXX5 | protein_coding | tolerated(0.21) | benign(0.091) | TCGA-AU-6004-01 | Colorectum | colon adenocarcinoma | Female | >=65 | I/II | Unknown | Unknown | SD |
| TMEM183A | SNV | Missense_Mutation | c.283N>T | p.Asp95Tyr | p.D95Y | Q8IXX5 | protein_coding | tolerated(0.21) | possibly_damaging(0.572) | TCGA-CM-6167-01 | Colorectum | colon adenocarcinoma | Female | <65 | III/IV | Unknown | Unknown | SD | |
| TMEM183A | SNV | Missense_Mutation | novel | c.909N>G | p.Ile303Met | p.I303M | Q8IXX5 | protein_coding | tolerated(0.06) | probably_damaging(0.967) | TCGA-F4-6809-01 | Colorectum | colon adenocarcinoma | Female | <65 | I/II | Unknown | Unknown | PD |
| TMEM183A | SNV | Missense_Mutation | c.560G>A | p.Arg187His | p.R187H | Q8IXX5 | protein_coding | tolerated(0.08) | benign(0.091) | TCGA-G4-6309-01 | Colorectum | colon adenocarcinoma | Female | <65 | III/IV | Chemotherapy | xeloda | PD | |
| TMEM183A | SNV | Missense_Mutation | novel | c.224N>T | p.Ala75Val | p.A75V | Q8IXX5 | protein_coding | deleterious(0.03) | benign(0.178) | TCGA-A5-A0G2-01 | Endometrium | uterine corpus endometrioid carcinoma | Female | <65 | III/IV | Unknown | Unknown | SD |
| TMEM183A | SNV | Missense_Mutation | rs200693489 | c.379N>A | p.Gly127Arg | p.G127R | Q8IXX5 | protein_coding | tolerated(0.5) | benign(0.005) | TCGA-A5-A0G2-01 | Endometrium | uterine corpus endometrioid carcinoma | Female | <65 | III/IV | Unknown | Unknown | SD |
| Page: 1 2 3 4 |
Top |
Related drugs of malignant transformation related genes |
| Identification of chemicals and drugs interact with genes involved in malignant transfromation |
| (DGIdb 4.0) |
| Entrez ID | Symbol | Category | Interaction Types | Drug Claim Name | Drug Name | PMIDs |
| Page: 1 |

Copyright 2023-Present -The University of Texas Health Science Center at Houston |