
|
|||||
|
 | |
| |
| |
| |
| |
| |
|
Gene: TMEM178A |
Gene summary for TMEM178A |
| Gene information | Species | Human | Gene symbol | TMEM178A | Gene ID | 130733 |
| Gene name | transmembrane protein 178A | |
| Gene Alias | TMEM178 | |
| Cytomap | 2p22.1 | |
| Gene Type | protein-coding | GO ID | GO:0002376 | UniProtAcc | Q8NBL3 |
Top |
Malignant transformation analysis |
| Identification of the aberrant gene expression in precancerous and cancerous lesions by comparing the gene expression of stem-like cells in diseased tissues with normal stem cells |
| Entrez ID | Symbol | Replicates | Species | Organ | Tissue | Adj P-value | Log2FC | Malignancy |
| 130733 | TMEM178A | LZE24T | Human | Esophagus | ESCC | 2.73e-10 | 5.11e-01 | 0.0596 |
| 130733 | TMEM178A | P8T-E | Human | Esophagus | ESCC | 1.54e-12 | 2.86e-01 | 0.0889 |
| 130733 | TMEM178A | P12T-E | Human | Esophagus | ESCC | 1.05e-38 | 7.57e-01 | 0.1122 |
| 130733 | TMEM178A | P57T-E | Human | Esophagus | ESCC | 2.06e-04 | 2.11e-01 | 0.0926 |
| 130733 | TMEM178A | P61T-E | Human | Esophagus | ESCC | 8.51e-03 | 6.09e-02 | 0.099 |
| 130733 | TMEM178A | P128T-E | Human | Esophagus | ESCC | 4.66e-54 | 2.23e+00 | 0.1241 |
| Page: 1 |
| Tissue | Expression Dynamics | Abbreviation |
| Esophagus | 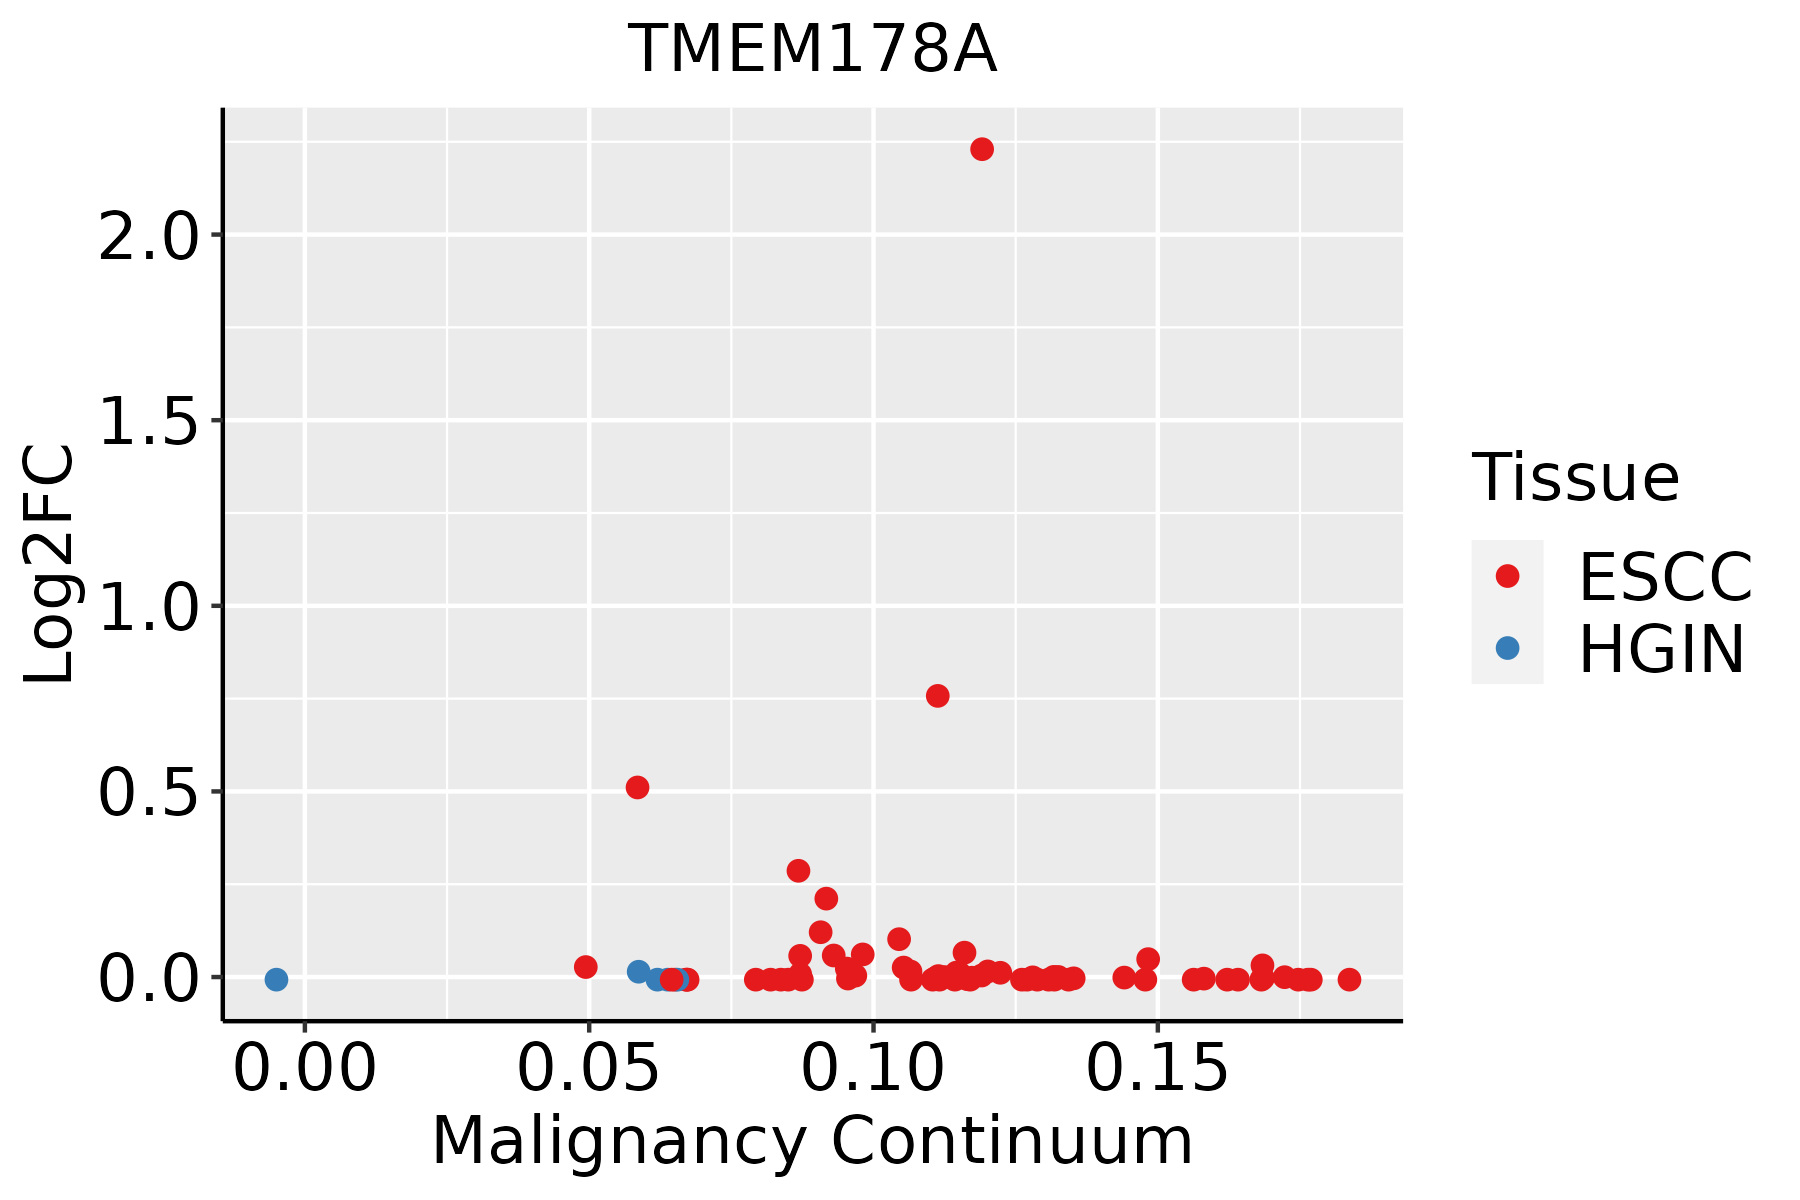 | ESCC: Esophageal squamous cell carcinoma |
| HGIN: High-grade intraepithelial neoplasias | ||
| LGIN: Low-grade intraepithelial neoplasias |
| ∗log2FC in expression of this searched gene in stem-like cells from each diseased tissue sample relative to stem-like cells in normal samples in each tissue plotted against the malignancy continuum. Samples are colored based on if they are from different disease stage. |
Top |
Malignant transformation related pathway analysis |
| Find out the enriched GO biological processes and KEGG pathways involved in transition from healthy to precancer to cancer |
| Tissue | Disease Stage | Enriched GO biological Processes |
| Colorectum | AD |  |
| Colorectum | SER |  |
| Colorectum | MSS |  |
| Colorectum | MSI-H |  |
| Colorectum | FAP |  |
| ∗Top 15 enriched GO BP terms are showed in the bar plot of each disease state in each tissue. Each row represents a significant GO biological process which is colored according to the -log10(p.adjust). |
| Page: 1 2 3 4 5 6 7 8 9 |
| GO ID | Tissue | Disease Stage | Description | Gene Ratio | Bg Ratio | pvalue | p.adjust | Count |
| GO:0030099111 | Esophagus | ESCC | myeloid cell differentiation | 232/8552 | 381/18723 | 1.22e-09 | 2.90e-08 | 232 |
| GO:000257317 | Esophagus | ESCC | myeloid leukocyte differentiation | 128/8552 | 208/18723 | 2.75e-06 | 3.15e-05 | 128 |
| GO:1903706110 | Esophagus | ESCC | regulation of hemopoiesis | 201/8552 | 367/18723 | 2.60e-04 | 1.58e-03 | 201 |
| GO:000268316 | Esophagus | ESCC | negative regulation of immune system process | 231/8552 | 434/18723 | 8.48e-04 | 4.36e-03 | 231 |
| GO:0045637111 | Esophagus | ESCC | regulation of myeloid cell differentiation | 118/8552 | 210/18723 | 1.35e-03 | 6.43e-03 | 118 |
| GO:190210510 | Esophagus | ESCC | regulation of leukocyte differentiation | 152/8552 | 279/18723 | 1.82e-03 | 8.35e-03 | 152 |
| GO:000276115 | Esophagus | ESCC | regulation of myeloid leukocyte differentiation | 69/8552 | 120/18723 | 6.00e-03 | 2.21e-02 | 69 |
| GO:00303165 | Esophagus | ESCC | osteoclast differentiation | 54/8552 | 94/18723 | 1.43e-02 | 4.65e-02 | 54 |
| Page: 1 |
| Pathway ID | Tissue | Disease Stage | Description | Gene Ratio | Bg Ratio | pvalue | p.adjust | qvalue | Count |
| Page: 1 |
Top |
Cell-cell communication analysis |
| Identification of potential cell-cell interactions between two cell types and their ligand-receptor pairs for different disease states |
| Ligand | Receptor | LRpair | Pathway | Tissue | Disease Stage |
| Page: 1 |
Top |
Single-cell gene regulatory network inference analysis |
| Find out the significant the regulons (TFs) and the target genes of each regulon across cell types for different disease states |
| TF | Cell Type | Tissue | Disease Stage | Target Gene | RSS | Regulon Activity |
| ∗The dot plots of a searched regulon are shown for all cell subpopulations in each disease state of each tissue based on the regulon specific score inferred using pySCENIC and by calculating the average expression. |
| Page: 1 |
Top |
Somatic mutation of malignant transformation related genes |
| Annotation of somatic variants for genes involved in malignant transformation |
| Hugo Symbol | Variant Class | Variant Classification | dbSNP RS | HGVSc | HGVSp | HGVSp Short | SWISSPROT | BIOTYPE | SIFT | PolyPhen | Tumor Sample Barcode | Tissue | Histology | Sex | Age | Stage | Therapy Types | Drugs | Outcome |
| TMEM178A | SNV | Missense_Mutation | novel | c.617C>A | p.Thr206Asn | p.T206N | Q8NBL3 | protein_coding | deleterious(0.01) | probably_damaging(0.95) | TCGA-AN-A0XU-01 | Breast | breast invasive carcinoma | Female | <65 | I/II | Unknown | Unknown | SD |
| TMEM178A | SNV | Missense_Mutation | rs149903489 | c.458N>A | p.Arg153Gln | p.R153Q | Q8NBL3 | protein_coding | deleterious(0.01) | probably_damaging(0.992) | TCGA-5M-AAT6-01 | Colorectum | colon adenocarcinoma | Female | <65 | III/IV | Unknown | Unknown | PD |
| TMEM178A | SNV | Missense_Mutation | rs774061489 | c.847N>T | p.Arg283Trp | p.R283W | Q8NBL3 | protein_coding | deleterious(0) | possibly_damaging(0.877) | TCGA-CM-4743-01 | Colorectum | colon adenocarcinoma | Male | >=65 | I/II | Chemotherapy | capecitabine | SD |
| TMEM178A | SNV | Missense_Mutation | novel | c.10N>T | p.Arg4Trp | p.R4W | Q8NBL3 | protein_coding | deleterious(0.02) | possibly_damaging(0.531) | TCGA-G4-6588-01 | Colorectum | colon adenocarcinoma | Female | <65 | I/II | Unknown | Unknown | SD |
| TMEM178A | SNV | Missense_Mutation | c.556N>T | p.Ala186Ser | p.A186S | Q8NBL3 | protein_coding | tolerated(0.38) | probably_damaging(0.992) | TCGA-NH-A6GC-01 | Colorectum | colon adenocarcinoma | Female | >=65 | I/II | Chemotherapy | fluorouracil | SD | |
| TMEM178A | SNV | Missense_Mutation | c.556N>T | p.Ala186Ser | p.A186S | Q8NBL3 | protein_coding | tolerated(0.38) | probably_damaging(0.992) | TCGA-WS-AB45-01 | Colorectum | colon adenocarcinoma | Female | <65 | I/II | Unknown | Unknown | SD | |
| TMEM178A | SNV | Missense_Mutation | novel | c.496N>T | p.Asp166Tyr | p.D166Y | Q8NBL3 | protein_coding | deleterious(0) | probably_damaging(0.999) | TCGA-AG-A002-01 | Colorectum | rectum adenocarcinoma | Male | <65 | I/II | Unknown | Unknown | SD |
| TMEM178A | SNV | Missense_Mutation | c.855N>T | p.Lys285Asn | p.K285N | Q8NBL3 | protein_coding | tolerated(0.48) | benign(0.173) | TCGA-AG-A002-01 | Colorectum | rectum adenocarcinoma | Male | <65 | I/II | Unknown | Unknown | SD | |
| TMEM178A | SNV | Missense_Mutation | rs149903489 | c.458N>A | p.Arg153Gln | p.R153Q | Q8NBL3 | protein_coding | deleterious(0.01) | probably_damaging(0.992) | TCGA-F5-6814-01 | Colorectum | rectum adenocarcinoma | Male | <65 | I/II | Unknown | Unknown | SD |
| TMEM178A | SNV | Missense_Mutation | rs769515311 | c.407N>T | p.Ala136Val | p.A136V | Q8NBL3 | protein_coding | tolerated(0.39) | probably_damaging(0.995) | TCGA-A5-A0G1-01 | Endometrium | uterine corpus endometrioid carcinoma | Female | >=65 | I/II | Unknown | Unknown | SD |
| Page: 1 2 3 4 |
Top |
Related drugs of malignant transformation related genes |
| Identification of chemicals and drugs interact with genes involved in malignant transfromation |
| (DGIdb 4.0) |
| Entrez ID | Symbol | Category | Interaction Types | Drug Claim Name | Drug Name | PMIDs |
| Page: 1 |

Copyright 2023-Present -The University of Texas Health Science Center at Houston |