
|
|||||
|
 | |
| |
| |
| |
| |
| |
|
Gene: TMEM176B |
Gene summary for TMEM176B |
| Gene information | Species | Human | Gene symbol | TMEM176B | Gene ID | 28959 |
| Gene name | transmembrane protein 176B | |
| Gene Alias | LR8 | |
| Cytomap | 7q36.1 | |
| Gene Type | protein-coding | GO ID | GO:0002376 | UniProtAcc | A0A090N7V7 |
Top |
Malignant transformation analysis |
| Identification of the aberrant gene expression in precancerous and cancerous lesions by comparing the gene expression of stem-like cells in diseased tissues with normal stem cells |
| Entrez ID | Symbol | Replicates | Species | Organ | Tissue | Adj P-value | Log2FC | Malignancy |
| 28959 | TMEM176B | CA_HPV_1 | Human | Cervix | CC | 4.02e-15 | -5.38e-01 | 0.0264 |
| 28959 | TMEM176B | CA_HPV_2 | Human | Cervix | CC | 2.92e-06 | -3.82e-01 | 0.0391 |
| 28959 | TMEM176B | CA_HPV_3 | Human | Cervix | CC | 2.10e-14 | -5.76e-01 | 0.0414 |
| 28959 | TMEM176B | CCI_1 | Human | Cervix | CC | 7.43e-15 | -9.57e-01 | 0.528 |
| 28959 | TMEM176B | CCI_2 | Human | Cervix | CC | 2.78e-11 | -9.35e-01 | 0.5249 |
| 28959 | TMEM176B | CCI_3 | Human | Cervix | CC | 7.71e-17 | -9.41e-01 | 0.516 |
| 28959 | TMEM176B | CCII_1 | Human | Cervix | CC | 2.30e-26 | -9.57e-01 | 0.3249 |
| 28959 | TMEM176B | Tumor | Human | Cervix | CC | 1.05e-51 | -9.54e-01 | 0.1241 |
| 28959 | TMEM176B | sample1 | Human | Cervix | CC | 1.66e-19 | -9.41e-01 | 0.0959 |
| 28959 | TMEM176B | sample3 | Human | Cervix | CC | 1.69e-49 | -9.55e-01 | 0.1387 |
| 28959 | TMEM176B | H2 | Human | Cervix | HSIL_HPV | 4.58e-14 | -4.99e-01 | 0.0632 |
| 28959 | TMEM176B | L1 | Human | Cervix | CC | 1.91e-17 | -7.81e-01 | 0.0802 |
| 28959 | TMEM176B | T1 | Human | Cervix | CC | 2.97e-40 | -9.37e-01 | 0.0918 |
| 28959 | TMEM176B | T3 | Human | Cervix | CC | 1.11e-50 | -9.54e-01 | 0.1389 |
| 28959 | TMEM176B | HTA11_3410_2000001011 | Human | Colorectum | AD | 2.04e-23 | 7.39e-01 | 0.0155 |
| 28959 | TMEM176B | HTA11_2487_2000001011 | Human | Colorectum | SER | 1.98e-14 | 8.41e-01 | -0.1808 |
| 28959 | TMEM176B | HTA11_1938_2000001011 | Human | Colorectum | AD | 1.33e-27 | 1.41e+00 | -0.0811 |
| 28959 | TMEM176B | HTA11_78_2000001011 | Human | Colorectum | AD | 3.89e-14 | 8.33e-01 | -0.1088 |
| 28959 | TMEM176B | HTA11_347_2000001011 | Human | Colorectum | AD | 1.54e-69 | 1.72e+00 | -0.1954 |
| 28959 | TMEM176B | HTA11_411_2000001011 | Human | Colorectum | SER | 4.57e-14 | 1.85e+00 | -0.2602 |
| Page: 1 2 3 4 5 6 |
| Tissue | Expression Dynamics | Abbreviation |
| Cervix | 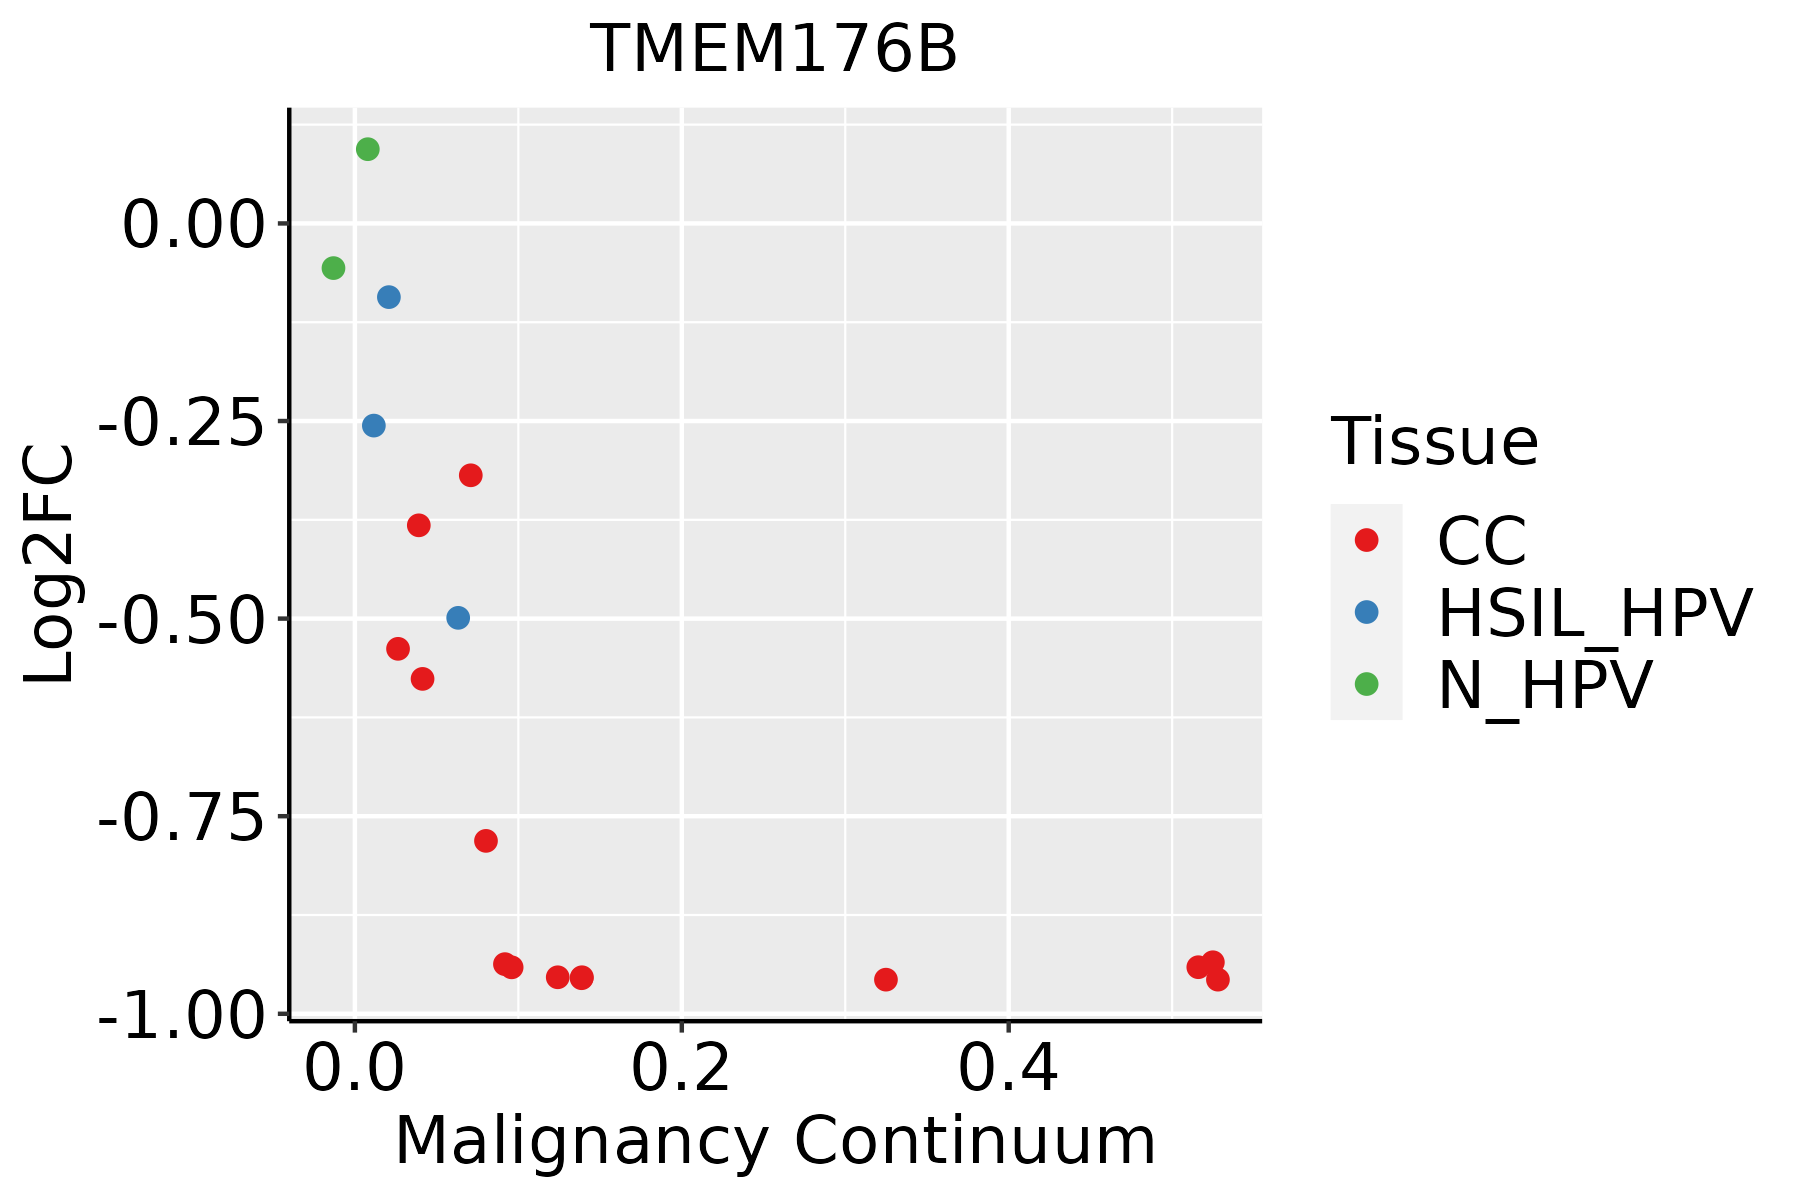 | CC: Cervix cancer |
| HSIL_HPV: HPV-infected high-grade squamous intraepithelial lesions | ||
| N_HPV: HPV-infected normal cervix | ||
| Colorectum (GSE201348) |  | FAP: Familial adenomatous polyposis |
| CRC: Colorectal cancer | ||
| Colorectum (HTA11) | 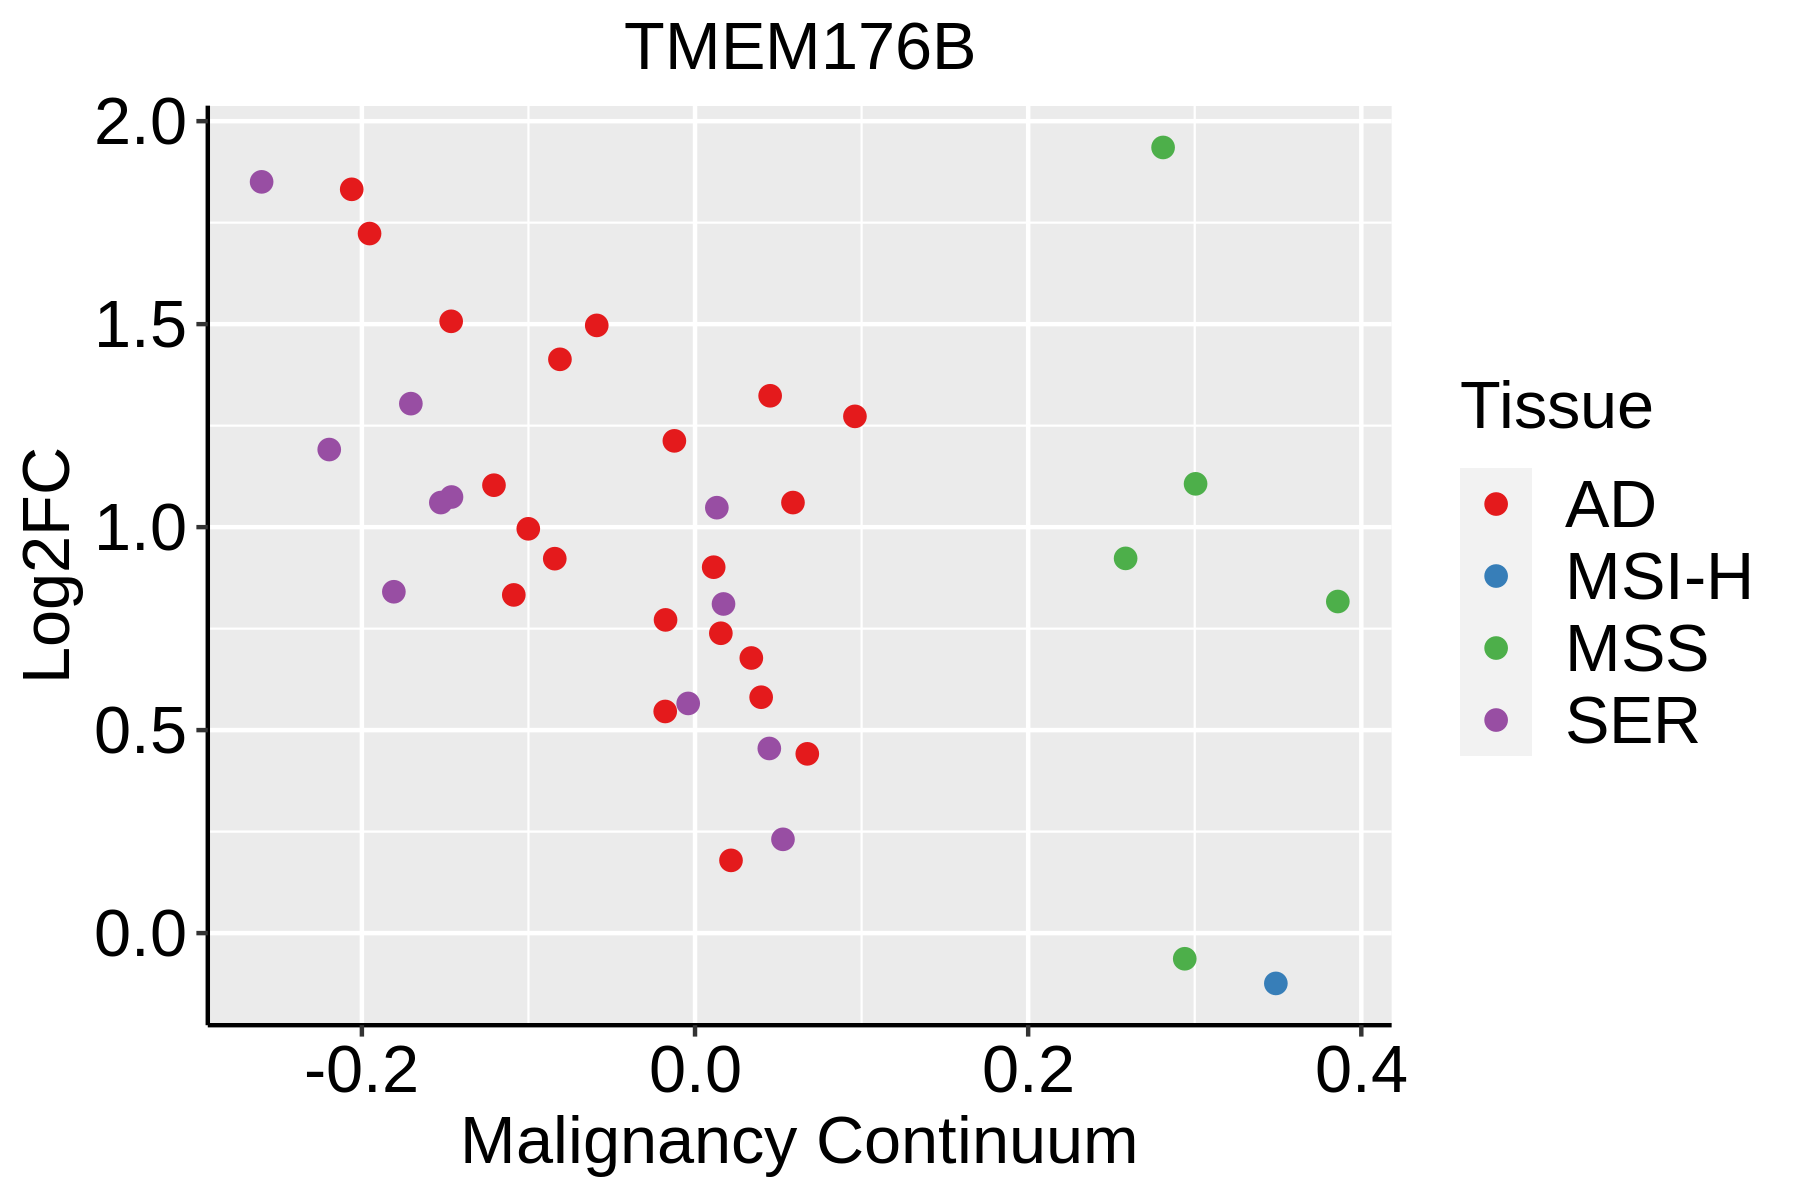 | AD: Adenomas |
| SER: Sessile serrated lesions | ||
| MSI-H: Microsatellite-high colorectal cancer | ||
| MSS: Microsatellite stable colorectal cancer | ||
| Esophagus |  | ESCC: Esophageal squamous cell carcinoma |
| HGIN: High-grade intraepithelial neoplasias | ||
| LGIN: Low-grade intraepithelial neoplasias | ||
| GC | 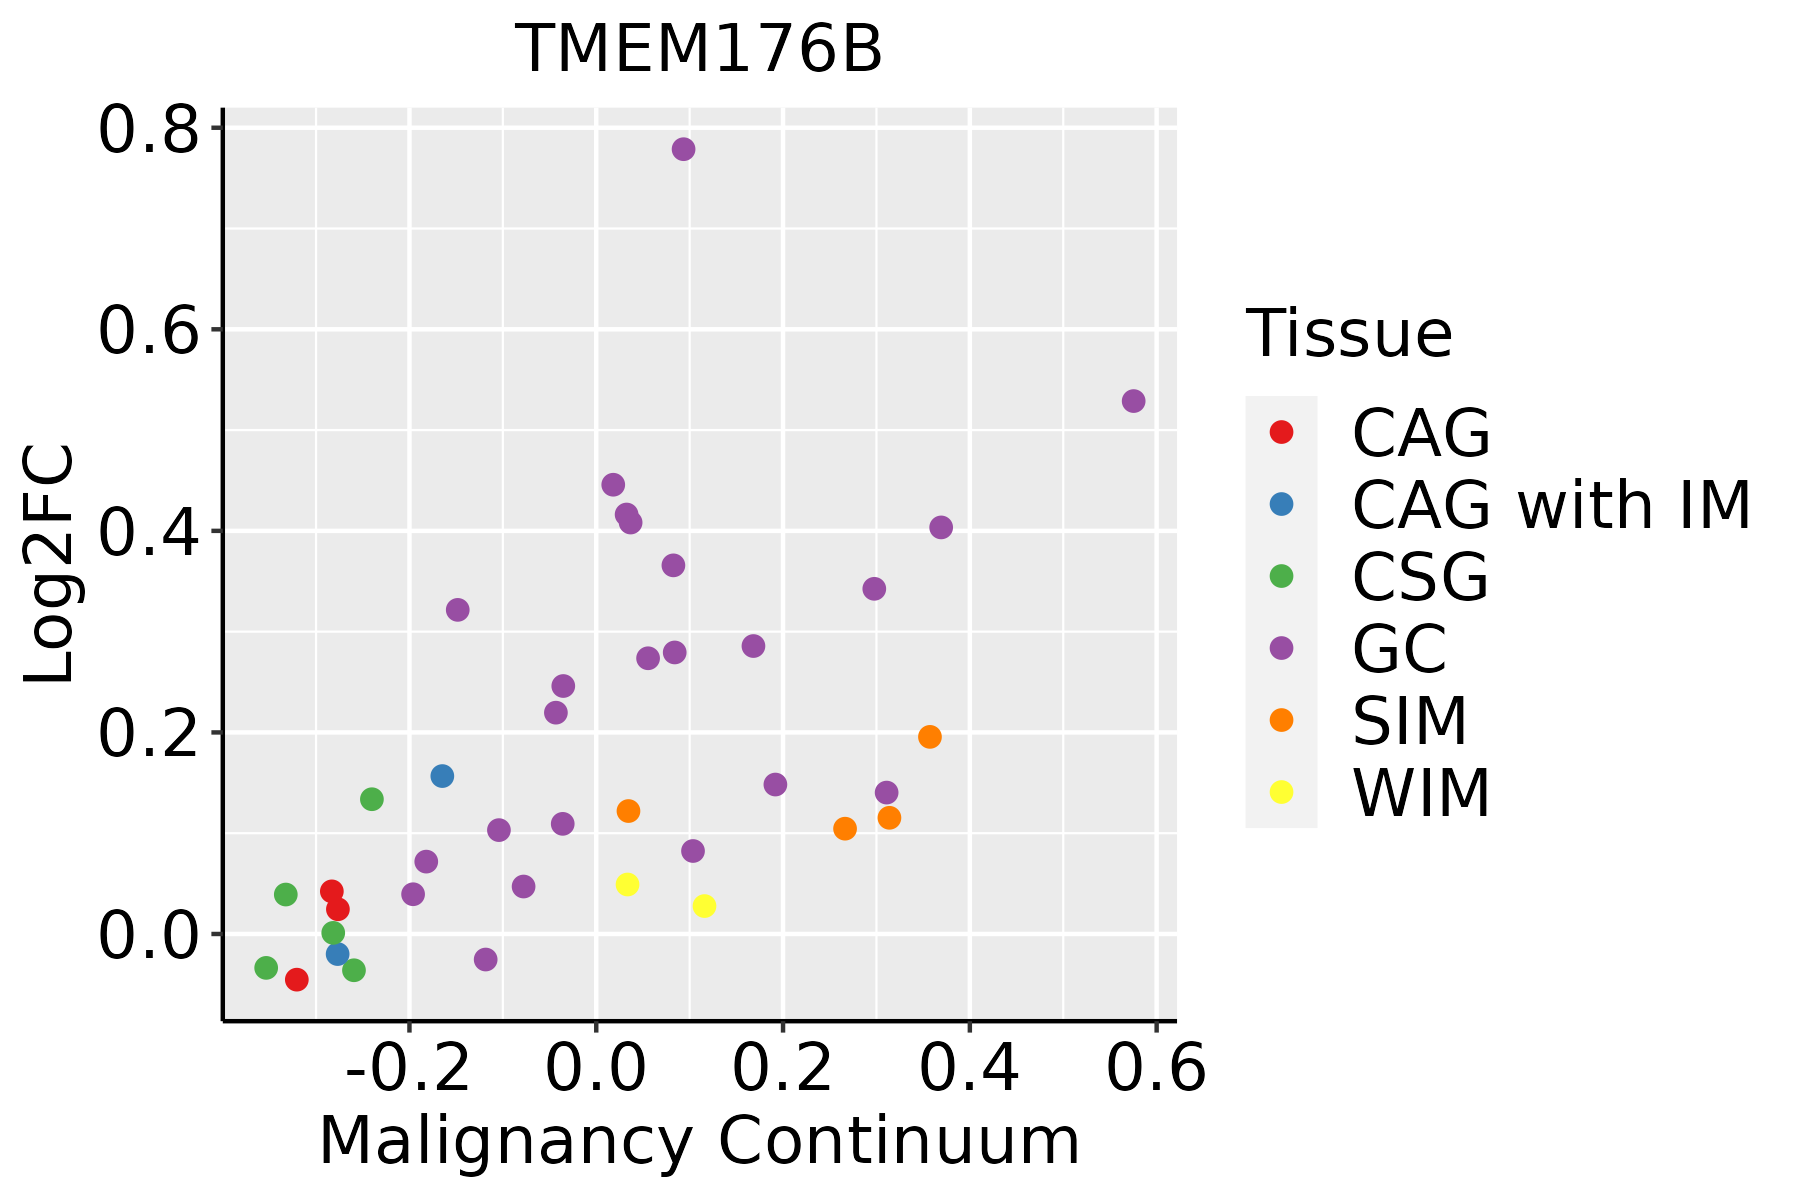 | CAG: Chronic atrophic gastritis |
| CAG with IM: Chronic atrophic gastritis with intestinal metaplasia | ||
| CSG: Chronic superficial gastritis | ||
| GC: Gastric cancer | ||
| SIM: Severe intestinal metaplasia | ||
| WIM: Wild intestinal metaplasia | ||
| Liver | 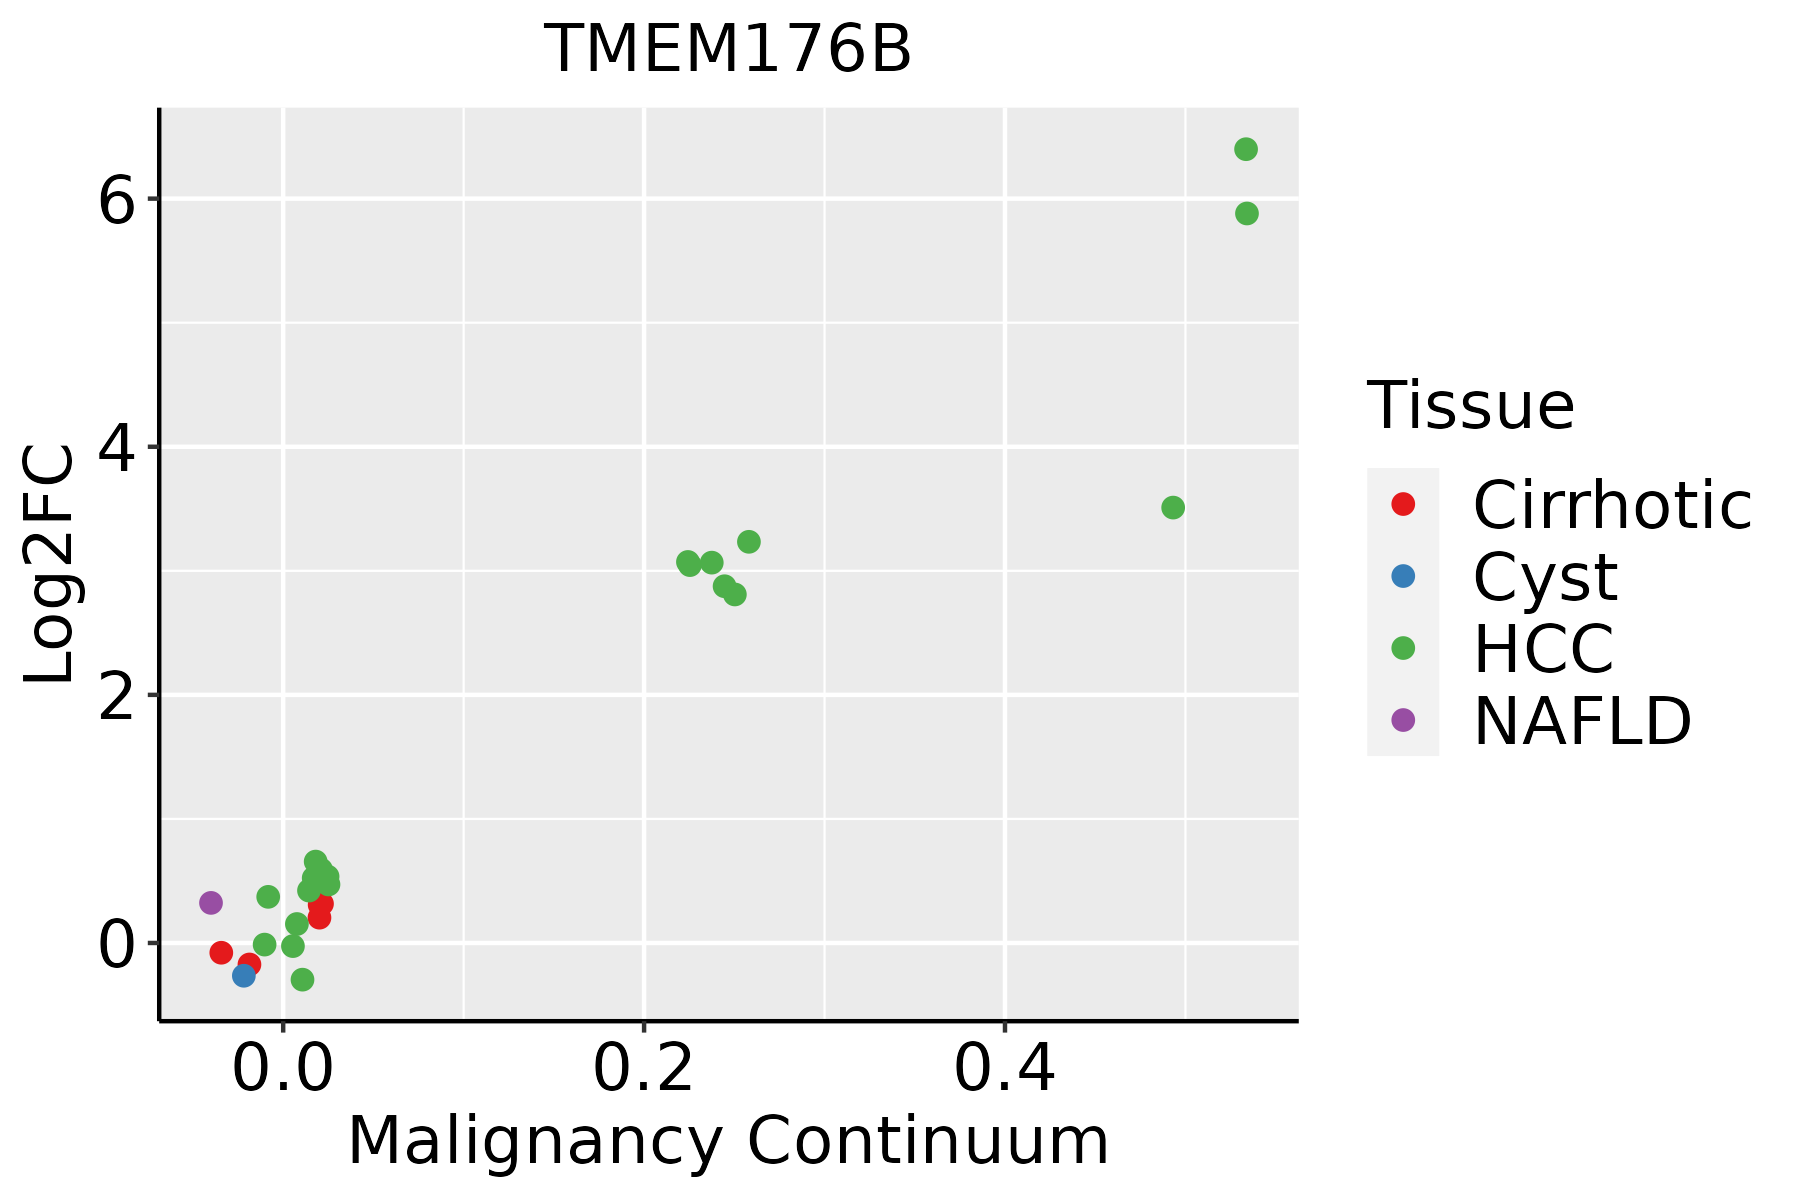 | HCC: Hepatocellular carcinoma |
| NAFLD: Non-alcoholic fatty liver disease | ||
| Lung | 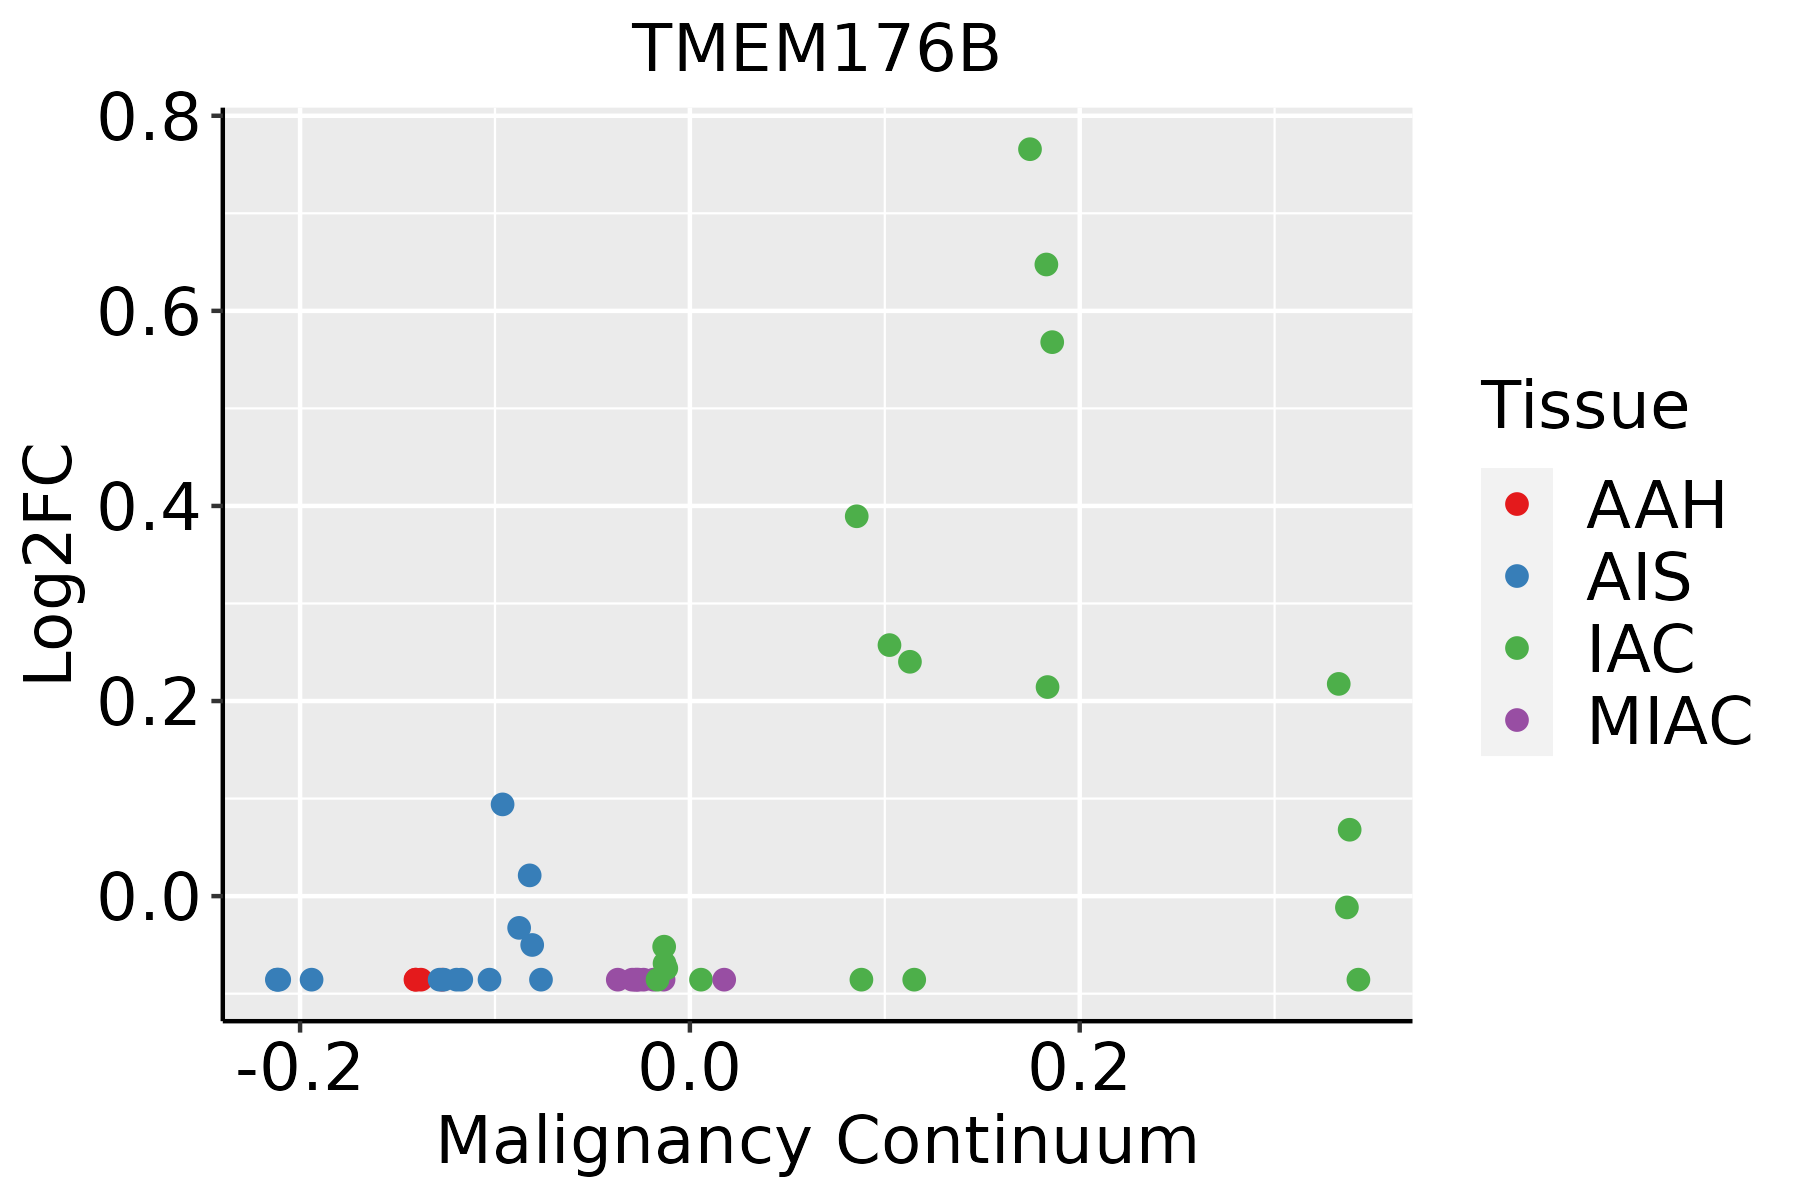 | AAH: Atypical adenomatous hyperplasia |
| AIS: Adenocarcinoma in situ | ||
| IAC: Invasive lung adenocarcinoma | ||
| MIA: Minimally invasive adenocarcinoma | ||
| Oral Cavity | 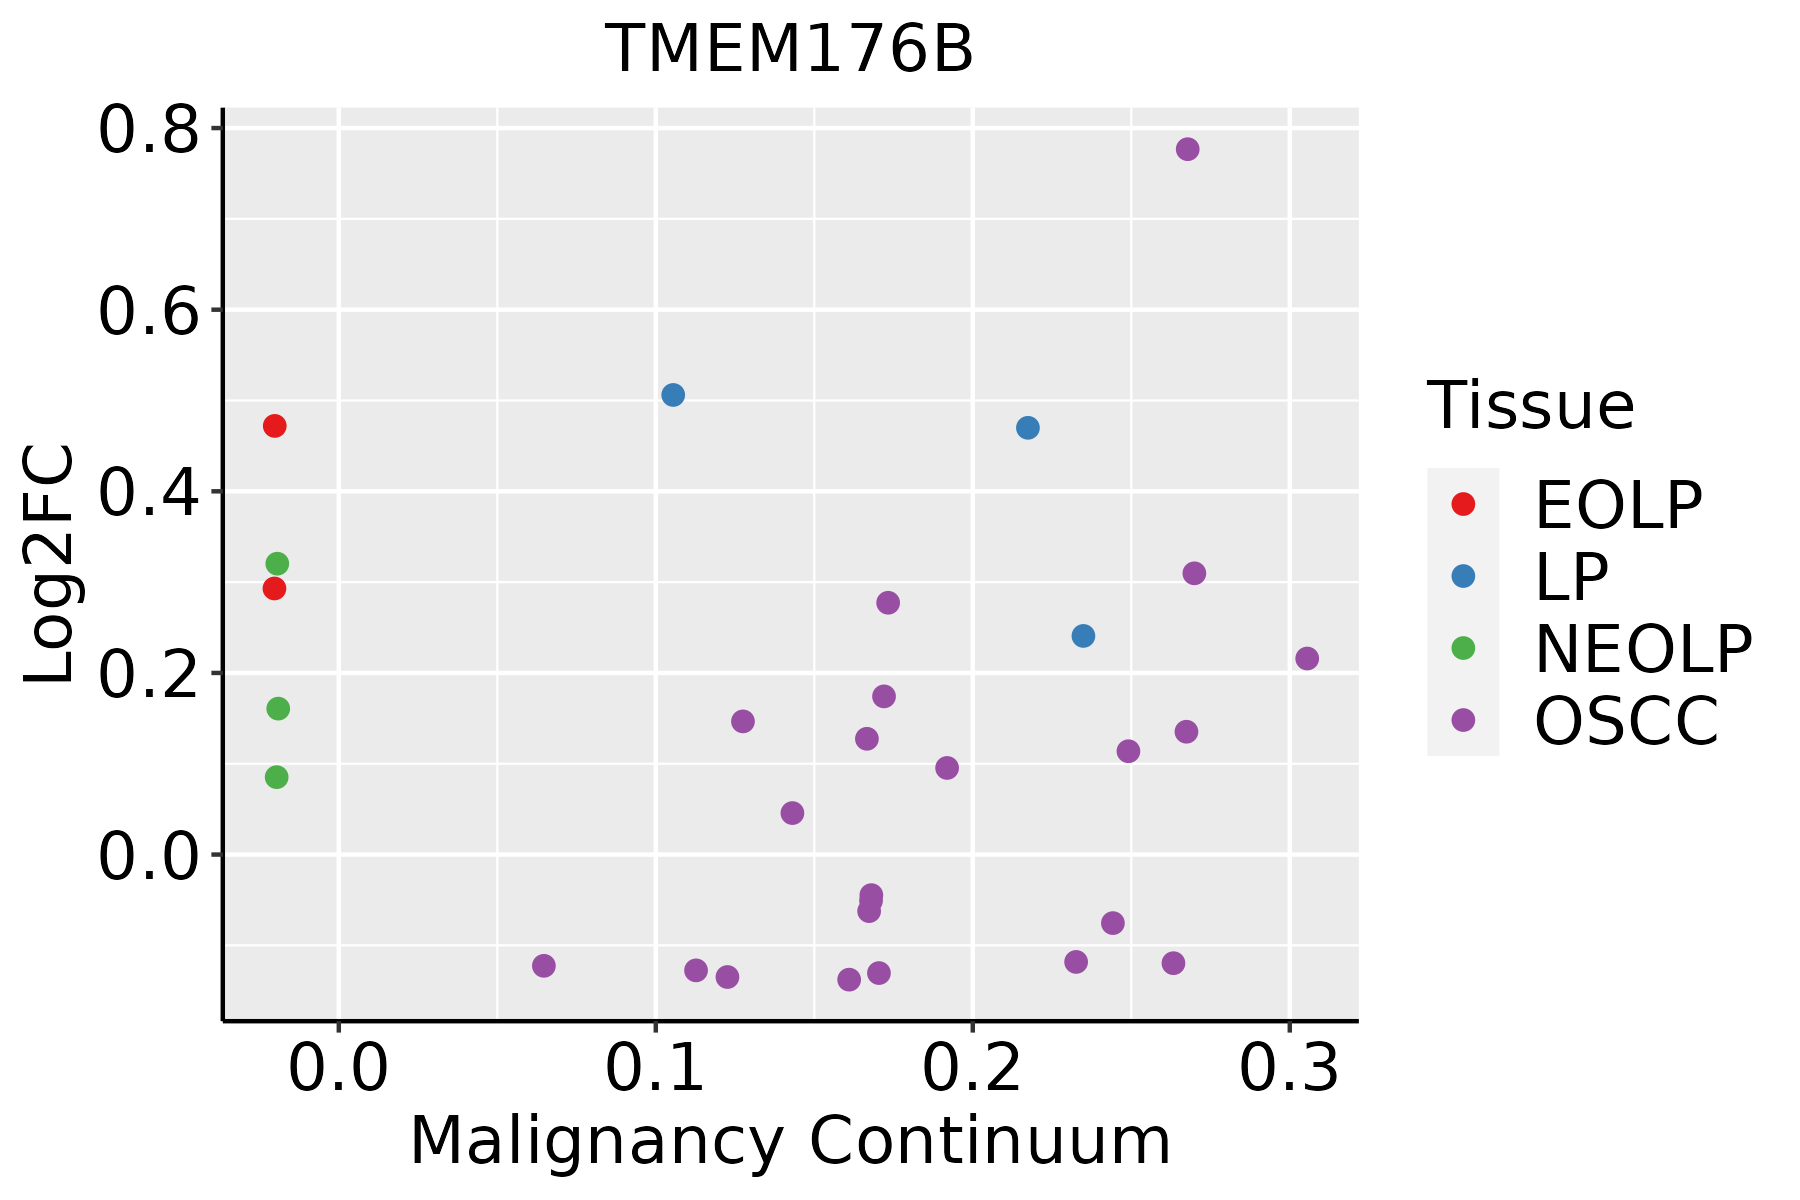 | EOLP: Erosive Oral lichen planus |
| LP: leukoplakia | ||
| NEOLP: Non-erosive oral lichen planus | ||
| OSCC: Oral squamous cell carcinoma | ||
| Thyroid | 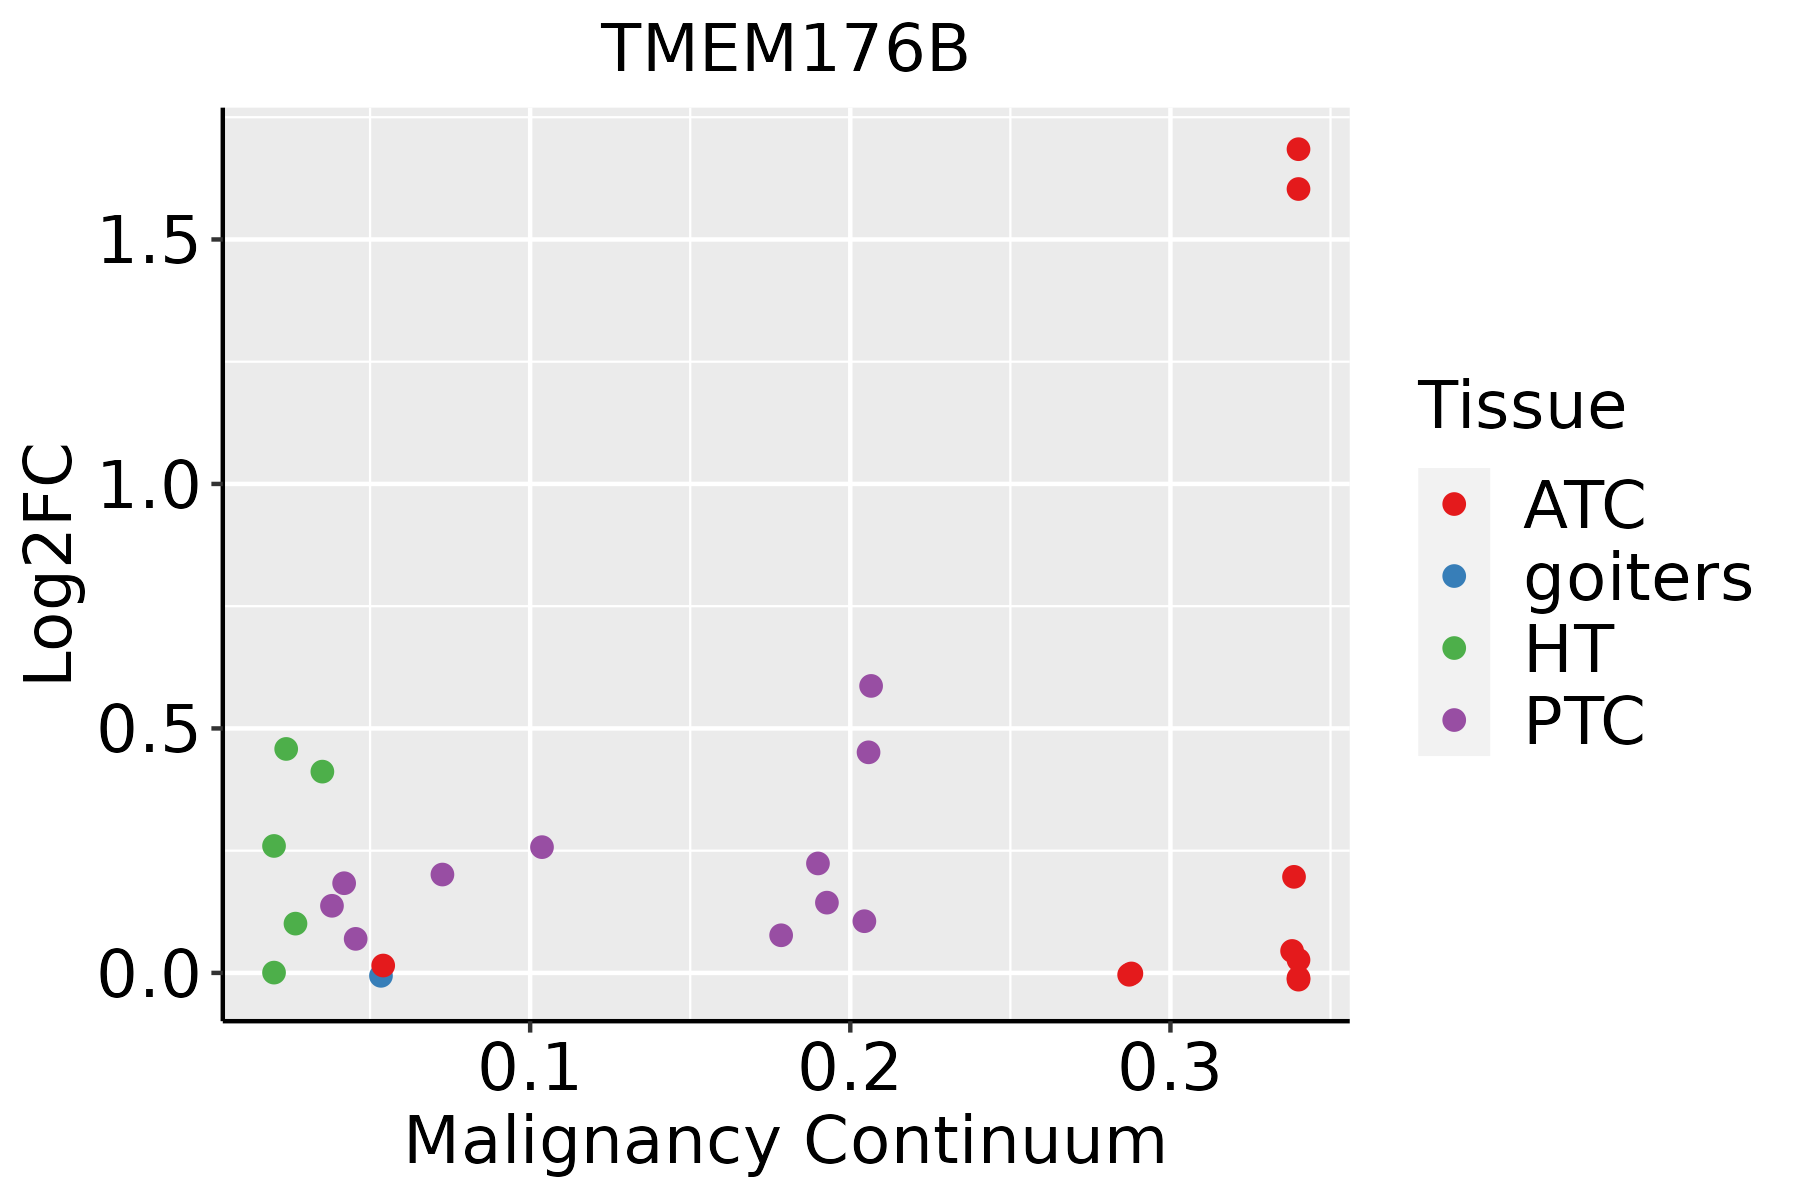 | ATC: Anaplastic thyroid cancer |
| HT: Hashimoto's thyroiditis | ||
| PTC: Papillary thyroid cancer |
| ∗log2FC in expression of this searched gene in stem-like cells from each diseased tissue sample relative to stem-like cells in normal samples in each tissue plotted against the malignancy continuum. Samples are colored based on if they are from different disease stage. |
Top |
Malignant transformation related pathway analysis |
| Find out the enriched GO biological processes and KEGG pathways involved in transition from healthy to precancer to cancer |
| Tissue | Disease Stage | Enriched GO biological Processes |
| Colorectum | AD |  |
| Colorectum | SER |  |
| Colorectum | MSS |  |
| Colorectum | MSI-H |  |
| Colorectum | FAP |  |
| ∗Top 15 enriched GO BP terms are showed in the bar plot of each disease state in each tissue. Each row represents a significant GO biological process which is colored according to the -log10(p.adjust). |
| Page: 1 2 3 4 5 6 7 8 9 |
| GO ID | Tissue | Disease Stage | Description | Gene Ratio | Bg Ratio | pvalue | p.adjust | Count |
| GO:00026837 | Cervix | CC | negative regulation of immune system process | 94/2311 | 434/18723 | 2.63e-08 | 1.87e-06 | 94 |
| GO:190370610 | Cervix | CC | regulation of hemopoiesis | 80/2311 | 367/18723 | 2.14e-07 | 9.55e-06 | 80 |
| GO:19021056 | Cervix | CC | regulation of leukocyte differentiation | 61/2311 | 279/18723 | 5.16e-06 | 1.29e-04 | 61 |
| GO:19021064 | Cervix | CC | negative regulation of leukocyte differentiation | 29/2311 | 102/18723 | 1.02e-05 | 2.29e-04 | 29 |
| GO:19037074 | Cervix | CC | negative regulation of hemopoiesis | 29/2311 | 106/18723 | 2.29e-05 | 4.01e-04 | 29 |
| GO:19031314 | Cervix | CC | mononuclear cell differentiation | 76/2311 | 426/18723 | 5.66e-04 | 5.42e-03 | 76 |
| GO:20011983 | Cervix | CC | regulation of dendritic cell differentiation | 6/2311 | 13/18723 | 2.78e-03 | 1.87e-02 | 6 |
| GO:190370613 | Cervix | HSIL_HPV | regulation of hemopoiesis | 35/737 | 367/18723 | 1.35e-06 | 6.21e-05 | 35 |
| GO:000268312 | Cervix | HSIL_HPV | negative regulation of immune system process | 39/737 | 434/18723 | 1.51e-06 | 6.60e-05 | 39 |
| GO:190210512 | Cervix | HSIL_HPV | regulation of leukocyte differentiation | 28/737 | 279/18723 | 5.84e-06 | 2.13e-04 | 28 |
| GO:190210612 | Cervix | HSIL_HPV | negative regulation of leukocyte differentiation | 11/737 | 102/18723 | 2.24e-03 | 2.26e-02 | 11 |
| GO:190370712 | Cervix | HSIL_HPV | negative regulation of hemopoiesis | 11/737 | 106/18723 | 3.04e-03 | 2.80e-02 | 11 |
| GO:190313112 | Cervix | HSIL_HPV | mononuclear cell differentiation | 29/737 | 426/18723 | 3.10e-03 | 2.84e-02 | 29 |
| GO:1903706 | Colorectum | AD | regulation of hemopoiesis | 99/3918 | 367/18723 | 3.08e-03 | 2.28e-02 | 99 |
| GO:19037061 | Colorectum | MSS | regulation of hemopoiesis | 89/3467 | 367/18723 | 3.39e-03 | 2.56e-02 | 89 |
| GO:1903131 | Colorectum | FAP | mononuclear cell differentiation | 79/2622 | 426/18723 | 5.00e-03 | 3.33e-02 | 79 |
| GO:19037063 | Colorectum | FAP | regulation of hemopoiesis | 69/2622 | 367/18723 | 6.01e-03 | 3.78e-02 | 69 |
| GO:1903706110 | Esophagus | ESCC | regulation of hemopoiesis | 201/8552 | 367/18723 | 2.60e-04 | 1.58e-03 | 201 |
| GO:000268316 | Esophagus | ESCC | negative regulation of immune system process | 231/8552 | 434/18723 | 8.48e-04 | 4.36e-03 | 231 |
| GO:19031317 | Esophagus | ESCC | mononuclear cell differentiation | 226/8552 | 426/18723 | 1.20e-03 | 5.88e-03 | 226 |
| Page: 1 2 3 4 |
| Pathway ID | Tissue | Disease Stage | Description | Gene Ratio | Bg Ratio | pvalue | p.adjust | qvalue | Count |
| Page: 1 |
Top |
Cell-cell communication analysis |
| Identification of potential cell-cell interactions between two cell types and their ligand-receptor pairs for different disease states |
| Ligand | Receptor | LRpair | Pathway | Tissue | Disease Stage |
| Page: 1 |
Top |
Single-cell gene regulatory network inference analysis |
| Find out the significant the regulons (TFs) and the target genes of each regulon across cell types for different disease states |
| TF | Cell Type | Tissue | Disease Stage | Target Gene | RSS | Regulon Activity |
| ∗The dot plots of a searched regulon are shown for all cell subpopulations in each disease state of each tissue based on the regulon specific score inferred using pySCENIC and by calculating the average expression. |
| Page: 1 |
Top |
Somatic mutation of malignant transformation related genes |
| Annotation of somatic variants for genes involved in malignant transformation |
| Hugo Symbol | Variant Class | Variant Classification | dbSNP RS | HGVSc | HGVSp | HGVSp Short | SWISSPROT | BIOTYPE | SIFT | PolyPhen | Tumor Sample Barcode | Tissue | Histology | Sex | Age | Stage | Therapy Types | Drugs | Outcome |
| TMEM176B | SNV | Missense_Mutation | novel | c.177G>T | p.Arg59Ser | p.R59S | Q3YBM2 | protein_coding | tolerated(0.2) | benign(0.03) | TCGA-AN-A046-01 | Breast | breast invasive carcinoma | Female | >=65 | I/II | Unknown | Unknown | SD |
| TMEM176B | SNV | Missense_Mutation | rs141592438 | c.187G>C | p.Glu63Gln | p.E63Q | Q3YBM2 | protein_coding | tolerated(0.27) | benign(0.057) | TCGA-DR-A0ZM-01 | Cervix | cervical & endocervical cancer | Female | <65 | III/IV | Unspecific | Cisplatin | SD |
| TMEM176B | SNV | Missense_Mutation | novel | c.723T>G | p.Asn241Lys | p.N241K | Q3YBM2 | protein_coding | tolerated(0.2) | benign(0.115) | TCGA-DS-A1OB-01 | Cervix | cervical & endocervical cancer | Female | <65 | I/II | Chemotherapy | carboplatin | PD |
| TMEM176B | SNV | Missense_Mutation | novel | c.723N>G | p.Asn241Lys | p.N241K | Q3YBM2 | protein_coding | tolerated(0.2) | benign(0.115) | TCGA-DS-A1OC-01 | Cervix | cervical & endocervical cancer | Female | <65 | I/II | Chemotherapy | gemcitabine | SD |
| TMEM176B | insertion | Frame_Shift_Ins | novel | c.723_724insAAAG | p.Glu242LysfsTer21 | p.E242Kfs*21 | Q3YBM2 | protein_coding | TCGA-DS-A1OB-01 | Cervix | cervical & endocervical cancer | Female | <65 | I/II | Chemotherapy | carboplatin | PD | ||
| TMEM176B | insertion | Frame_Shift_Ins | novel | c.723_724insAAAG | p.Glu242LysfsTer21 | p.E242Kfs*21 | Q3YBM2 | protein_coding | TCGA-DS-A1OC-01 | Cervix | cervical & endocervical cancer | Female | <65 | I/II | Chemotherapy | gemcitabine | SD | ||
| TMEM176B | SNV | Missense_Mutation | c.47G>A | p.Arg16Lys | p.R16K | Q3YBM2 | protein_coding | tolerated(0.25) | benign(0.003) | TCGA-AA-3821-01 | Colorectum | colon adenocarcinoma | Female | >=65 | I/II | Unknown | Unknown | SD | |
| TMEM176B | SNV | Missense_Mutation | novel | c.61N>G | p.Thr21Ala | p.T21A | Q3YBM2 | protein_coding | tolerated(0.17) | benign(0.007) | TCGA-AA-3845-01 | Colorectum | colon adenocarcinoma | Female | >=65 | I/II | Unknown | Unknown | PD |
| TMEM176B | SNV | Missense_Mutation | rs376451849 | c.689N>A | p.Arg230Gln | p.R230Q | Q3YBM2 | protein_coding | tolerated(0.17) | benign(0.06) | TCGA-AA-A010-01 | Colorectum | colon adenocarcinoma | Female | <65 | I/II | Chemotherapy | folinic | CR |
| TMEM176B | SNV | Missense_Mutation | novel | c.317T>C | p.Val106Ala | p.V106A | Q3YBM2 | protein_coding | tolerated(1) | benign(0) | TCGA-AD-6964-01 | Colorectum | colon adenocarcinoma | Male | <65 | III/IV | Chemotherapy | folfox | PD |
| Page: 1 2 3 4 5 |
Top |
Related drugs of malignant transformation related genes |
| Identification of chemicals and drugs interact with genes involved in malignant transfromation |
| (DGIdb 4.0) |
| Entrez ID | Symbol | Category | Interaction Types | Drug Claim Name | Drug Name | PMIDs |
| Page: 1 |

Copyright 2023-Present -The University of Texas Health Science Center at Houston |