Schematic overview of the cellular and molecular mechanisms involved in the cancer progression, including the proposed cellular and molecular mechanisms in cancer cells trajectory. AT1: alveolar type 1 cells; AT2: alveolar type 2 cells; AAH: atypical adenomatous hyperplasia; AIS: adenocarcinoma in situ; MIA: minimally invasive adenocarcinoma; IA: invasive adenocarcinoma; EMT: epithelial-mesenchymal transition

Home

Download

Statistics

Help

Contact

Center for Computational Systems Medicine
leaf

Gene summary

leaf

Malignant transformation analysis

leaf

Malignant transformation related pathway analysis

leaf

Cell-cell communication analysis

leaf

Single-cell gene regulatory network inference analysis

leaf

Somatic mutation of malignant transformation related genes

leaf

Related drugs of malignant transformation related genes

Gene: TMEM176A

Gene summary for TMEM176A

check button Gene summary.

Gene informationSpeciesHuman
Gene symbol

TMEM176A

Gene ID

55365

Gene nametransmembrane protein 176A
Gene AliasGS188
Cytomap7q36.1
Gene Typeprotein-coding
GO ID

GO:0002376

UniProtAcc

A0A090N8H6


Top

Malignant transformation analysis

check button Identification of the aberrant gene expression in precancerous and cancerous lesions by comparing the gene expression of stem-like cells in diseased tissues with normal stem cells
check button Malignant transformation involving gene list.
Entrez IDSymbolReplicatesSpeciesOrganTissueAdj P-valueLog2FCMalignancy
55365TMEM176ACA_HPV_1HumanCervixCC6.14e-09-4.13e-010.0264
55365TMEM176ACA_HPV_2HumanCervixCC3.94e-02-3.24e-010.0391
55365TMEM176ACA_HPV_3HumanCervixCC9.83e-12-4.74e-010.0414
55365TMEM176ACCI_1HumanCervixCC2.41e-07-6.57e-010.528
55365TMEM176ACCI_2HumanCervixCC1.16e-06-6.57e-010.5249
55365TMEM176ACCI_3HumanCervixCC4.27e-10-6.57e-010.516
55365TMEM176ACCII_1HumanCervixCC2.62e-14-6.57e-010.3249
55365TMEM176ATumorHumanCervixCC6.97e-36-6.57e-010.1241
55365TMEM176Asample1HumanCervixCC7.83e-12-6.57e-010.0959
55365TMEM176Asample3HumanCervixCC5.21e-31-6.54e-010.1387
55365TMEM176AH2HumanCervixHSIL_HPV1.68e-06-3.99e-010.0632
55365TMEM176AL1HumanCervixCC1.61e-11-6.26e-010.0802
55365TMEM176AT1HumanCervixCC1.89e-26-6.57e-010.0918
55365TMEM176AT3HumanCervixCC1.21e-28-6.55e-010.1389
55365TMEM176AHTA11_3410_2000001011HumanColorectumAD2.15e-397.44e-010.0155
55365TMEM176AHTA11_2487_2000001011HumanColorectumSER2.75e-318.68e-01-0.1808
55365TMEM176AHTA11_2951_2000001011HumanColorectumAD5.13e-053.66e-010.0216
55365TMEM176AHTA11_1938_2000001011HumanColorectumAD8.56e-431.35e+00-0.0811
55365TMEM176AHTA11_78_2000001011HumanColorectumAD1.15e-207.07e-01-0.1088
55365TMEM176AHTA11_347_2000001011HumanColorectumAD3.08e-631.18e+00-0.1954
Page: 1 2 3 4 5 6 

check button Transcriptomic changes along malignancy continuum.
TissueExpression DynamicsAbbreviation
CervixThe image shows the transcriptomic changes along malignancy continuum.log2FC in expression of this searched gene in stem-like cells from each diseased tissue sample relative to stem-like cells in normal samples in each tissue plotted against the malignancy continuum. Samples are colored based on if they are from different disease stage.CC: Cervix cancer
HSIL_HPV: HPV-infected high-grade squamous intraepithelial lesions
N_HPV: HPV-infected normal cervix
Colorectum (GSE201348)The image shows the transcriptomic changes along malignancy continuum.log2FC in expression of this searched gene in stem-like cells from each diseased tissue sample relative to stem-like cells in normal samples in each tissue plotted against the malignancy continuum. Samples are colored based on if they are from different disease stage.FAP: Familial adenomatous polyposis
CRC: Colorectal cancer
Colorectum (HTA11)The image shows the transcriptomic changes along malignancy continuum.log2FC in expression of this searched gene in stem-like cells from each diseased tissue sample relative to stem-like cells in normal samples in each tissue plotted against the malignancy continuum. Samples are colored based on if they are from different disease stage.AD: Adenomas
SER: Sessile serrated lesions
MSI-H: Microsatellite-high colorectal cancer
MSS: Microsatellite stable colorectal cancer
EsophagusThe image shows the transcriptomic changes along malignancy continuum.log2FC in expression of this searched gene in stem-like cells from each diseased tissue sample relative to stem-like cells in normal samples in each tissue plotted against the malignancy continuum. Samples are colored based on if they are from different disease stage.
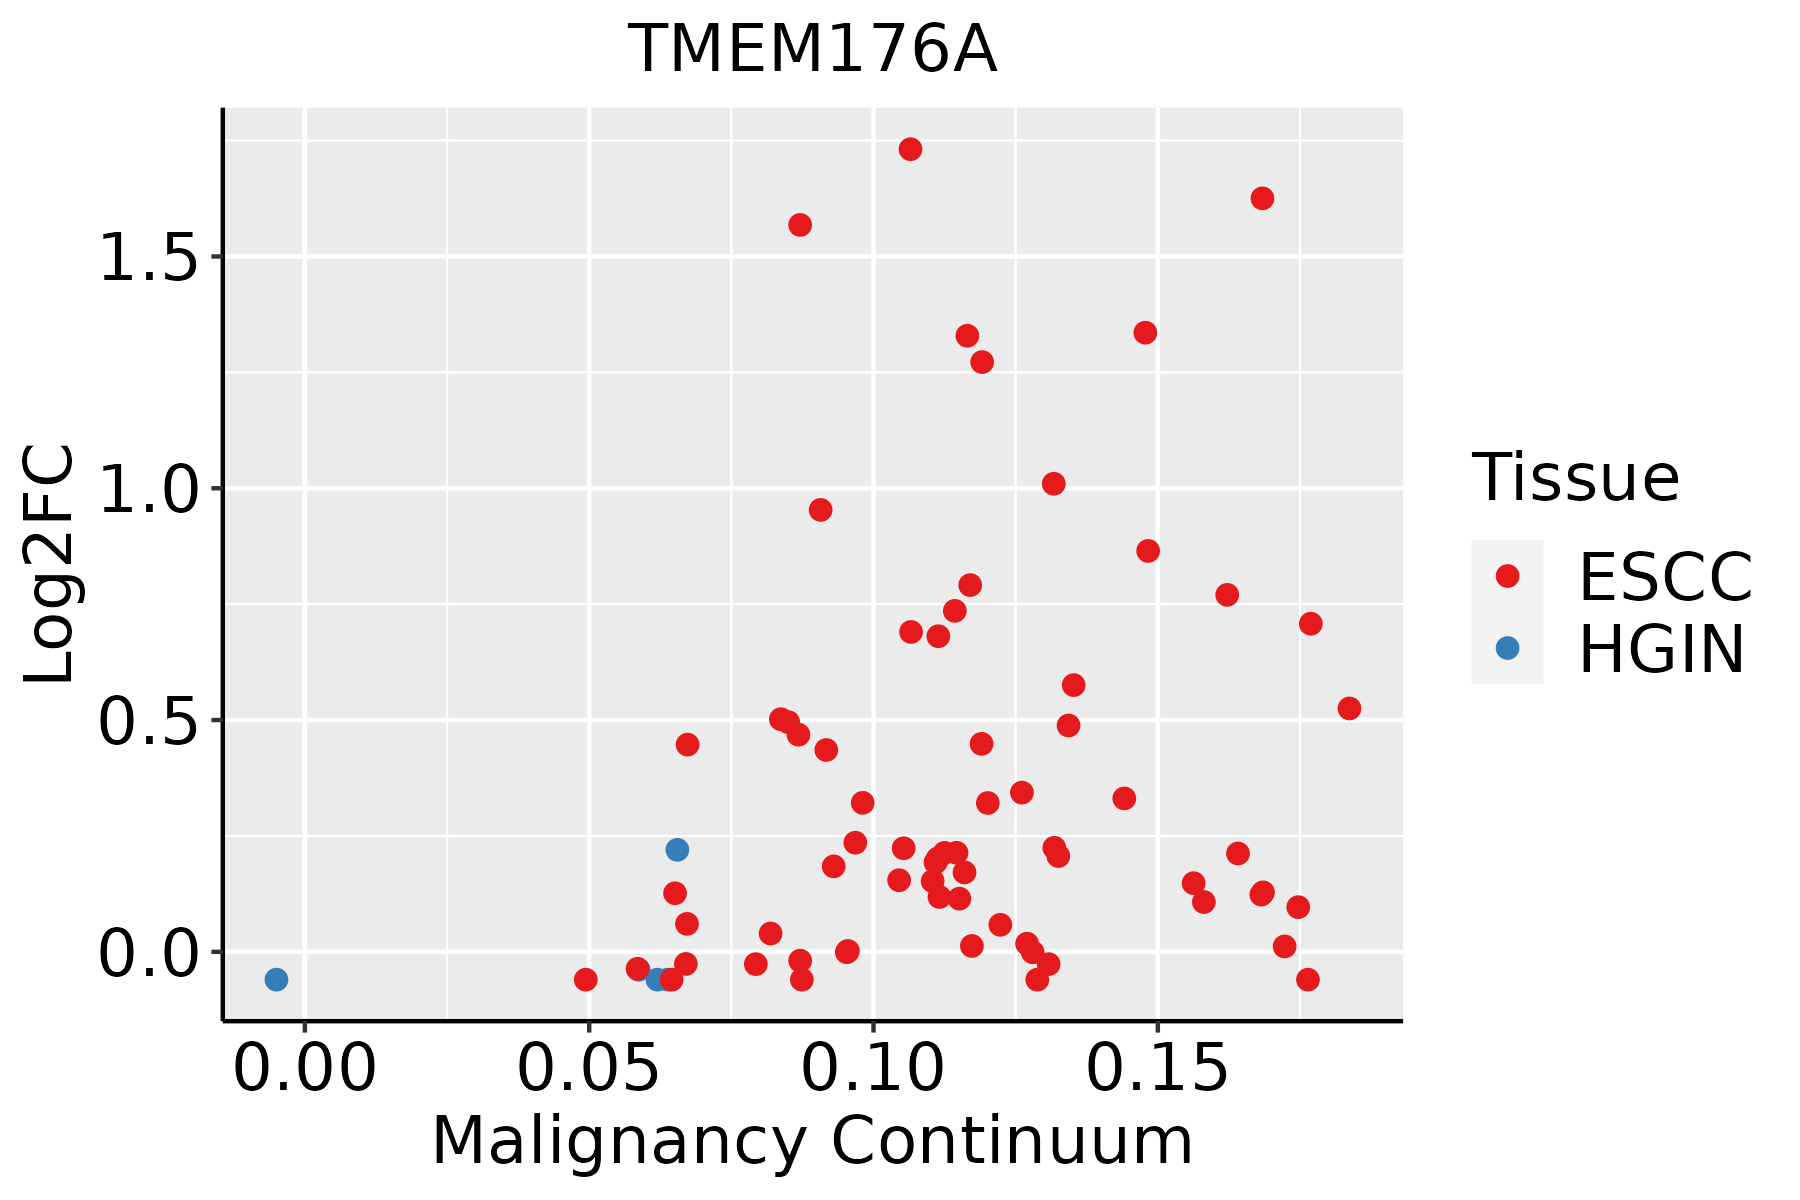
ESCC: Esophageal squamous cell carcinoma
HGIN: High-grade intraepithelial neoplasias
LGIN: Low-grade intraepithelial neoplasias
GCThe image shows the transcriptomic changes along malignancy continuum.log2FC in expression of this searched gene in stem-like cells from each diseased tissue sample relative to stem-like cells in normal samples in each tissue plotted against the malignancy continuum. Samples are colored based on if they are from different disease stage.CAG: Chronic atrophic gastritis
CAG with IM: Chronic atrophic gastritis with intestinal metaplasia
CSG: Chronic superficial gastritis
GC: Gastric cancer
SIM: Severe intestinal metaplasia
WIM: Wild intestinal metaplasia
LiverThe image shows the transcriptomic changes along malignancy continuum.log2FC in expression of this searched gene in stem-like cells from each diseased tissue sample relative to stem-like cells in normal samples in each tissue plotted against the malignancy continuum. Samples are colored based on if they are from different disease stage.
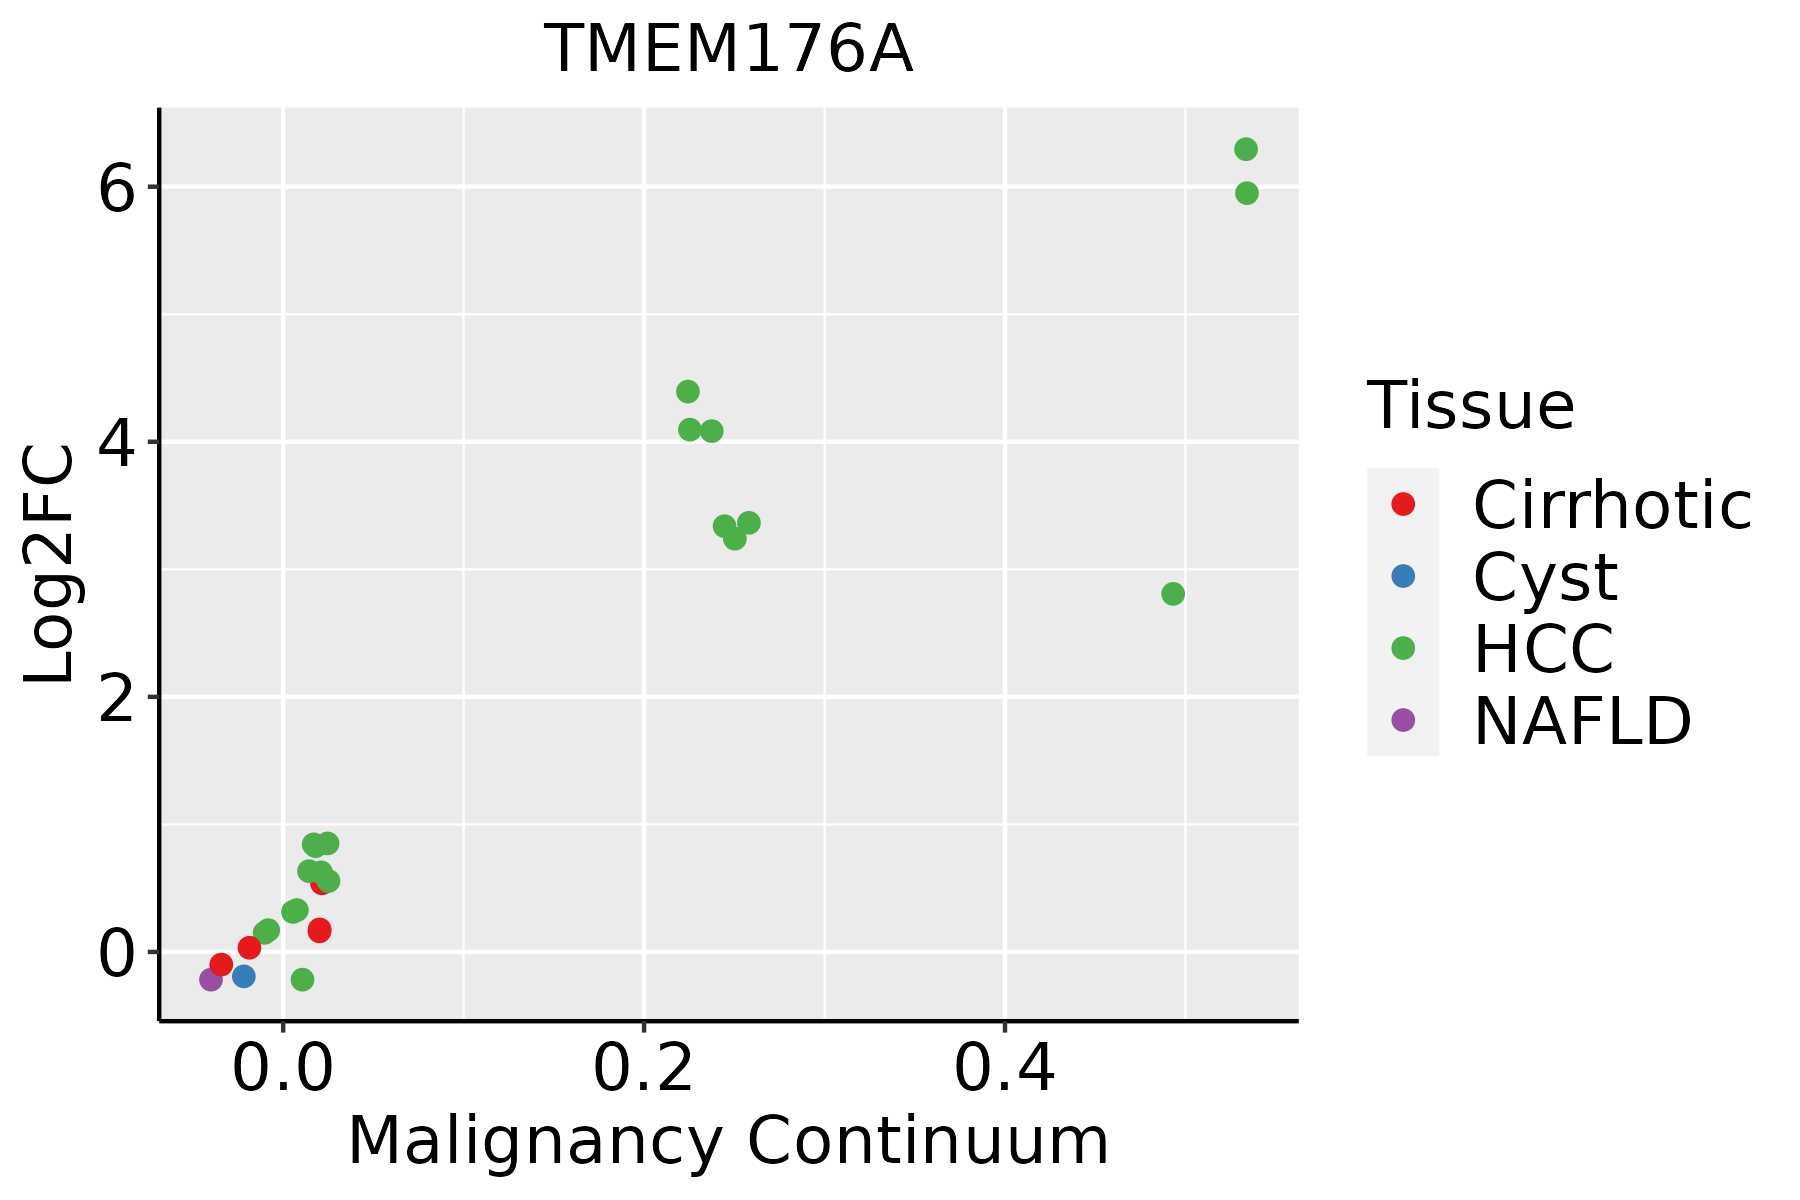
HCC: Hepatocellular carcinoma
NAFLD: Non-alcoholic fatty liver disease
ThyroidThe image shows the transcriptomic changes along malignancy continuum.log2FC in expression of this searched gene in stem-like cells from each diseased tissue sample relative to stem-like cells in normal samples in each tissue plotted against the malignancy continuum. Samples are colored based on if they are from different disease stage.
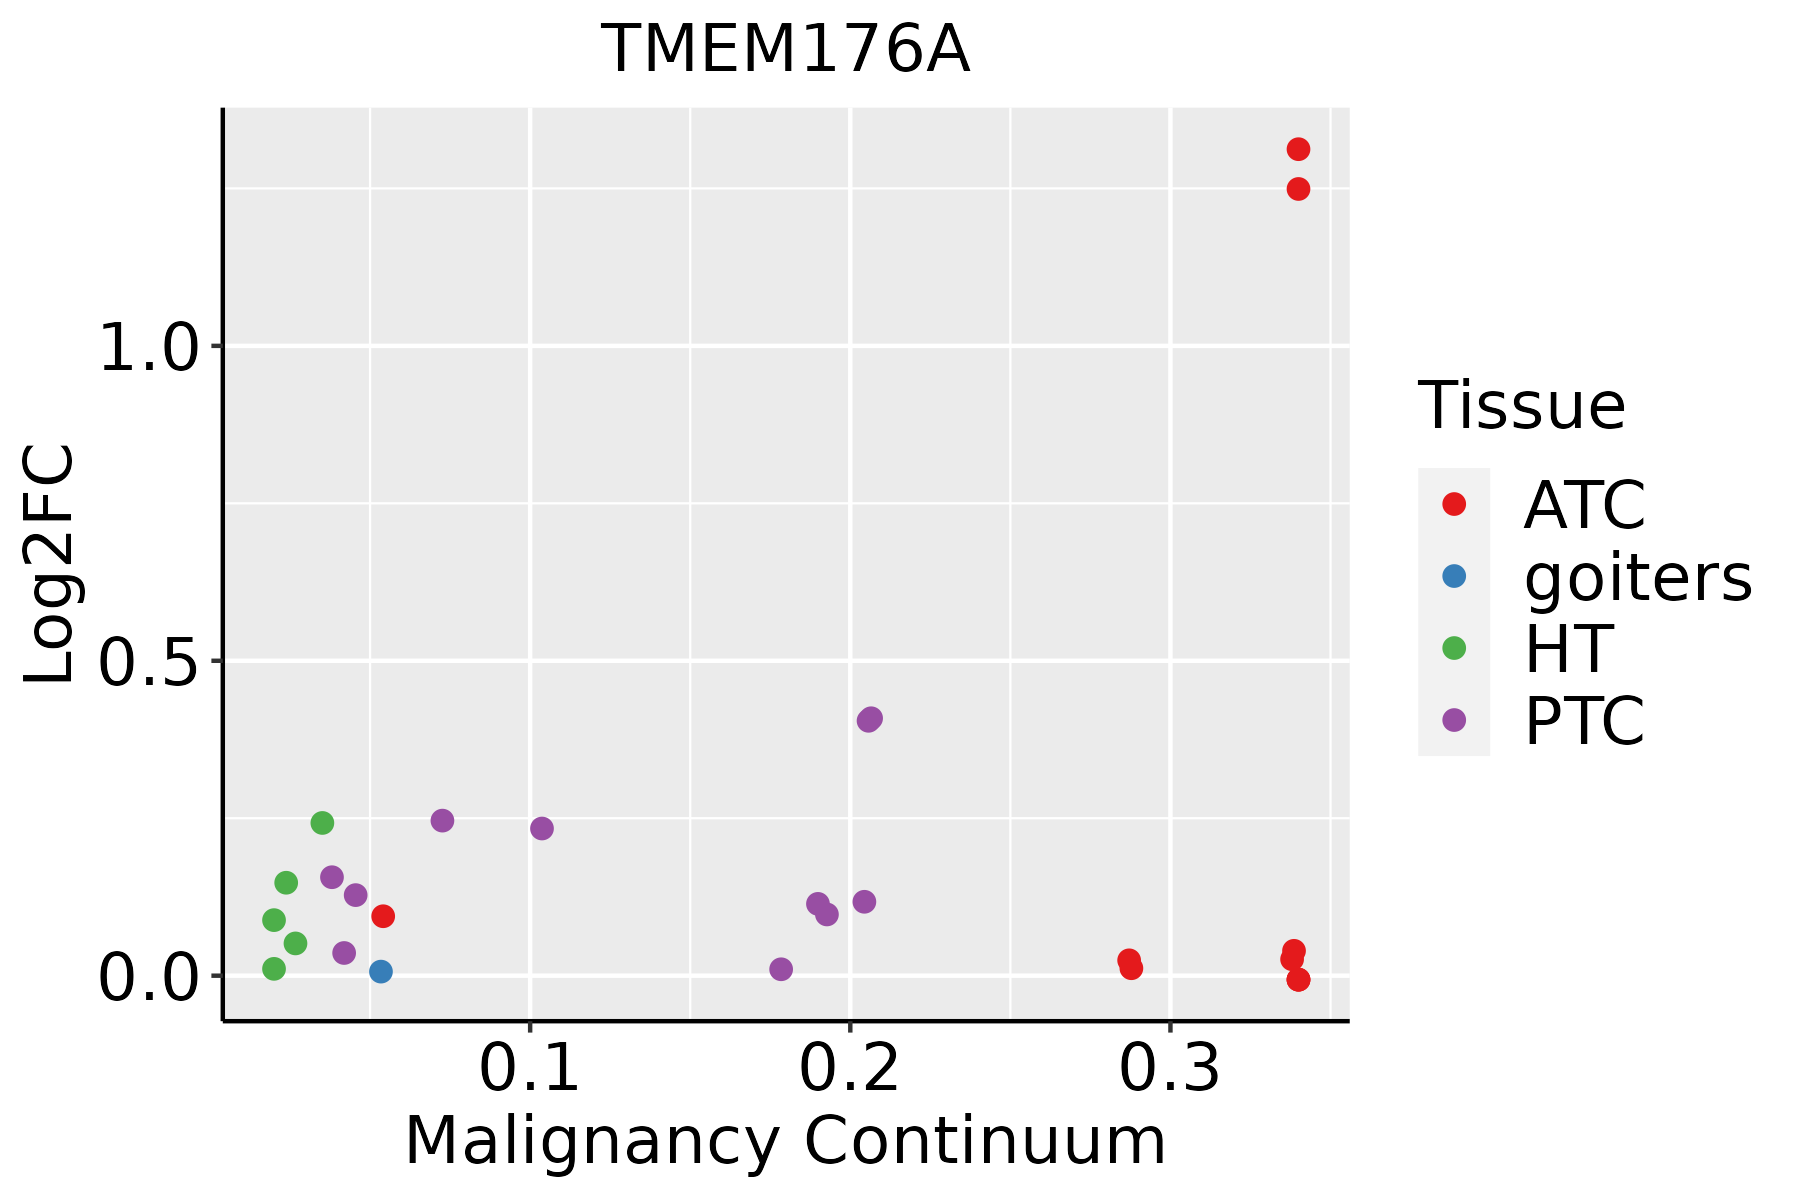
ATC: Anaplastic thyroid cancer
HT: Hashimoto's thyroiditis
PTC: Papillary thyroid cancer
∗log2FC in expression of this searched gene in stem-like cells from each diseased tissue sample relative to stem-like cells in normal samples in each tissue plotted against the malignancy continuum. Samples are colored based on if they are from different disease stage.

Top

Malignant transformation related pathway analysis

check buttonFind out the enriched GO biological processes and KEGG pathways involved in transition from healthy to precancer to cancer
check button Figure of enriched GO biological processes.
TissueDisease StageEnriched GO biological Processes
ColorectumADGO analysis - Figure of enriched GO biological processes: Top 15 enriched GO BP terms are showed in the bar plot of each disease state in each tissue. Each row represents a significant GO biological process which is colored according to the -log10(p.adjust).
ColorectumSERGO analysis - Figure of enriched GO biological processes: Top 15 enriched GO BP terms are showed in the bar plot of each disease state in each tissue. Each row represents a significant GO biological process which is colored according to the -log10(p.adjust).
ColorectumMSSGO analysis - Figure of enriched GO biological processes: Top 15 enriched GO BP terms are showed in the bar plot of each disease state in each tissue. Each row represents a significant GO biological process which is colored according to the -log10(p.adjust).
ColorectumMSI-HGO analysis - Figure of enriched GO biological processes: Top 15 enriched GO BP terms are showed in the bar plot of each disease state in each tissue. Each row represents a significant GO biological process which is colored according to the -log10(p.adjust).
ColorectumFAPGO analysis - Figure of enriched GO biological processes: Top 15 enriched GO BP terms are showed in the bar plot of each disease state in each tissue. Each row represents a significant GO biological process which is colored according to the -log10(p.adjust).
∗Top 15 enriched GO BP terms are showed in the bar plot of each disease state in each tissue. Each row represents a significant GO biological process which is colored according to the -log10(p.adjust).
Page: 1 2 3 4 5 6 7 8 9 

check button Enriched GO biological processes.
GO IDTissueDisease StageDescriptionGene RatioBg Ratiopvaluep.adjustCount
GO:00026837CervixCCnegative regulation of immune system process94/2311434/187232.63e-081.87e-0694
GO:190370610CervixCCregulation of hemopoiesis80/2311367/187232.14e-079.55e-0680
GO:19021056CervixCCregulation of leukocyte differentiation61/2311279/187235.16e-061.29e-0461
GO:19021064CervixCCnegative regulation of leukocyte differentiation29/2311102/187231.02e-052.29e-0429
GO:19037074CervixCCnegative regulation of hemopoiesis29/2311106/187232.29e-054.01e-0429
GO:19031314CervixCCmononuclear cell differentiation76/2311426/187235.66e-045.42e-0376
GO:20011983CervixCCregulation of dendritic cell differentiation6/231113/187232.78e-031.87e-026
GO:190370613CervixHSIL_HPVregulation of hemopoiesis35/737367/187231.35e-066.21e-0535
GO:000268312CervixHSIL_HPVnegative regulation of immune system process39/737434/187231.51e-066.60e-0539
GO:190210512CervixHSIL_HPVregulation of leukocyte differentiation28/737279/187235.84e-062.13e-0428
GO:190210612CervixHSIL_HPVnegative regulation of leukocyte differentiation11/737102/187232.24e-032.26e-0211
GO:190370712CervixHSIL_HPVnegative regulation of hemopoiesis11/737106/187233.04e-032.80e-0211
GO:190313112CervixHSIL_HPVmononuclear cell differentiation29/737426/187233.10e-032.84e-0229
GO:1903706ColorectumADregulation of hemopoiesis99/3918367/187233.08e-032.28e-0299
GO:19037061ColorectumMSSregulation of hemopoiesis89/3467367/187233.39e-032.56e-0289
GO:1903706110EsophagusESCCregulation of hemopoiesis201/8552367/187232.60e-041.58e-03201
GO:000268316EsophagusESCCnegative regulation of immune system process231/8552434/187238.48e-044.36e-03231
GO:19031317EsophagusESCCmononuclear cell differentiation226/8552426/187231.20e-035.88e-03226
GO:190210510EsophagusESCCregulation of leukocyte differentiation152/8552279/187231.82e-038.35e-03152
GO:19037066StomachGCregulation of hemopoiesis42/1159367/187239.03e-051.87e-0342
Page: 1 2 3 

check button Enriched KEGG pathways.
Pathway IDTissueDisease StageDescriptionGene RatioBg Ratiopvaluep.adjustqvalueCount
Page: 1 

Top

Cell-cell communication analysis

check buttonIdentification of potential cell-cell interactions between two cell types and their ligand-receptor pairs for different disease states
LigandReceptorLRpairPathwayTissueDisease Stage
Page: 1 

Top

Single-cell gene regulatory network inference analysis

check buttonFind out the significant the regulons (TFs) and the target genes of each regulon across cell types for different disease states
TFCell TypeTissueDisease StageTarget GeneRSSRegulon Activity
∗The dot plots of a searched regulon are shown for all cell subpopulations in each disease state of each tissue based on the regulon specific score inferred using pySCENIC and by calculating the average expression.
Page: 1 

Top

Somatic mutation of malignant transformation related genes

check buttonAnnotation of somatic variants for genes involved in malignant transformation
Hugo SymbolVariant ClassVariant ClassificationdbSNP RSHGVScHGVSpHGVSp ShortSWISSPROTBIOTYPESIFTPolyPhenTumor Sample BarcodeTissueHistologySexAgeStageTherapy TypesDrugsOutcome
TMEM176ASNVMissense_Mutationc.201N>Cp.Leu67Phep.L67FQ96HP8protein_codingtolerated(0.07)benign(0.171)TCGA-C5-A1BQ-01Cervixcervical & endocervical cancerFemale>=65III/IVChemotherapycisplatinCR
TMEM176ASNVMissense_Mutationnovelc.155N>Ap.Arg52Glnp.R52QQ96HP8protein_codingdeleterious(0.04)probably_damaging(0.995)TCGA-ZJ-A8QO-01Cervixcervical & endocervical cancerFemale>=65I/IIUnknownUnknownSD
TMEM176ASNVMissense_Mutationc.674A>Gp.Asp225Glyp.D225GQ96HP8protein_codingdeleterious(0.01)benign(0.117)TCGA-AA-3977-01Colorectumcolon adenocarcinomaMale>=65I/IIUnknownUnknownSD
TMEM176ASNVMissense_Mutationrs142016485c.121C>Tp.Arg41Trpp.R41WQ96HP8protein_codingtolerated(0.05)possibly_damaging(0.568)TCGA-A5-A2K5-01Endometriumuterine corpus endometrioid carcinomaFemale>=65I/IIUnknownUnknownSD
TMEM176ASNVMissense_Mutationrs150662833c.122N>Ap.Arg41Glnp.R41QQ96HP8protein_codingtolerated(0.58)benign(0.003)TCGA-AP-A0LM-01Endometriumuterine corpus endometrioid carcinomaFemale<65III/IVChemotherapycisplatinSD
TMEM176ASNVMissense_Mutationc.511N>Ap.Val171Ilep.V171IQ96HP8protein_codingtolerated(0.17)benign(0.157)TCGA-AP-A0LM-01Endometriumuterine corpus endometrioid carcinomaFemale<65III/IVChemotherapycisplatinSD
TMEM176ASNVMissense_Mutationnovelc.419N>Cp.Phe140Serp.F140SQ96HP8protein_codingdeleterious(0)possibly_damaging(0.729)TCGA-B5-A3FA-01Endometriumuterine corpus endometrioid carcinomaFemale>=65I/IIUnknownUnknownSD
TMEM176ASNVMissense_Mutationc.487N>Ap.Ala163Thrp.A163TQ96HP8protein_codingtolerated(0.31)benign(0.14)TCGA-BG-A0M0-01Endometriumuterine corpus endometrioid carcinomaFemale>=65I/IIUnknownUnknownSD
TMEM176ASNVMissense_Mutationnovelc.100N>Tp.Leu34Phep.L34FQ96HP8protein_codingdeleterious(0.02)possibly_damaging(0.656)TCGA-BG-A221-01Endometriumuterine corpus endometrioid carcinomaFemale>=65I/IIUnknownUnknownSD
TMEM176ASNVMissense_Mutationrs144787897c.422N>Ap.Arg141Glnp.R141QQ96HP8protein_codingtolerated(0.66)benign(0.001)TCGA-BS-A0TC-01Endometriumuterine corpus endometrioid carcinomaFemale>=65I/IIUnknownUnknownSD
Page: 1 2 3 

Top

Related drugs of malignant transformation related genes

check buttonIdentification of chemicals and drugs interact with genes involved in malignant transfromation
(DGIdb 4.0)
Entrez IDSymbolCategoryInteraction TypesDrug Claim NameDrug NamePMIDs
Page: 1