
|
|||||
|
 | |
| |
| |
| |
| |
| |
|
Gene: TMEM175 |
Gene summary for TMEM175 |
| Gene information | Species | Human | Gene symbol | TMEM175 | Gene ID | 84286 |
| Gene name | transmembrane protein 175 | |
| Gene Alias | hTMEM175 | |
| Cytomap | 4p16.3 | |
| Gene Type | protein-coding | GO ID | GO:0001845 | UniProtAcc | D3DVN5 |
Top |
Malignant transformation analysis |
| Identification of the aberrant gene expression in precancerous and cancerous lesions by comparing the gene expression of stem-like cells in diseased tissues with normal stem cells |
| Entrez ID | Symbol | Replicates | Species | Organ | Tissue | Adj P-value | Log2FC | Malignancy |
| 84286 | TMEM175 | C21 | Human | Oral cavity | OSCC | 5.64e-23 | 6.38e-01 | 0.2678 |
| 84286 | TMEM175 | C30 | Human | Oral cavity | OSCC | 4.69e-09 | 5.74e-01 | 0.3055 |
| 84286 | TMEM175 | C46 | Human | Oral cavity | OSCC | 4.32e-09 | 2.09e-01 | 0.1673 |
| 84286 | TMEM175 | C51 | Human | Oral cavity | OSCC | 6.24e-03 | 3.32e-01 | 0.2674 |
| 84286 | TMEM175 | C57 | Human | Oral cavity | OSCC | 9.45e-07 | 2.46e-01 | 0.1679 |
| 84286 | TMEM175 | C06 | Human | Oral cavity | OSCC | 2.58e-05 | 8.95e-01 | 0.2699 |
| 84286 | TMEM175 | C08 | Human | Oral cavity | OSCC | 8.07e-06 | 1.06e-01 | 0.1919 |
| 84286 | TMEM175 | LN46 | Human | Oral cavity | OSCC | 4.18e-02 | 3.34e-01 | 0.1666 |
| 84286 | TMEM175 | SYSMH1 | Human | Oral cavity | OSCC | 1.52e-07 | 1.28e-01 | 0.1127 |
| 84286 | TMEM175 | SYSMH2 | Human | Oral cavity | OSCC | 6.32e-07 | 1.35e-01 | 0.2326 |
| 84286 | TMEM175 | SYSMH3 | Human | Oral cavity | OSCC | 1.59e-03 | 1.44e-01 | 0.2442 |
| 84286 | TMEM175 | SYSMH5 | Human | Oral cavity | OSCC | 2.23e-06 | 1.36e-01 | 0.0647 |
| 84286 | TMEM175 | SYSMH6 | Human | Oral cavity | OSCC | 1.73e-07 | 1.30e-01 | 0.1275 |
| Page: 1 |
| Tissue | Expression Dynamics | Abbreviation |
| Oral Cavity | 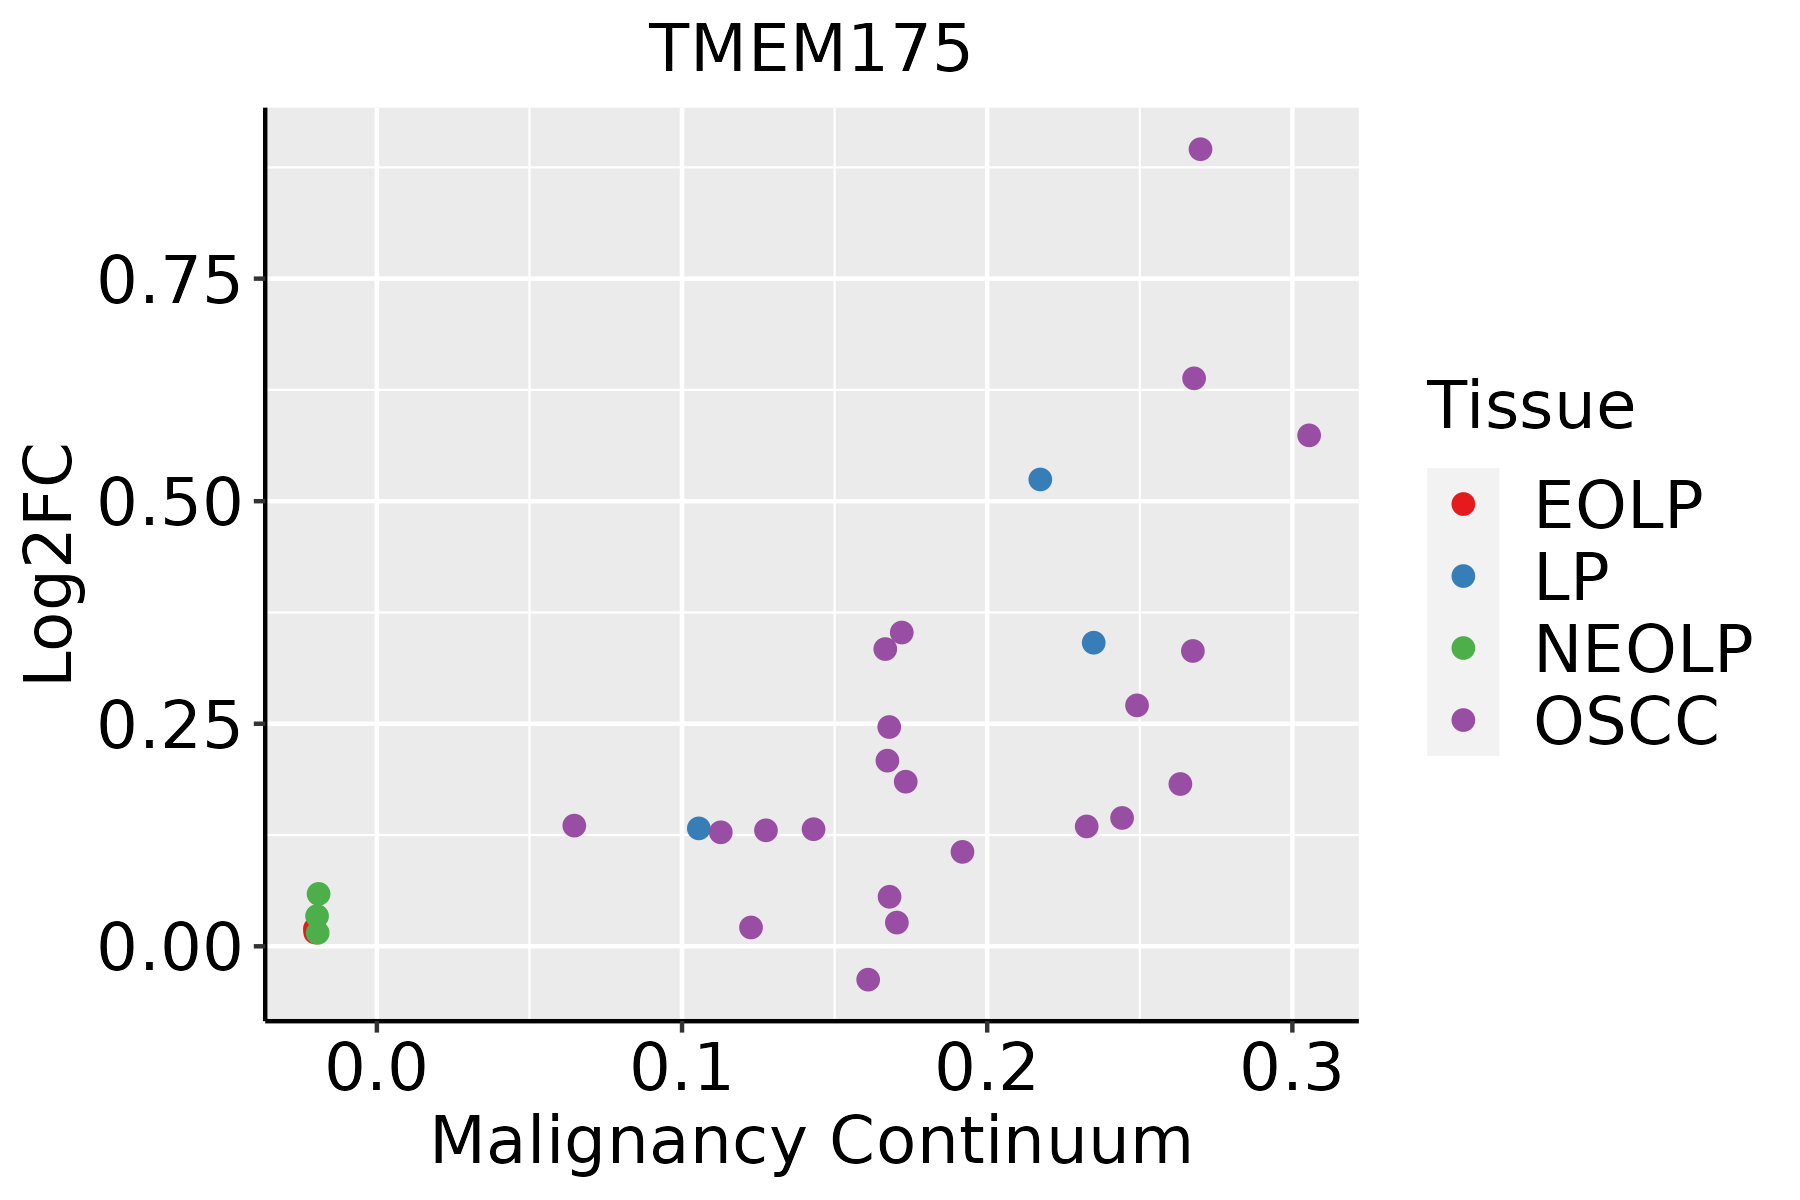 | EOLP: Erosive Oral lichen planus |
| LP: leukoplakia | ||
| NEOLP: Non-erosive oral lichen planus | ||
| OSCC: Oral squamous cell carcinoma |
| ∗log2FC in expression of this searched gene in stem-like cells from each diseased tissue sample relative to stem-like cells in normal samples in each tissue plotted against the malignancy continuum. Samples are colored based on if they are from different disease stage. |
Top |
Malignant transformation related pathway analysis |
| Find out the enriched GO biological processes and KEGG pathways involved in transition from healthy to precancer to cancer |
| Tissue | Disease Stage | Enriched GO biological Processes |
| Colorectum | AD |  |
| Colorectum | SER |  |
| Colorectum | MSS |  |
| Colorectum | MSI-H |  |
| Colorectum | FAP |  |
| ∗Top 15 enriched GO BP terms are showed in the bar plot of each disease state in each tissue. Each row represents a significant GO biological process which is colored according to the -log10(p.adjust). |
| Page: 1 2 3 4 5 6 7 8 9 |
| GO ID | Tissue | Disease Stage | Description | Gene Ratio | Bg Ratio | pvalue | p.adjust | Count |
| GO:00160508 | Oral cavity | OSCC | vesicle organization | 189/7305 | 300/18723 | 2.40e-17 | 2.14e-15 | 189 |
| GO:00070335 | Oral cavity | OSCC | vacuole organization | 115/7305 | 180/18723 | 1.11e-11 | 4.00e-10 | 115 |
| GO:00070402 | Oral cavity | OSCC | lysosome organization | 51/7305 | 74/18723 | 1.77e-07 | 2.87e-06 | 51 |
| GO:00801712 | Oral cavity | OSCC | lytic vacuole organization | 51/7305 | 74/18723 | 1.77e-07 | 2.87e-06 | 51 |
| GO:00482843 | Oral cavity | OSCC | organelle fusion | 82/7305 | 141/18723 | 3.08e-06 | 3.72e-05 | 82 |
| GO:00901742 | Oral cavity | OSCC | organelle membrane fusion | 63/7305 | 110/18723 | 7.75e-05 | 6.01e-04 | 63 |
| GO:00069062 | Oral cavity | OSCC | vesicle fusion | 61/7305 | 106/18723 | 8.28e-05 | 6.35e-04 | 61 |
| GO:00357512 | Oral cavity | OSCC | regulation of lysosomal lumen pH | 14/7305 | 16/18723 | 9.15e-05 | 6.93e-04 | 14 |
| GO:00610253 | Oral cavity | OSCC | membrane fusion | 84/7305 | 163/18723 | 7.56e-04 | 4.12e-03 | 84 |
| Page: 1 |
| Pathway ID | Tissue | Disease Stage | Description | Gene Ratio | Bg Ratio | pvalue | p.adjust | qvalue | Count |
| Page: 1 |
Top |
Cell-cell communication analysis |
| Identification of potential cell-cell interactions between two cell types and their ligand-receptor pairs for different disease states |
| Ligand | Receptor | LRpair | Pathway | Tissue | Disease Stage |
| Page: 1 |
Top |
Single-cell gene regulatory network inference analysis |
| Find out the significant the regulons (TFs) and the target genes of each regulon across cell types for different disease states |
| TF | Cell Type | Tissue | Disease Stage | Target Gene | RSS | Regulon Activity |
| ∗The dot plots of a searched regulon are shown for all cell subpopulations in each disease state of each tissue based on the regulon specific score inferred using pySCENIC and by calculating the average expression. |
| Page: 1 |
Top |
Somatic mutation of malignant transformation related genes |
| Annotation of somatic variants for genes involved in malignant transformation |
| Hugo Symbol | Variant Class | Variant Classification | dbSNP RS | HGVSc | HGVSp | HGVSp Short | SWISSPROT | BIOTYPE | SIFT | PolyPhen | Tumor Sample Barcode | Tissue | Histology | Sex | Age | Stage | Therapy Types | Drugs | Outcome |
| TMEM175 | SNV | Missense_Mutation | c.599C>G | p.Ala200Gly | p.A200G | Q9BSA9 | protein_coding | tolerated(0.4) | benign(0.359) | TCGA-AC-A2FB-01 | Breast | breast invasive carcinoma | Female | >=65 | I/II | Chemotherapy | taxotere | CR | |
| TMEM175 | SNV | Missense_Mutation | novel | c.830T>C | p.Ile277Thr | p.I277T | Q9BSA9 | protein_coding | deleterious(0) | probably_damaging(1) | TCGA-2W-A8YY-01 | Cervix | cervical & endocervical cancer | Female | <65 | I/II | Chemotherapy | cisplatin | CR |
| TMEM175 | SNV | Missense_Mutation | c.1262C>A | p.Ala421Asp | p.A421D | Q9BSA9 | protein_coding | deleterious(0) | probably_damaging(0.991) | TCGA-C5-A2M1-01 | Cervix | cervical & endocervical cancer | Female | <65 | I/II | Unknown | Unknown | SD | |
| TMEM175 | SNV | Missense_Mutation | rs766017281 | c.383N>T | p.Ser128Leu | p.S128L | Q9BSA9 | protein_coding | tolerated(0.12) | benign(0.095) | TCGA-FU-A3HZ-01 | Cervix | cervical & endocervical cancer | Female | <65 | I/II | Chemotherapy | cisplatin | CR |
| TMEM175 | SNV | Missense_Mutation | rs771515337 | c.605N>G | p.Phe202Cys | p.F202C | Q9BSA9 | protein_coding | deleterious(0.02) | probably_damaging(0.997) | TCGA-JX-A3Q8-01 | Cervix | cervical & endocervical cancer | Female | <65 | I/II | Unknown | Unknown | SD |
| TMEM175 | SNV | Missense_Mutation | c.871G>A | p.Val291Met | p.V291M | Q9BSA9 | protein_coding | deleterious(0) | probably_damaging(0.995) | TCGA-A6-5665-01 | Colorectum | colon adenocarcinoma | Female | >=65 | I/II | Unknown | Unknown | PD | |
| TMEM175 | SNV | Missense_Mutation | rs376563142 | c.329N>T | p.Ala110Val | p.A110V | Q9BSA9 | protein_coding | tolerated(0.37) | benign(0.369) | TCGA-AA-A010-01 | Colorectum | colon adenocarcinoma | Female | <65 | I/II | Chemotherapy | folinic | CR |
| TMEM175 | SNV | Missense_Mutation | c.872T>C | p.Val291Ala | p.V291A | Q9BSA9 | protein_coding | deleterious(0.03) | probably_damaging(0.984) | TCGA-AD-6889-01 | Colorectum | colon adenocarcinoma | Male | >=65 | I/II | Chemotherapy | xeloda | PD | |
| TMEM175 | SNV | Missense_Mutation | c.821N>T | p.Thr274Met | p.T274M | Q9BSA9 | protein_coding | deleterious(0) | probably_damaging(1) | TCGA-CK-4951-01 | Colorectum | colon adenocarcinoma | Female | >=65 | I/II | Unknown | Unknown | PD | |
| TMEM175 | SNV | Missense_Mutation | rs373083547 | c.1108N>T | p.Arg370Cys | p.R370C | Q9BSA9 | protein_coding | deleterious(0) | possibly_damaging(0.65) | TCGA-CM-6162-01 | Colorectum | colon adenocarcinoma | Female | <65 | III/IV | Chemotherapy | oxaliplatin | SD |
| Page: 1 2 3 4 5 |
Top |
Related drugs of malignant transformation related genes |
| Identification of chemicals and drugs interact with genes involved in malignant transfromation |
| (DGIdb 4.0) |
| Entrez ID | Symbol | Category | Interaction Types | Drug Claim Name | Drug Name | PMIDs |
| Page: 1 |

Copyright 2023-Present -The University of Texas Health Science Center at Houston |