
|
|||||
|
 | |
| |
| |
| |
| |
| |
|
Gene: TMEM173 |
Gene summary for TMEM173 |
| Gene information | Species | Human | Gene symbol | TMEM173 | Gene ID | 340061 |
| Gene name | stimulator of interferon response cGAMP interactor 1 | |
| Gene Alias | ERIS | |
| Cytomap | 5q31.2 | |
| Gene Type | protein-coding | GO ID | GO:0000045 | UniProtAcc | V5V0K2 |
Top |
Malignant transformation analysis |
| Identification of the aberrant gene expression in precancerous and cancerous lesions by comparing the gene expression of stem-like cells in diseased tissues with normal stem cells |
| Entrez ID | Symbol | Replicates | Species | Organ | Tissue | Adj P-value | Log2FC | Malignancy |
| 340061 | TMEM173 | LZE4T | Human | Esophagus | ESCC | 2.67e-05 | 1.19e-01 | 0.0811 |
| 340061 | TMEM173 | LZE7T | Human | Esophagus | ESCC | 2.19e-04 | 1.86e-01 | 0.0667 |
| 340061 | TMEM173 | LZE8T | Human | Esophagus | ESCC | 6.14e-08 | 3.11e-01 | 0.067 |
| 340061 | TMEM173 | LZE22T | Human | Esophagus | ESCC | 5.93e-03 | 2.03e-01 | 0.068 |
| 340061 | TMEM173 | LZE21T | Human | Esophagus | ESCC | 4.51e-02 | 9.82e-02 | 0.0655 |
| 340061 | TMEM173 | LZE6T | Human | Esophagus | ESCC | 4.87e-02 | 3.58e-01 | 0.0845 |
| 340061 | TMEM173 | P1T-E | Human | Esophagus | ESCC | 2.18e-06 | 2.16e-01 | 0.0875 |
| 340061 | TMEM173 | P2T-E | Human | Esophagus | ESCC | 4.28e-27 | 4.70e-01 | 0.1177 |
| 340061 | TMEM173 | P4T-E | Human | Esophagus | ESCC | 3.48e-13 | 2.60e-01 | 0.1323 |
| 340061 | TMEM173 | P5T-E | Human | Esophagus | ESCC | 3.27e-05 | 1.85e-01 | 0.1327 |
| 340061 | TMEM173 | P8T-E | Human | Esophagus | ESCC | 2.02e-30 | 6.66e-01 | 0.0889 |
| 340061 | TMEM173 | P9T-E | Human | Esophagus | ESCC | 1.43e-24 | 5.79e-01 | 0.1131 |
| 340061 | TMEM173 | P10T-E | Human | Esophagus | ESCC | 7.03e-30 | 6.19e-01 | 0.116 |
| 340061 | TMEM173 | P11T-E | Human | Esophagus | ESCC | 9.41e-32 | 1.41e+00 | 0.1426 |
| 340061 | TMEM173 | P12T-E | Human | Esophagus | ESCC | 2.93e-25 | 4.38e-01 | 0.1122 |
| 340061 | TMEM173 | P15T-E | Human | Esophagus | ESCC | 7.97e-18 | 4.72e-01 | 0.1149 |
| 340061 | TMEM173 | P16T-E | Human | Esophagus | ESCC | 7.34e-14 | 1.11e-01 | 0.1153 |
| 340061 | TMEM173 | P17T-E | Human | Esophagus | ESCC | 4.46e-06 | 3.10e-01 | 0.1278 |
| 340061 | TMEM173 | P19T-E | Human | Esophagus | ESCC | 1.59e-03 | 6.36e-01 | 0.1662 |
| 340061 | TMEM173 | P20T-E | Human | Esophagus | ESCC | 1.04e-11 | 2.47e-01 | 0.1124 |
| Page: 1 2 3 4 5 6 |
| Tissue | Expression Dynamics | Abbreviation |
| Esophagus | 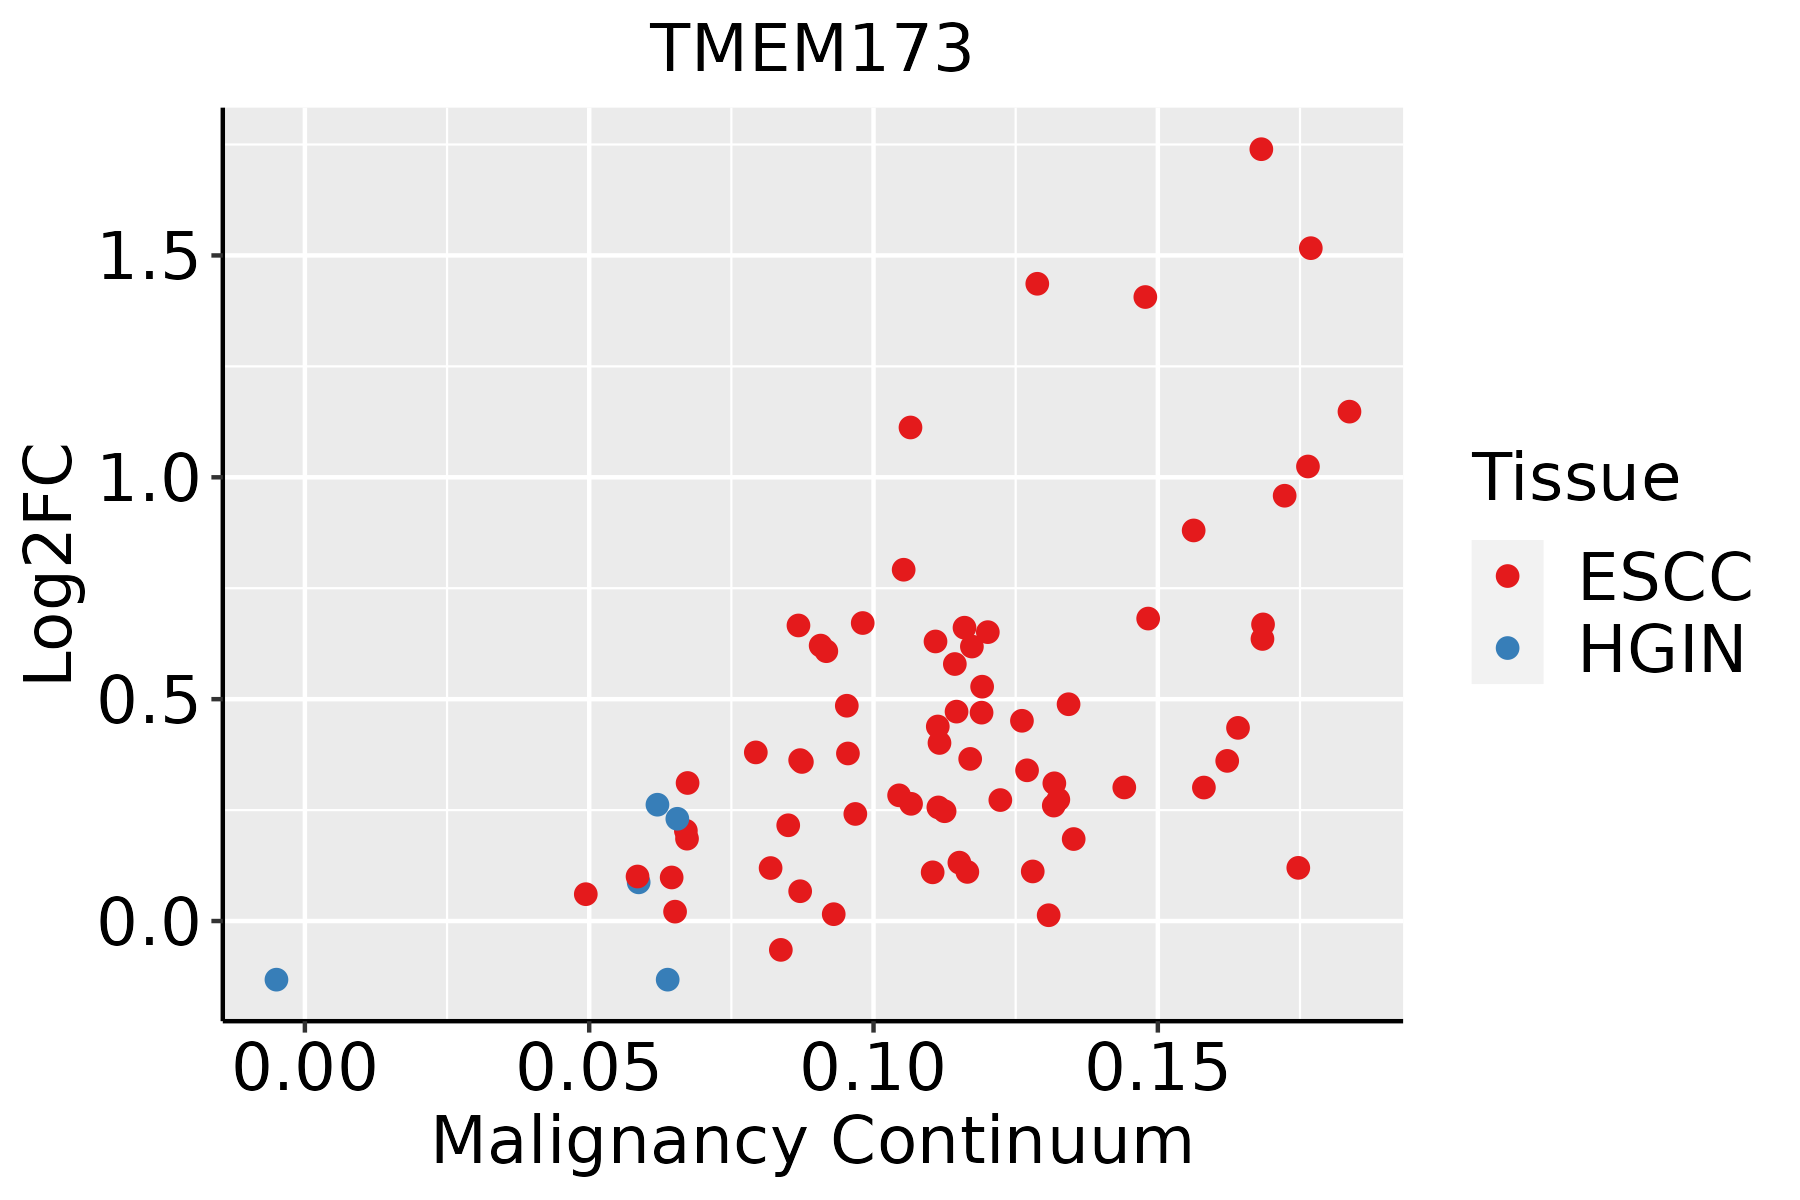 | ESCC: Esophageal squamous cell carcinoma |
| HGIN: High-grade intraepithelial neoplasias | ||
| LGIN: Low-grade intraepithelial neoplasias | ||
| Liver | 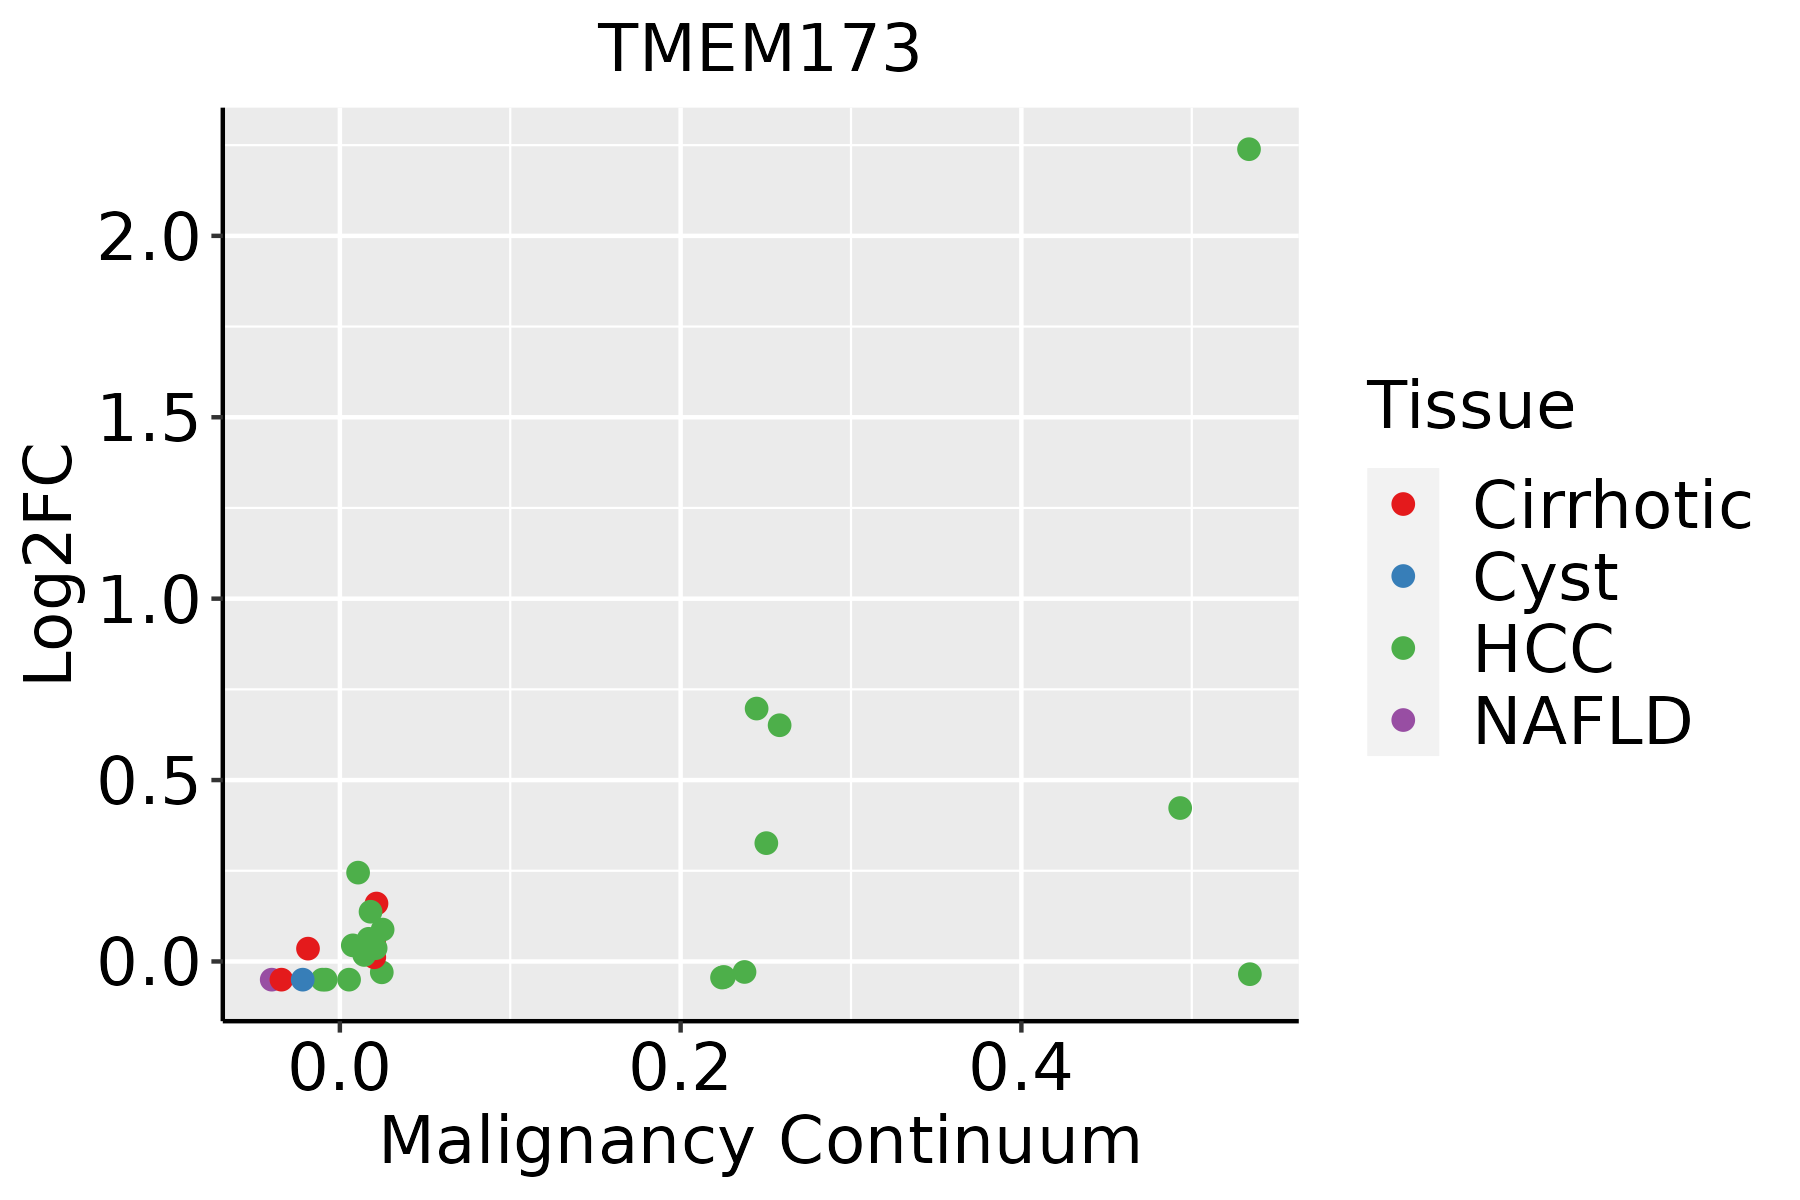 | HCC: Hepatocellular carcinoma |
| NAFLD: Non-alcoholic fatty liver disease | ||
| Oral Cavity | 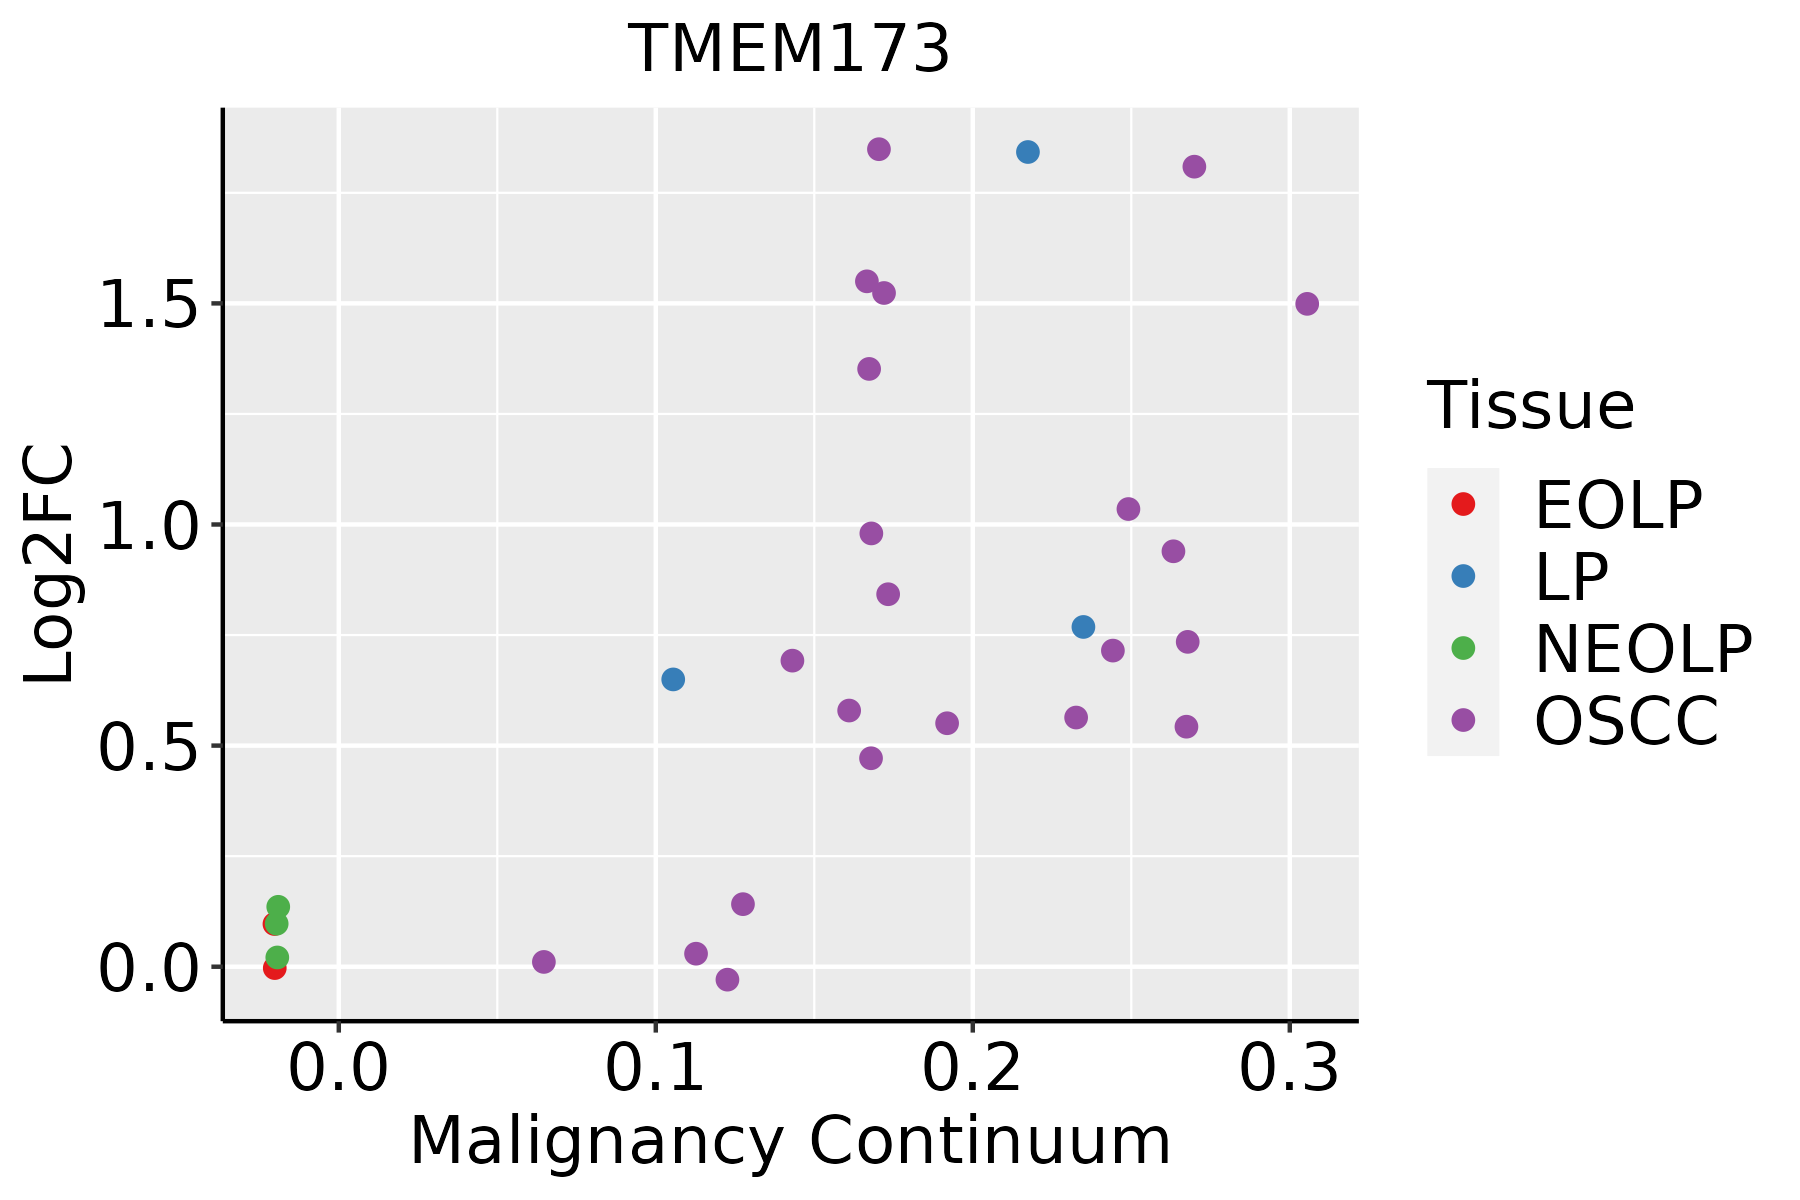 | EOLP: Erosive Oral lichen planus |
| LP: leukoplakia | ||
| NEOLP: Non-erosive oral lichen planus | ||
| OSCC: Oral squamous cell carcinoma | ||
| Skin | 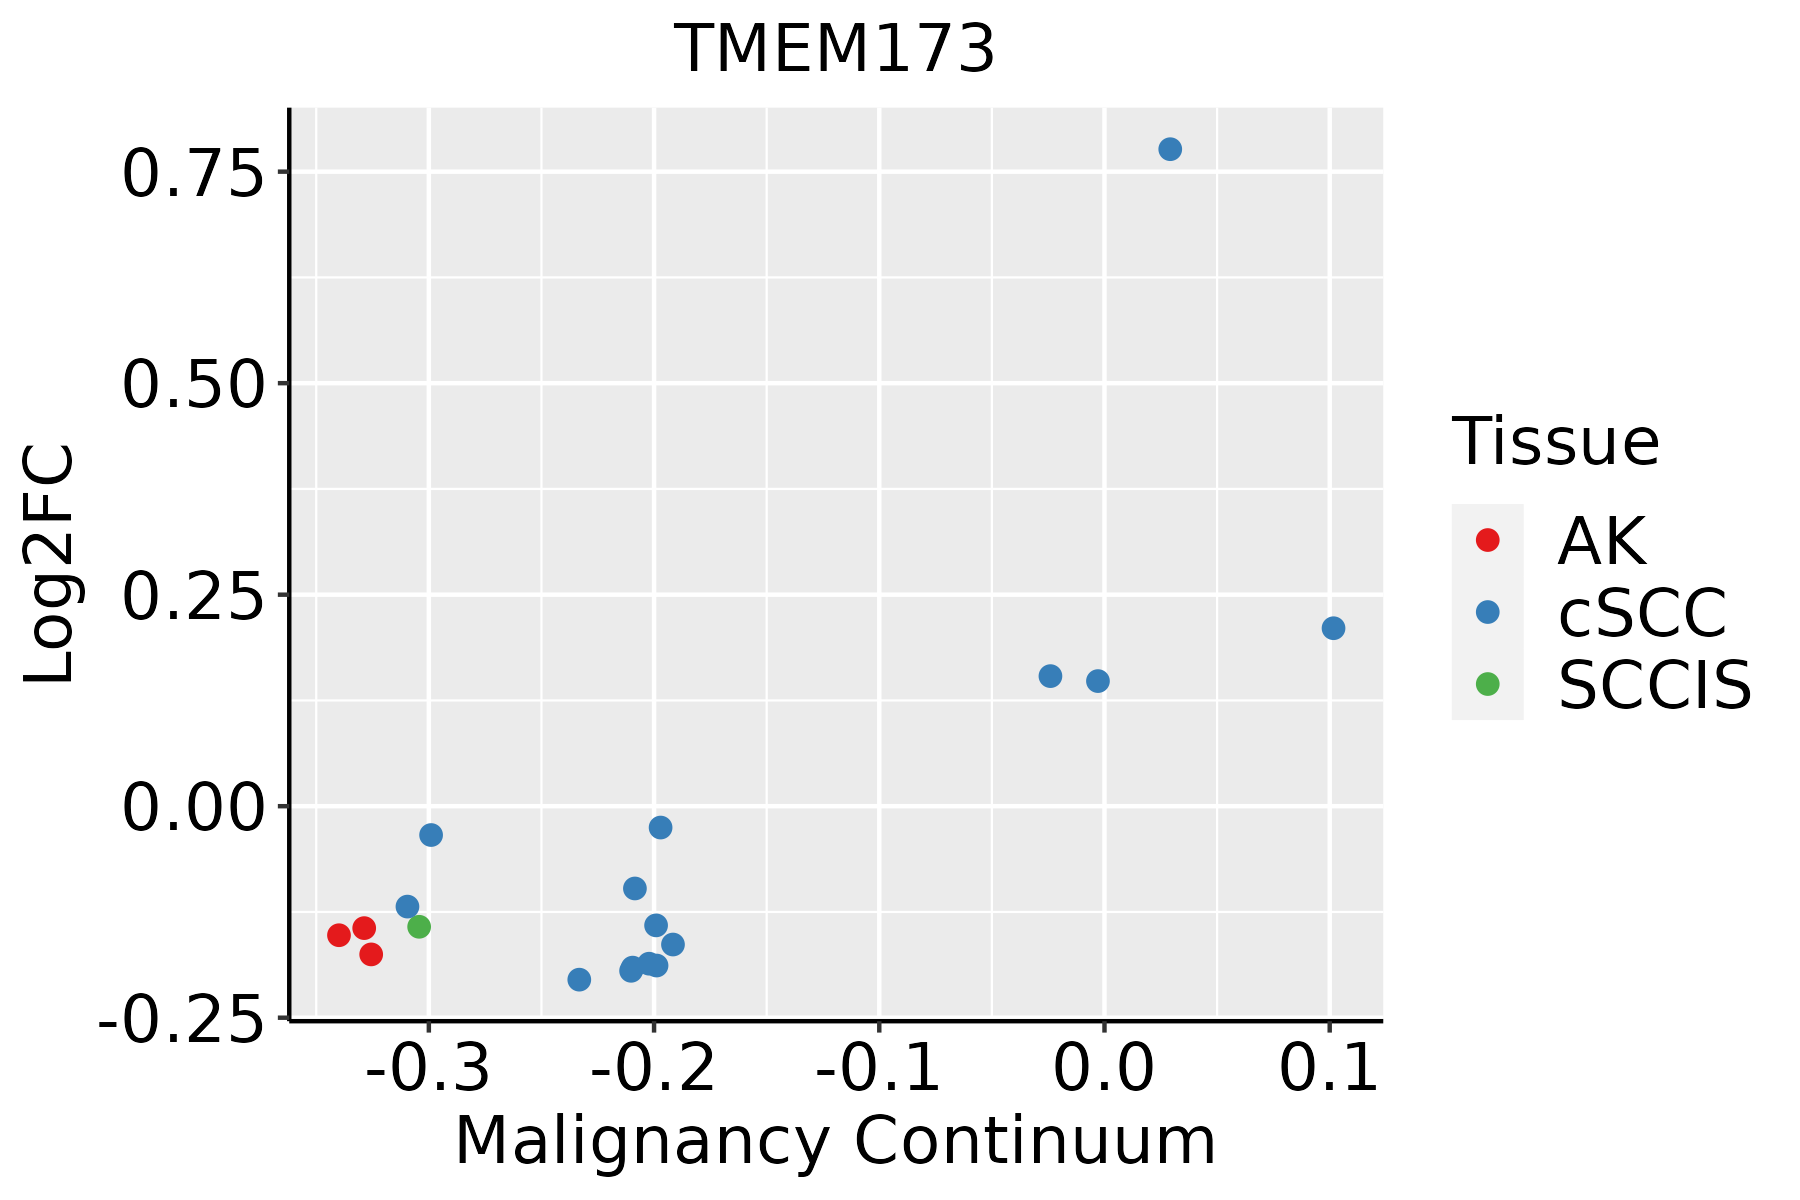 | AK: Actinic keratosis |
| cSCC: Cutaneous squamous cell carcinoma | ||
| SCCIS:squamous cell carcinoma in situ | ||
| Thyroid | 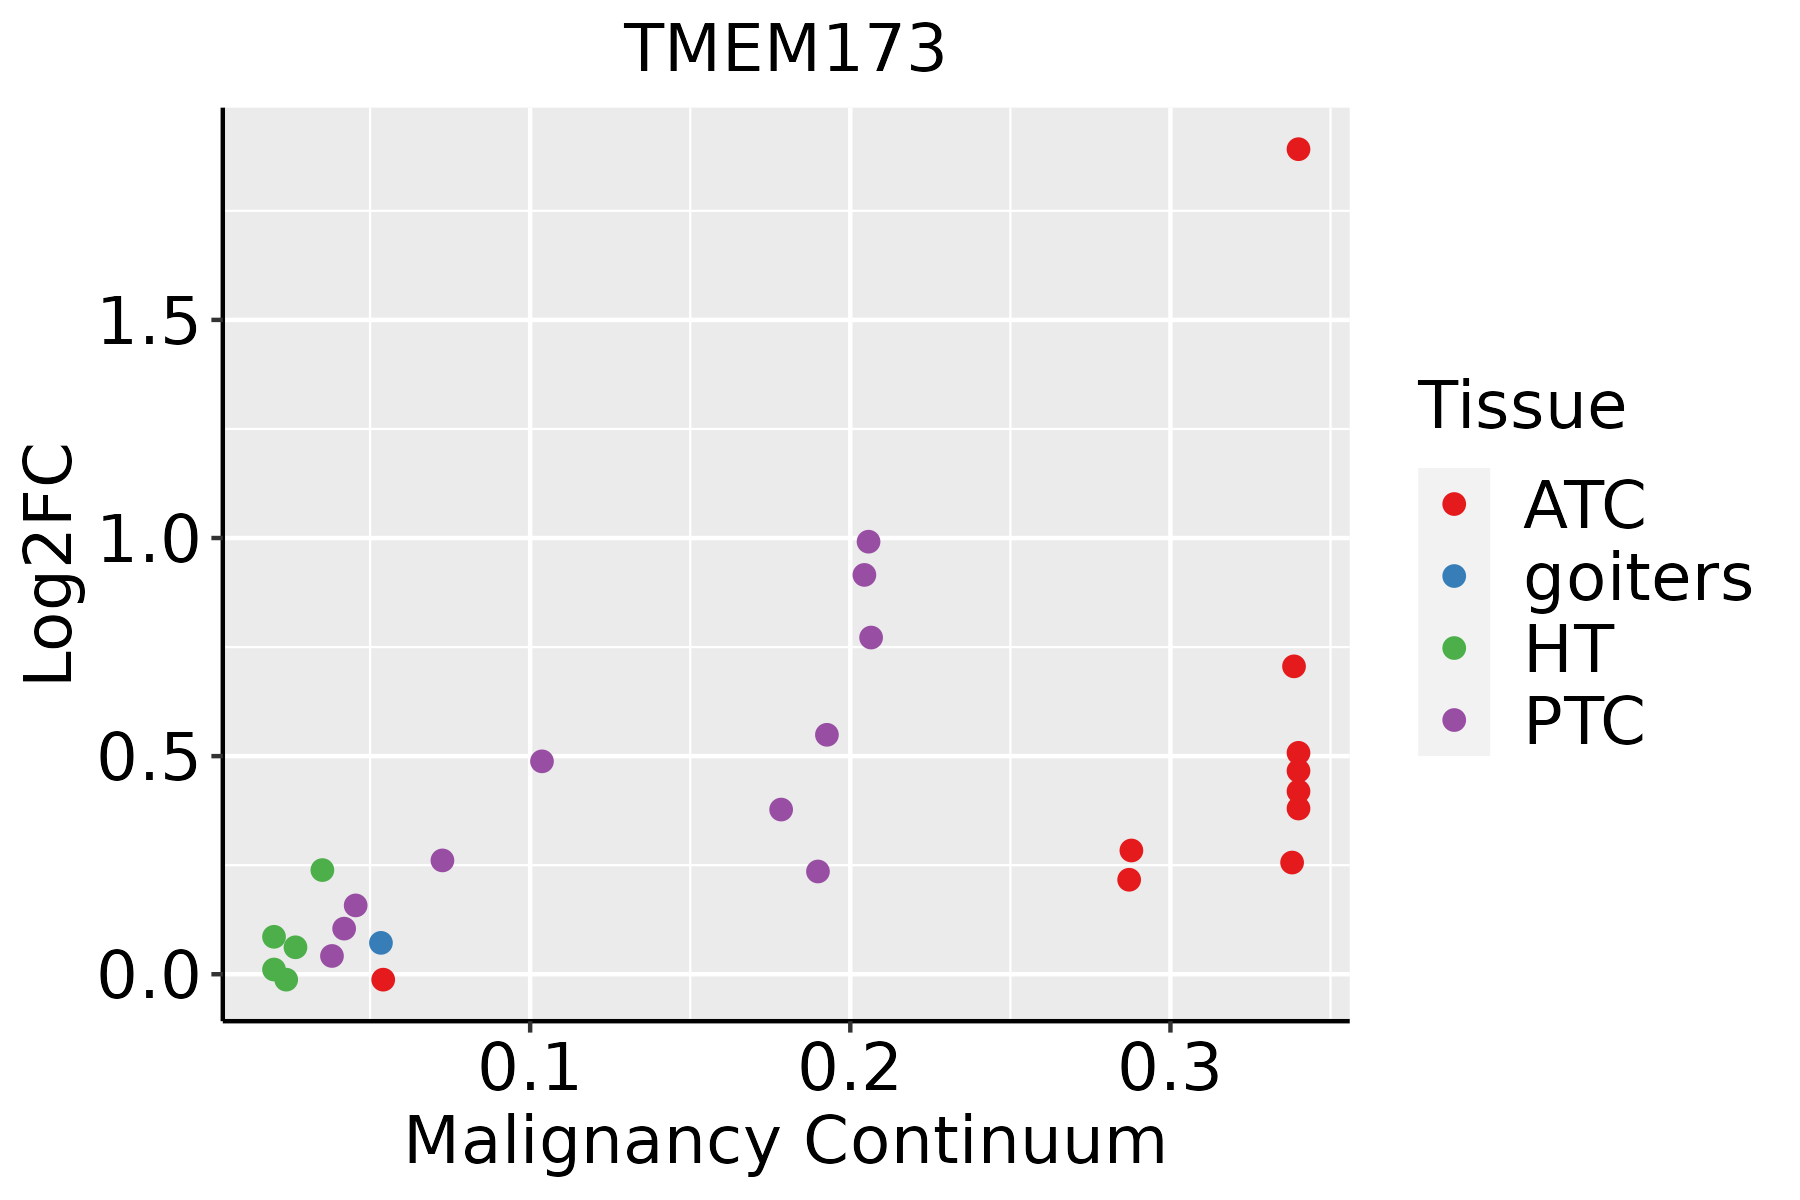 | ATC: Anaplastic thyroid cancer |
| HT: Hashimoto's thyroiditis | ||
| PTC: Papillary thyroid cancer |
| ∗log2FC in expression of this searched gene in stem-like cells from each diseased tissue sample relative to stem-like cells in normal samples in each tissue plotted against the malignancy continuum. Samples are colored based on if they are from different disease stage. |
Top |
Malignant transformation related pathway analysis |
| Find out the enriched GO biological processes and KEGG pathways involved in transition from healthy to precancer to cancer |
| Tissue | Disease Stage | Enriched GO biological Processes |
| Colorectum | AD |  |
| Colorectum | SER |  |
| Colorectum | MSS |  |
| Colorectum | MSI-H |  |
| Colorectum | FAP |  |
| ∗Top 15 enriched GO BP terms are showed in the bar plot of each disease state in each tissue. Each row represents a significant GO biological process which is colored according to the -log10(p.adjust). |
| Page: 1 2 3 4 5 6 7 8 9 |
| GO ID | Tissue | Disease Stage | Description | Gene Ratio | Bg Ratio | pvalue | p.adjust | Count |
| Page: 1 |
| Pathway ID | Tissue | Disease Stage | Description | Gene Ratio | Bg Ratio | pvalue | p.adjust | qvalue | Count |
| hsa05171 | Colorectum | AD | Coronavirus disease - COVID-19 | 113/2092 | 232/8465 | 9.90e-16 | 2.55e-14 | 1.63e-14 | 113 |
| hsa05131 | Colorectum | AD | Shigellosis | 109/2092 | 247/8465 | 1.09e-11 | 2.44e-10 | 1.55e-10 | 109 |
| hsa05170 | Colorectum | AD | Human immunodeficiency virus 1 infection | 72/2092 | 212/8465 | 1.40e-03 | 8.46e-03 | 5.39e-03 | 72 |
| hsa05163 | Colorectum | AD | Human cytomegalovirus infection | 75/2092 | 225/8465 | 2.00e-03 | 1.10e-02 | 7.01e-03 | 75 |
| hsa051711 | Colorectum | AD | Coronavirus disease - COVID-19 | 113/2092 | 232/8465 | 9.90e-16 | 2.55e-14 | 1.63e-14 | 113 |
| hsa051311 | Colorectum | AD | Shigellosis | 109/2092 | 247/8465 | 1.09e-11 | 2.44e-10 | 1.55e-10 | 109 |
| hsa051701 | Colorectum | AD | Human immunodeficiency virus 1 infection | 72/2092 | 212/8465 | 1.40e-03 | 8.46e-03 | 5.39e-03 | 72 |
| hsa051631 | Colorectum | AD | Human cytomegalovirus infection | 75/2092 | 225/8465 | 2.00e-03 | 1.10e-02 | 7.01e-03 | 75 |
| hsa051712 | Colorectum | SER | Coronavirus disease - COVID-19 | 98/1580 | 232/8465 | 3.33e-17 | 8.50e-16 | 6.17e-16 | 98 |
| hsa051312 | Colorectum | SER | Shigellosis | 87/1580 | 247/8465 | 3.07e-10 | 7.27e-09 | 5.28e-09 | 87 |
| hsa051702 | Colorectum | SER | Human immunodeficiency virus 1 infection | 58/1580 | 212/8465 | 1.08e-03 | 8.56e-03 | 6.21e-03 | 58 |
| hsa051632 | Colorectum | SER | Human cytomegalovirus infection | 57/1580 | 225/8465 | 7.40e-03 | 3.84e-02 | 2.79e-02 | 57 |
| hsa051713 | Colorectum | SER | Coronavirus disease - COVID-19 | 98/1580 | 232/8465 | 3.33e-17 | 8.50e-16 | 6.17e-16 | 98 |
| hsa051313 | Colorectum | SER | Shigellosis | 87/1580 | 247/8465 | 3.07e-10 | 7.27e-09 | 5.28e-09 | 87 |
| hsa051703 | Colorectum | SER | Human immunodeficiency virus 1 infection | 58/1580 | 212/8465 | 1.08e-03 | 8.56e-03 | 6.21e-03 | 58 |
| hsa051633 | Colorectum | SER | Human cytomegalovirus infection | 57/1580 | 225/8465 | 7.40e-03 | 3.84e-02 | 2.79e-02 | 57 |
| Page: 1 |
Top |
Cell-cell communication analysis |
| Identification of potential cell-cell interactions between two cell types and their ligand-receptor pairs for different disease states |
| Ligand | Receptor | LRpair | Pathway | Tissue | Disease Stage |
| Page: 1 |
Top |
Single-cell gene regulatory network inference analysis |
| Find out the significant the regulons (TFs) and the target genes of each regulon across cell types for different disease states |
| TF | Cell Type | Tissue | Disease Stage | Target Gene | RSS | Regulon Activity |
| ∗The dot plots of a searched regulon are shown for all cell subpopulations in each disease state of each tissue based on the regulon specific score inferred using pySCENIC and by calculating the average expression. |
| Page: 1 |
Top |
Somatic mutation of malignant transformation related genes |
| Annotation of somatic variants for genes involved in malignant transformation |
| Hugo Symbol | Variant Class | Variant Classification | dbSNP RS | HGVSc | HGVSp | HGVSp Short | SWISSPROT | BIOTYPE | SIFT | PolyPhen | Tumor Sample Barcode | Tissue | Histology | Sex | Age | Stage | Therapy Types | Drugs | Outcome |
| TMEM173 | SNV | Missense_Mutation | c.628G>A | p.Asp210Asn | p.D210N | Q86WV6 | protein_coding | tolerated(0.06) | possibly_damaging(0.725) | TCGA-AN-A0AK-01 | Breast | breast invasive carcinoma | Female | >=65 | I/II | Unknown | Unknown | SD | |
| TMEM173 | SNV | Missense_Mutation | novel | c.505C>T | p.Arg169Trp | p.R169W | Q86WV6 | protein_coding | deleterious(0) | possibly_damaging(0.804) | TCGA-2W-A8YY-01 | Cervix | cervical & endocervical cancer | Female | <65 | I/II | Chemotherapy | cisplatin | CR |
| TMEM173 | SNV | Missense_Mutation | rs772018436 | c.971N>T | p.Ser324Leu | p.S324L | Q86WV6 | protein_coding | tolerated(0.66) | benign(0) | TCGA-MU-A51Y-01 | Cervix | cervical & endocervical cancer | Female | <65 | I/II | Unknown | Unknown | SD |
| TMEM173 | SNV | Missense_Mutation | novel | c.520N>A | p.Glu174Lys | p.E174K | Q86WV6 | protein_coding | tolerated(0.92) | benign(0) | TCGA-VS-A9U5-01 | Cervix | cervical & endocervical cancer | Female | <65 | I/II | Chemotherapy | cisplatin | CR |
| TMEM173 | SNV | Missense_Mutation | rs767228149 | c.694C>T | p.His232Tyr | p.H232Y | Q86WV6 | protein_coding | deleterious(0) | benign(0) | TCGA-AA-A022-01 | Colorectum | colon adenocarcinoma | Female | >=65 | I/II | Unknown | Unknown | SD |
| TMEM173 | SNV | Missense_Mutation | c.1030N>T | p.Gly344Cys | p.G344C | Q86WV6 | protein_coding | tolerated(0.28) | benign(0.042) | TCGA-CM-6674-01 | Colorectum | colon adenocarcinoma | Male | <65 | I/II | Unknown | Unknown | SD | |
| TMEM173 | SNV | Missense_Mutation | c.604N>A | p.Leu202Ile | p.L202I | Q86WV6 | protein_coding | tolerated(0.9) | benign(0) | TCGA-A5-A0G1-01 | Endometrium | uterine corpus endometrioid carcinoma | Female | >=65 | I/II | Unknown | Unknown | SD | |
| TMEM173 | SNV | Missense_Mutation | novel | c.866A>G | p.Lys289Arg | p.K289R | Q86WV6 | protein_coding | deleterious(0.04) | benign(0.301) | TCGA-A5-A1OF-01 | Endometrium | uterine corpus endometrioid carcinoma | Female | <65 | I/II | Unknown | Unknown | SD |
| TMEM173 | SNV | Missense_Mutation | c.827A>C | p.Gln276Pro | p.Q276P | Q86WV6 | protein_coding | tolerated(0.22) | benign(0.093) | TCGA-AP-A0LF-01 | Endometrium | uterine corpus endometrioid carcinoma | Female | >=65 | III/IV | Unknown | Unknown | SD | |
| TMEM173 | SNV | Missense_Mutation | rs867650202 | c.256C>T | p.Arg86Trp | p.R86W | Q86WV6 | protein_coding | tolerated(0.15) | benign(0.007) | TCGA-AX-A2HC-01 | Endometrium | uterine corpus endometrioid carcinoma | Female | <65 | III/IV | Chemotherapy | paclitaxel | PD |
| Page: 1 2 3 4 |
Top |
Related drugs of malignant transformation related genes |
| Identification of chemicals and drugs interact with genes involved in malignant transfromation |
| (DGIdb 4.0) |
| Entrez ID | Symbol | Category | Interaction Types | Drug Claim Name | Drug Name | PMIDs |
| Page: 1 |

Copyright 2023-Present -The University of Texas Health Science Center at Houston |