
|
|||||
|
 | |
| |
| |
| |
| |
| |
|
Gene: TMEM171 |
Gene summary for TMEM171 |
| Gene information | Species | Human | Gene symbol | TMEM171 | Gene ID | 134285 |
| Gene name | transmembrane protein 171 | |
| Gene Alias | PRP2 | |
| Cytomap | 5q13.2 | |
| Gene Type | protein-coding | GO ID | GO:0005575 | UniProtAcc | Q8WVE6 |
Top |
Malignant transformation analysis |
| Identification of the aberrant gene expression in precancerous and cancerous lesions by comparing the gene expression of stem-like cells in diseased tissues with normal stem cells |
| Entrez ID | Symbol | Replicates | Species | Organ | Tissue | Adj P-value | Log2FC | Malignancy |
| 134285 | TMEM171 | P1T-E | Human | Esophagus | ESCC | 2.44e-06 | 2.74e-01 | 0.0875 |
| 134285 | TMEM171 | P4T-E | Human | Esophagus | ESCC | 1.36e-04 | 1.39e-01 | 0.1323 |
| 134285 | TMEM171 | P5T-E | Human | Esophagus | ESCC | 8.40e-04 | 1.29e-01 | 0.1327 |
| 134285 | TMEM171 | P8T-E | Human | Esophagus | ESCC | 1.88e-04 | 1.40e-01 | 0.0889 |
| 134285 | TMEM171 | P9T-E | Human | Esophagus | ESCC | 5.74e-10 | 2.55e-01 | 0.1131 |
| 134285 | TMEM171 | P10T-E | Human | Esophagus | ESCC | 2.02e-06 | 1.99e-01 | 0.116 |
| 134285 | TMEM171 | P12T-E | Human | Esophagus | ESCC | 4.41e-07 | 1.71e-01 | 0.1122 |
| 134285 | TMEM171 | P20T-E | Human | Esophagus | ESCC | 5.73e-03 | 1.04e-01 | 0.1124 |
| 134285 | TMEM171 | P21T-E | Human | Esophagus | ESCC | 8.40e-04 | 1.10e-01 | 0.1617 |
| 134285 | TMEM171 | P23T-E | Human | Esophagus | ESCC | 1.18e-21 | 4.87e-01 | 0.108 |
| 134285 | TMEM171 | P26T-E | Human | Esophagus | ESCC | 9.44e-07 | 1.95e-01 | 0.1276 |
| 134285 | TMEM171 | P27T-E | Human | Esophagus | ESCC | 3.50e-02 | 9.33e-02 | 0.1055 |
| 134285 | TMEM171 | P28T-E | Human | Esophagus | ESCC | 9.44e-07 | 1.67e-01 | 0.1149 |
| 134285 | TMEM171 | P32T-E | Human | Esophagus | ESCC | 3.97e-04 | 1.15e-01 | 0.1666 |
| 134285 | TMEM171 | P37T-E | Human | Esophagus | ESCC | 9.96e-06 | 1.40e-01 | 0.1371 |
| 134285 | TMEM171 | P40T-E | Human | Esophagus | ESCC | 5.68e-07 | 2.09e-01 | 0.109 |
| 134285 | TMEM171 | P42T-E | Human | Esophagus | ESCC | 2.62e-05 | 2.30e-01 | 0.1175 |
| 134285 | TMEM171 | P47T-E | Human | Esophagus | ESCC | 1.66e-02 | 8.84e-02 | 0.1067 |
| 134285 | TMEM171 | P49T-E | Human | Esophagus | ESCC | 7.48e-03 | 3.72e-01 | 0.1768 |
| 134285 | TMEM171 | P52T-E | Human | Esophagus | ESCC | 9.02e-11 | 2.68e-01 | 0.1555 |
| Page: 1 2 3 |
| Tissue | Expression Dynamics | Abbreviation |
| Esophagus | 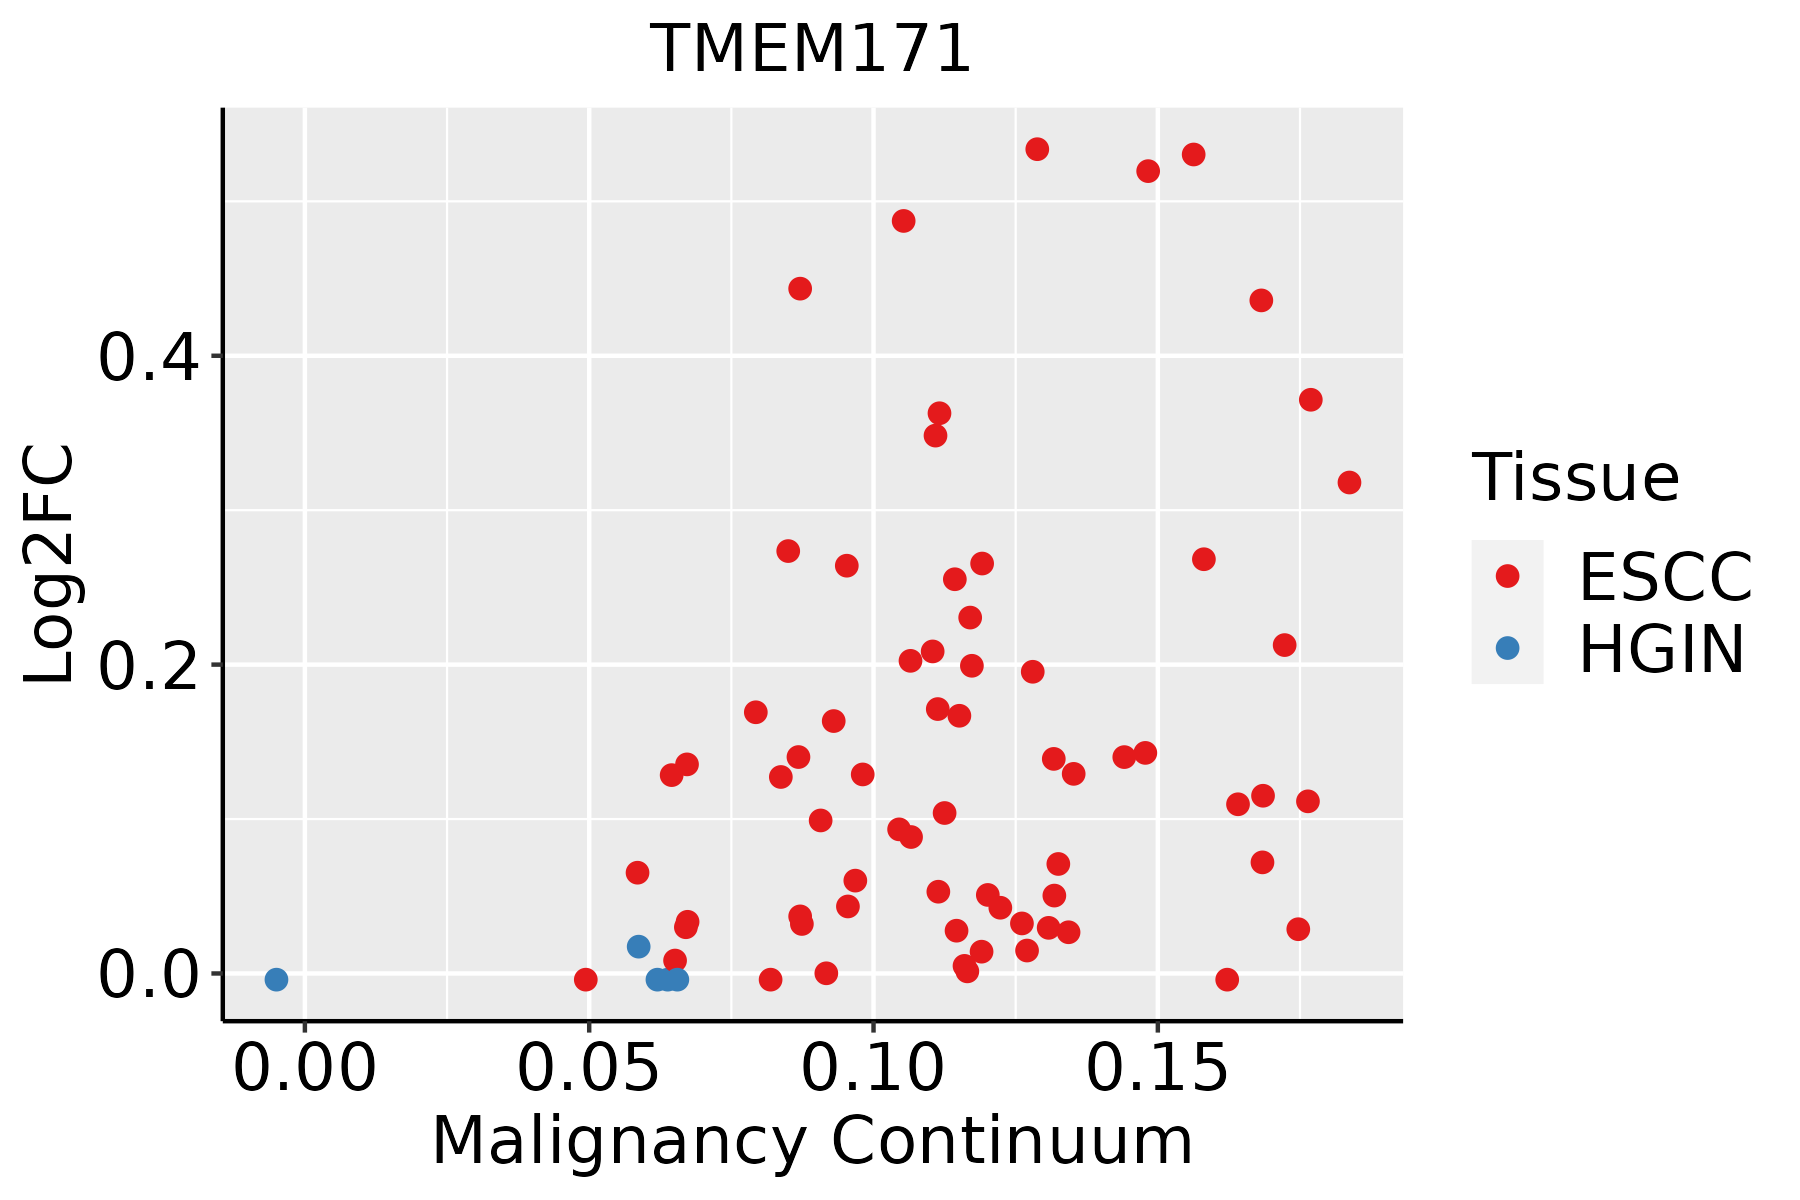 | ESCC: Esophageal squamous cell carcinoma |
| HGIN: High-grade intraepithelial neoplasias | ||
| LGIN: Low-grade intraepithelial neoplasias | ||
| Oral Cavity |  | EOLP: Erosive Oral lichen planus |
| LP: leukoplakia | ||
| NEOLP: Non-erosive oral lichen planus | ||
| OSCC: Oral squamous cell carcinoma |
| ∗log2FC in expression of this searched gene in stem-like cells from each diseased tissue sample relative to stem-like cells in normal samples in each tissue plotted against the malignancy continuum. Samples are colored based on if they are from different disease stage. |
Top |
Malignant transformation related pathway analysis |
| Find out the enriched GO biological processes and KEGG pathways involved in transition from healthy to precancer to cancer |
| Tissue | Disease Stage | Enriched GO biological Processes |
| Colorectum | AD |  |
| Colorectum | SER |  |
| Colorectum | MSS |  |
| Colorectum | MSI-H |  |
| Colorectum | FAP |  |
| ∗Top 15 enriched GO BP terms are showed in the bar plot of each disease state in each tissue. Each row represents a significant GO biological process which is colored according to the -log10(p.adjust). |
| Page: 1 2 3 4 5 6 7 8 9 |
| GO ID | Tissue | Disease Stage | Description | Gene Ratio | Bg Ratio | pvalue | p.adjust | Count |
| Page: 1 |
| Pathway ID | Tissue | Disease Stage | Description | Gene Ratio | Bg Ratio | pvalue | p.adjust | qvalue | Count |
| Page: 1 |
Top |
Cell-cell communication analysis |
| Identification of potential cell-cell interactions between two cell types and their ligand-receptor pairs for different disease states |
| Ligand | Receptor | LRpair | Pathway | Tissue | Disease Stage |
| Page: 1 |
Top |
Single-cell gene regulatory network inference analysis |
| Find out the significant the regulons (TFs) and the target genes of each regulon across cell types for different disease states |
| TF | Cell Type | Tissue | Disease Stage | Target Gene | RSS | Regulon Activity |
| ∗The dot plots of a searched regulon are shown for all cell subpopulations in each disease state of each tissue based on the regulon specific score inferred using pySCENIC and by calculating the average expression. |
| Page: 1 |
Top |
Somatic mutation of malignant transformation related genes |
| Annotation of somatic variants for genes involved in malignant transformation |
| Hugo Symbol | Variant Class | Variant Classification | dbSNP RS | HGVSc | HGVSp | HGVSp Short | SWISSPROT | BIOTYPE | SIFT | PolyPhen | Tumor Sample Barcode | Tissue | Histology | Sex | Age | Stage | Therapy Types | Drugs | Outcome |
| TMEM171 | SNV | Missense_Mutation | novel | c.236N>T | p.Ser79Phe | p.S79F | Q8WVE6 | protein_coding | tolerated(0.09) | probably_damaging(0.999) | TCGA-5L-AAT1-01 | Breast | breast invasive carcinoma | Female | <65 | III/IV | Hormone Therapy | letrozol | SD |
| TMEM171 | SNV | Missense_Mutation | c.55N>T | p.Ser19Cys | p.S19C | Q8WVE6 | protein_coding | deleterious(0) | possibly_damaging(0.789) | TCGA-E2-A1LA-01 | Breast | breast invasive carcinoma | Female | <65 | I/II | Hormone Therapy | arimidex | SD | |
| TMEM171 | SNV | Missense_Mutation | c.652N>T | p.Ile218Leu | p.I218L | Q8WVE6 | protein_coding | tolerated(0.12) | benign(0.086) | TCGA-E9-A1N9-01 | Breast | breast invasive carcinoma | Female | <65 | I/II | Chemotherapy | doxorubicin | SD | |
| TMEM171 | SNV | Missense_Mutation | novel | c.531N>G | p.Phe177Leu | p.F177L | Q8WVE6 | protein_coding | tolerated(0.12) | probably_damaging(0.996) | TCGA-VS-A9V5-01 | Cervix | cervical & endocervical cancer | Female | <65 | I/II | Chemotherapy | carboplatin | PD |
| TMEM171 | SNV | Missense_Mutation | c.175N>T | p.Leu59Phe | p.L59F | Q8WVE6 | protein_coding | tolerated(0.09) | possibly_damaging(0.593) | TCGA-AA-3672-01 | Colorectum | colon adenocarcinoma | Female | >=65 | III/IV | Unknown | Unknown | SD | |
| TMEM171 | SNV | Missense_Mutation | rs747220933 | c.319N>T | p.Arg107Cys | p.R107C | Q8WVE6 | protein_coding | tolerated(0.27) | benign(0.255) | TCGA-AA-3854-01 | Colorectum | colon adenocarcinoma | Female | >=65 | I/II | Unknown | Unknown | SD |
| TMEM171 | SNV | Missense_Mutation | novel | c.218N>T | p.Ala73Val | p.A73V | Q8WVE6 | protein_coding | tolerated(0.15) | benign(0.003) | TCGA-AZ-4315-01 | Colorectum | colon adenocarcinoma | Male | <65 | I/II | Unknown | Unknown | SD |
| TMEM171 | SNV | Missense_Mutation | novel | c.820N>T | p.Asp274Tyr | p.D274Y | Q8WVE6 | protein_coding | deleterious(0) | possibly_damaging(0.73) | TCGA-A5-A2K5-01 | Endometrium | uterine corpus endometrioid carcinoma | Female | >=65 | I/II | Unknown | Unknown | SD |
| TMEM171 | SNV | Missense_Mutation | rs774216272 | c.431N>T | p.Pro144Leu | p.P144L | Q8WVE6 | protein_coding | tolerated(0.69) | benign(0.007) | TCGA-AJ-A3EL-01 | Endometrium | uterine corpus endometrioid carcinoma | Female | <65 | I/II | Unknown | Unknown | SD |
| TMEM171 | SNV | Missense_Mutation | rs761332689 | c.292N>A | p.Asp98Asn | p.D98N | Q8WVE6 | protein_coding | tolerated(0.14) | benign(0.089) | TCGA-AP-A051-01 | Endometrium | uterine corpus endometrioid carcinoma | Female | >=65 | I/II | Unknown | Unknown | SD |
| Page: 1 2 3 4 5 |
Top |
Related drugs of malignant transformation related genes |
| Identification of chemicals and drugs interact with genes involved in malignant transfromation |
| (DGIdb 4.0) |
| Entrez ID | Symbol | Category | Interaction Types | Drug Claim Name | Drug Name | PMIDs |
| Page: 1 |

Copyright 2023-Present -The University of Texas Health Science Center at Houston |