
|
|||||
|
 | |
| |
| |
| |
| |
| |
|
Gene: TMEM17 |
Gene summary for TMEM17 |
| Gene information | Species | Human | Gene symbol | TMEM17 | Gene ID | 200728 |
| Gene name | transmembrane protein 17 | |
| Gene Alias | TMEM17 | |
| Cytomap | 2p15 | |
| Gene Type | protein-coding | GO ID | GO:0006996 | UniProtAcc | Q86X19 |
Top |
Malignant transformation analysis |
| Identification of the aberrant gene expression in precancerous and cancerous lesions by comparing the gene expression of stem-like cells in diseased tissues with normal stem cells |
| Entrez ID | Symbol | Replicates | Species | Organ | Tissue | Adj P-value | Log2FC | Malignancy |
| 200728 | TMEM17 | LZE4T | Human | Esophagus | ESCC | 6.19e-10 | 2.55e-01 | 0.0811 |
| 200728 | TMEM17 | P2T-E | Human | Esophagus | ESCC | 5.95e-29 | 5.31e-01 | 0.1177 |
| 200728 | TMEM17 | P4T-E | Human | Esophagus | ESCC | 8.00e-03 | 9.25e-02 | 0.1323 |
| 200728 | TMEM17 | P9T-E | Human | Esophagus | ESCC | 1.11e-03 | 9.89e-02 | 0.1131 |
| 200728 | TMEM17 | P10T-E | Human | Esophagus | ESCC | 1.96e-05 | 1.19e-01 | 0.116 |
| 200728 | TMEM17 | P11T-E | Human | Esophagus | ESCC | 1.72e-04 | 1.62e-01 | 0.1426 |
| 200728 | TMEM17 | P12T-E | Human | Esophagus | ESCC | 4.17e-05 | 1.23e-01 | 0.1122 |
| 200728 | TMEM17 | P15T-E | Human | Esophagus | ESCC | 1.35e-04 | 1.19e-01 | 0.1149 |
| 200728 | TMEM17 | P16T-E | Human | Esophagus | ESCC | 4.30e-10 | 2.75e-01 | 0.1153 |
| 200728 | TMEM17 | P20T-E | Human | Esophagus | ESCC | 3.20e-07 | 1.62e-01 | 0.1124 |
| 200728 | TMEM17 | P21T-E | Human | Esophagus | ESCC | 7.98e-13 | 2.47e-01 | 0.1617 |
| 200728 | TMEM17 | P22T-E | Human | Esophagus | ESCC | 8.84e-05 | 9.91e-02 | 0.1236 |
| 200728 | TMEM17 | P24T-E | Human | Esophagus | ESCC | 1.88e-04 | 8.99e-02 | 0.1287 |
| 200728 | TMEM17 | P26T-E | Human | Esophagus | ESCC | 2.74e-22 | 1.56e-01 | 0.1276 |
| 200728 | TMEM17 | P27T-E | Human | Esophagus | ESCC | 4.44e-08 | 1.38e-01 | 0.1055 |
| 200728 | TMEM17 | P28T-E | Human | Esophagus | ESCC | 9.67e-18 | 3.45e-01 | 0.1149 |
| 200728 | TMEM17 | P30T-E | Human | Esophagus | ESCC | 2.89e-13 | 5.11e-01 | 0.137 |
| 200728 | TMEM17 | P31T-E | Human | Esophagus | ESCC | 3.78e-13 | 1.61e-01 | 0.1251 |
| 200728 | TMEM17 | P32T-E | Human | Esophagus | ESCC | 9.44e-07 | 1.80e-01 | 0.1666 |
| 200728 | TMEM17 | P36T-E | Human | Esophagus | ESCC | 1.55e-04 | 1.43e-01 | 0.1187 |
| Page: 1 2 3 |
| Tissue | Expression Dynamics | Abbreviation |
| Esophagus | 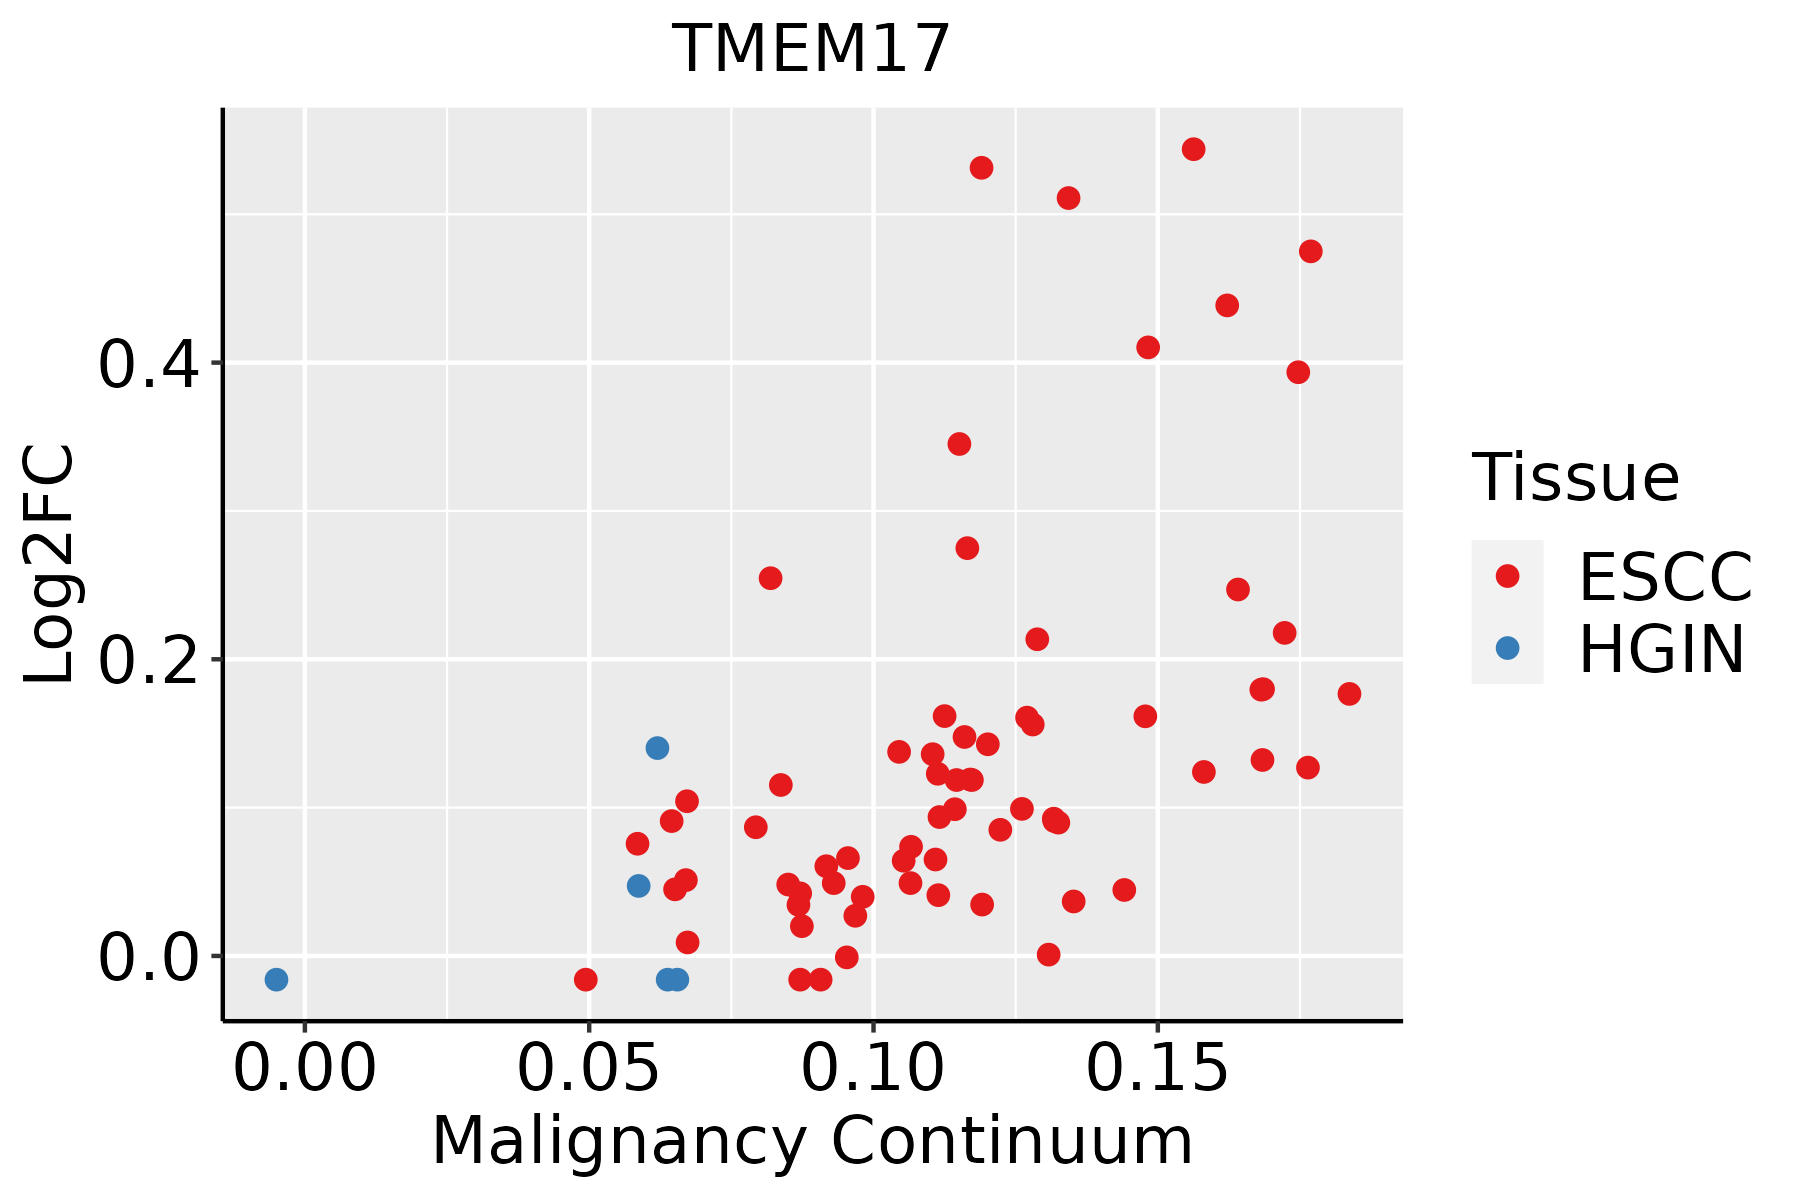 | ESCC: Esophageal squamous cell carcinoma |
| HGIN: High-grade intraepithelial neoplasias | ||
| LGIN: Low-grade intraepithelial neoplasias | ||
| Liver |  | HCC: Hepatocellular carcinoma |
| NAFLD: Non-alcoholic fatty liver disease |
| ∗log2FC in expression of this searched gene in stem-like cells from each diseased tissue sample relative to stem-like cells in normal samples in each tissue plotted against the malignancy continuum. Samples are colored based on if they are from different disease stage. |
Top |
Malignant transformation related pathway analysis |
| Find out the enriched GO biological processes and KEGG pathways involved in transition from healthy to precancer to cancer |
| Tissue | Disease Stage | Enriched GO biological Processes |
| Colorectum | AD |  |
| Colorectum | SER |  |
| Colorectum | MSS |  |
| Colorectum | MSI-H |  |
| Colorectum | FAP |  |
| ∗Top 15 enriched GO BP terms are showed in the bar plot of each disease state in each tissue. Each row represents a significant GO biological process which is colored according to the -log10(p.adjust). |
| Page: 1 2 3 4 5 6 7 8 9 |
| GO ID | Tissue | Disease Stage | Description | Gene Ratio | Bg Ratio | pvalue | p.adjust | Count |
| GO:00026837 | Cervix | CC | negative regulation of immune system process | 94/2311 | 434/18723 | 2.63e-08 | 1.87e-06 | 94 |
| GO:190370610 | Cervix | CC | regulation of hemopoiesis | 80/2311 | 367/18723 | 2.14e-07 | 9.55e-06 | 80 |
| GO:19021056 | Cervix | CC | regulation of leukocyte differentiation | 61/2311 | 279/18723 | 5.16e-06 | 1.29e-04 | 61 |
| GO:19021064 | Cervix | CC | negative regulation of leukocyte differentiation | 29/2311 | 102/18723 | 1.02e-05 | 2.29e-04 | 29 |
| GO:19037074 | Cervix | CC | negative regulation of hemopoiesis | 29/2311 | 106/18723 | 2.29e-05 | 4.01e-04 | 29 |
| GO:19031314 | Cervix | CC | mononuclear cell differentiation | 76/2311 | 426/18723 | 5.66e-04 | 5.42e-03 | 76 |
| GO:20011983 | Cervix | CC | regulation of dendritic cell differentiation | 6/2311 | 13/18723 | 2.78e-03 | 1.87e-02 | 6 |
| GO:190370613 | Cervix | HSIL_HPV | regulation of hemopoiesis | 35/737 | 367/18723 | 1.35e-06 | 6.21e-05 | 35 |
| GO:000268312 | Cervix | HSIL_HPV | negative regulation of immune system process | 39/737 | 434/18723 | 1.51e-06 | 6.60e-05 | 39 |
| GO:190210512 | Cervix | HSIL_HPV | regulation of leukocyte differentiation | 28/737 | 279/18723 | 5.84e-06 | 2.13e-04 | 28 |
| GO:190210612 | Cervix | HSIL_HPV | negative regulation of leukocyte differentiation | 11/737 | 102/18723 | 2.24e-03 | 2.26e-02 | 11 |
| GO:190370712 | Cervix | HSIL_HPV | negative regulation of hemopoiesis | 11/737 | 106/18723 | 3.04e-03 | 2.80e-02 | 11 |
| GO:190313112 | Cervix | HSIL_HPV | mononuclear cell differentiation | 29/737 | 426/18723 | 3.10e-03 | 2.84e-02 | 29 |
| GO:0007029 | Colorectum | AD | endoplasmic reticulum organization | 31/3918 | 87/18723 | 1.08e-03 | 1.00e-02 | 31 |
| GO:1903706 | Colorectum | AD | regulation of hemopoiesis | 99/3918 | 367/18723 | 3.08e-03 | 2.28e-02 | 99 |
| GO:0071786 | Colorectum | AD | endoplasmic reticulum tubular network organization | 9/3918 | 18/18723 | 5.82e-03 | 3.67e-02 | 9 |
| GO:00070291 | Colorectum | SER | endoplasmic reticulum organization | 23/2897 | 87/18723 | 5.77e-03 | 4.23e-02 | 23 |
| GO:19037061 | Colorectum | MSS | regulation of hemopoiesis | 89/3467 | 367/18723 | 3.39e-03 | 2.56e-02 | 89 |
| GO:1903131 | Colorectum | FAP | mononuclear cell differentiation | 79/2622 | 426/18723 | 5.00e-03 | 3.33e-02 | 79 |
| GO:19037063 | Colorectum | FAP | regulation of hemopoiesis | 69/2622 | 367/18723 | 6.01e-03 | 3.78e-02 | 69 |
| Page: 1 2 3 4 5 6 |
| Pathway ID | Tissue | Disease Stage | Description | Gene Ratio | Bg Ratio | pvalue | p.adjust | qvalue | Count |
| Page: 1 |
Top |
Cell-cell communication analysis |
| Identification of potential cell-cell interactions between two cell types and their ligand-receptor pairs for different disease states |
| Ligand | Receptor | LRpair | Pathway | Tissue | Disease Stage |
| Page: 1 |
Top |
Single-cell gene regulatory network inference analysis |
| Find out the significant the regulons (TFs) and the target genes of each regulon across cell types for different disease states |
| TF | Cell Type | Tissue | Disease Stage | Target Gene | RSS | Regulon Activity |
| ∗The dot plots of a searched regulon are shown for all cell subpopulations in each disease state of each tissue based on the regulon specific score inferred using pySCENIC and by calculating the average expression. |
| Page: 1 |
Top |
Somatic mutation of malignant transformation related genes |
| Annotation of somatic variants for genes involved in malignant transformation |
| Hugo Symbol | Variant Class | Variant Classification | dbSNP RS | HGVSc | HGVSp | HGVSp Short | SWISSPROT | BIOTYPE | SIFT | PolyPhen | Tumor Sample Barcode | Tissue | Histology | Sex | Age | Stage | Therapy Types | Drugs | Outcome |
| TMEM17 | SNV | Missense_Mutation | rs150884514 | c.47G>A | p.Arg16Gln | p.R16Q | Q86X19 | protein_coding | tolerated(0.56) | possibly_damaging(0.462) | TCGA-AR-A0TX-01 | Breast | breast invasive carcinoma | Female | <65 | I/II | Unknown | Unknown | SD |
| TMEM17 | SNV | Missense_Mutation | c.394N>A | p.Glu132Lys | p.E132K | Q86X19 | protein_coding | deleterious(0.03) | benign(0.272) | TCGA-D8-A1JA-01 | Breast | breast invasive carcinoma | Female | <65 | III/IV | Chemotherapy | adriamycin | PD | |
| TMEM17 | SNV | Missense_Mutation | rs763067703 | c.376N>A | p.Leu126Ile | p.L126I | Q86X19 | protein_coding | tolerated(0.08) | probably_damaging(0.998) | TCGA-AA-A010-01 | Colorectum | colon adenocarcinoma | Female | <65 | I/II | Chemotherapy | folinic | CR |
| TMEM17 | SNV | Missense_Mutation | rs561991904 | c.515G>A | p.Arg172His | p.R172H | Q86X19 | protein_coding | tolerated(0.37) | benign(0) | TCGA-AU-6004-01 | Colorectum | colon adenocarcinoma | Female | >=65 | I/II | Unknown | Unknown | SD |
| TMEM17 | SNV | Missense_Mutation | novel | c.563N>C | p.Met188Thr | p.M188T | Q86X19 | protein_coding | tolerated_low_confidence(0.61) | benign(0.001) | TCGA-AJ-A3NE-01 | Endometrium | uterine corpus endometrioid carcinoma | Female | <65 | I/II | Unknown | Unknown | SD |
| TMEM17 | SNV | Missense_Mutation | novel | c.425C>T | p.Ala142Val | p.A142V | Q86X19 | protein_coding | deleterious(0.02) | possibly_damaging(0.878) | TCGA-AX-A0J1-01 | Endometrium | uterine corpus endometrioid carcinoma | Female | >=65 | I/II | Unknown | Unknown | SD |
| TMEM17 | SNV | Missense_Mutation | novel | c.39C>A | p.Asn13Lys | p.N13K | Q86X19 | protein_coding | tolerated(0.15) | benign(0.245) | TCGA-B5-A0JZ-01 | Endometrium | uterine corpus endometrioid carcinoma | Female | <65 | III/IV | Chemotherapy | carboplatin | PD |
| TMEM17 | SNV | Missense_Mutation | rs150163358 | c.539N>A | p.Arg180Gln | p.R180Q | Q86X19 | protein_coding | tolerated(0.6) | benign(0) | TCGA-B5-A11E-01 | Endometrium | uterine corpus endometrioid carcinoma | Female | <65 | I/II | Unknown | Unknown | SD |
| TMEM17 | SNV | Missense_Mutation | novel | c.575N>A | p.Arg192Lys | p.R192K | Q86X19 | protein_coding | tolerated_low_confidence(0.25) | benign(0.142) | TCGA-B5-A3FC-01 | Endometrium | uterine corpus endometrioid carcinoma | Female | <65 | I/II | Unknown | Unknown | SD |
| TMEM17 | SNV | Missense_Mutation | novel | c.562N>G | p.Met188Val | p.M188V | Q86X19 | protein_coding | tolerated_low_confidence(0.66) | benign(0) | TCGA-EY-A1G8-01 | Endometrium | uterine corpus endometrioid carcinoma | Female | >=65 | I/II | Unknown | Unknown | SD |
| Page: 1 2 |
Top |
Related drugs of malignant transformation related genes |
| Identification of chemicals and drugs interact with genes involved in malignant transfromation |
| (DGIdb 4.0) |
| Entrez ID | Symbol | Category | Interaction Types | Drug Claim Name | Drug Name | PMIDs |
| Page: 1 |

Copyright 2023-Present -The University of Texas Health Science Center at Houston |