
|
|||||
|
 | |
| |
| |
| |
| |
| |
|
Gene: TMEM167A |
Gene summary for TMEM167A |
| Gene information | Species | Human | Gene symbol | TMEM167A | Gene ID | 153339 |
| Gene name | transmembrane protein 167A | |
| Gene Alias | TMEM167 | |
| Cytomap | 5q14.2 | |
| Gene Type | protein-coding | GO ID | GO:0006810 | UniProtAcc | Q8TBQ9 |
Top |
Malignant transformation analysis |
| Identification of the aberrant gene expression in precancerous and cancerous lesions by comparing the gene expression of stem-like cells in diseased tissues with normal stem cells |
| Entrez ID | Symbol | Replicates | Species | Organ | Tissue | Adj P-value | Log2FC | Malignancy |
| 153339 | TMEM167A | GSM4909281 | Human | Breast | IDC | 1.53e-04 | 3.64e-01 | 0.21 |
| 153339 | TMEM167A | GSM4909285 | Human | Breast | IDC | 5.72e-29 | 6.45e-01 | 0.21 |
| 153339 | TMEM167A | GSM4909290 | Human | Breast | IDC | 2.94e-07 | 4.67e-01 | 0.2096 |
| 153339 | TMEM167A | GSM4909293 | Human | Breast | IDC | 9.60e-08 | 3.75e-01 | 0.1581 |
| 153339 | TMEM167A | GSM4909296 | Human | Breast | IDC | 4.26e-05 | 1.08e-02 | 0.1524 |
| 153339 | TMEM167A | GSM4909297 | Human | Breast | IDC | 2.20e-10 | -1.67e-01 | 0.1517 |
| 153339 | TMEM167A | GSM4909308 | Human | Breast | IDC | 2.21e-08 | 4.08e-01 | 0.158 |
| 153339 | TMEM167A | GSM4909311 | Human | Breast | IDC | 3.80e-22 | -2.52e-01 | 0.1534 |
| 153339 | TMEM167A | GSM4909312 | Human | Breast | IDC | 5.22e-09 | 1.14e-03 | 0.1552 |
| 153339 | TMEM167A | GSM4909315 | Human | Breast | IDC | 6.70e-03 | 3.15e-01 | 0.21 |
| 153339 | TMEM167A | GSM4909319 | Human | Breast | IDC | 1.10e-24 | -2.20e-01 | 0.1563 |
| 153339 | TMEM167A | GSM4909320 | Human | Breast | IDC | 2.37e-03 | -1.69e-01 | 0.1575 |
| 153339 | TMEM167A | GSM4909321 | Human | Breast | IDC | 1.06e-07 | 5.62e-03 | 0.1559 |
| 153339 | TMEM167A | brca2 | Human | Breast | Precancer | 5.42e-04 | 2.62e-01 | -0.024 |
| 153339 | TMEM167A | NCCBC14 | Human | Breast | DCIS | 2.80e-03 | -1.14e-01 | 0.2021 |
| 153339 | TMEM167A | NCCBC5 | Human | Breast | DCIS | 2.67e-03 | -1.33e-02 | 0.2046 |
| 153339 | TMEM167A | P1 | Human | Breast | IDC | 2.22e-07 | -1.47e-01 | 0.1527 |
| 153339 | TMEM167A | P3 | Human | Breast | IDC | 2.00e-10 | 7.68e-01 | 0.1542 |
| 153339 | TMEM167A | DCIS2 | Human | Breast | DCIS | 7.05e-54 | 1.31e-01 | 0.0085 |
| 153339 | TMEM167A | AEH-subject1 | Human | Endometrium | AEH | 3.13e-04 | -2.29e-01 | -0.3059 |
| Page: 1 2 3 4 5 6 7 8 9 |
| Tissue | Expression Dynamics | Abbreviation |
| Breast |  | IDC: Invasive ductal carcinoma |
| DCIS: Ductal carcinoma in situ | ||
| Precancer(BRCA1-mut): Precancerous lesion from BRCA1 mutation carriers | ||
| Endometrium | 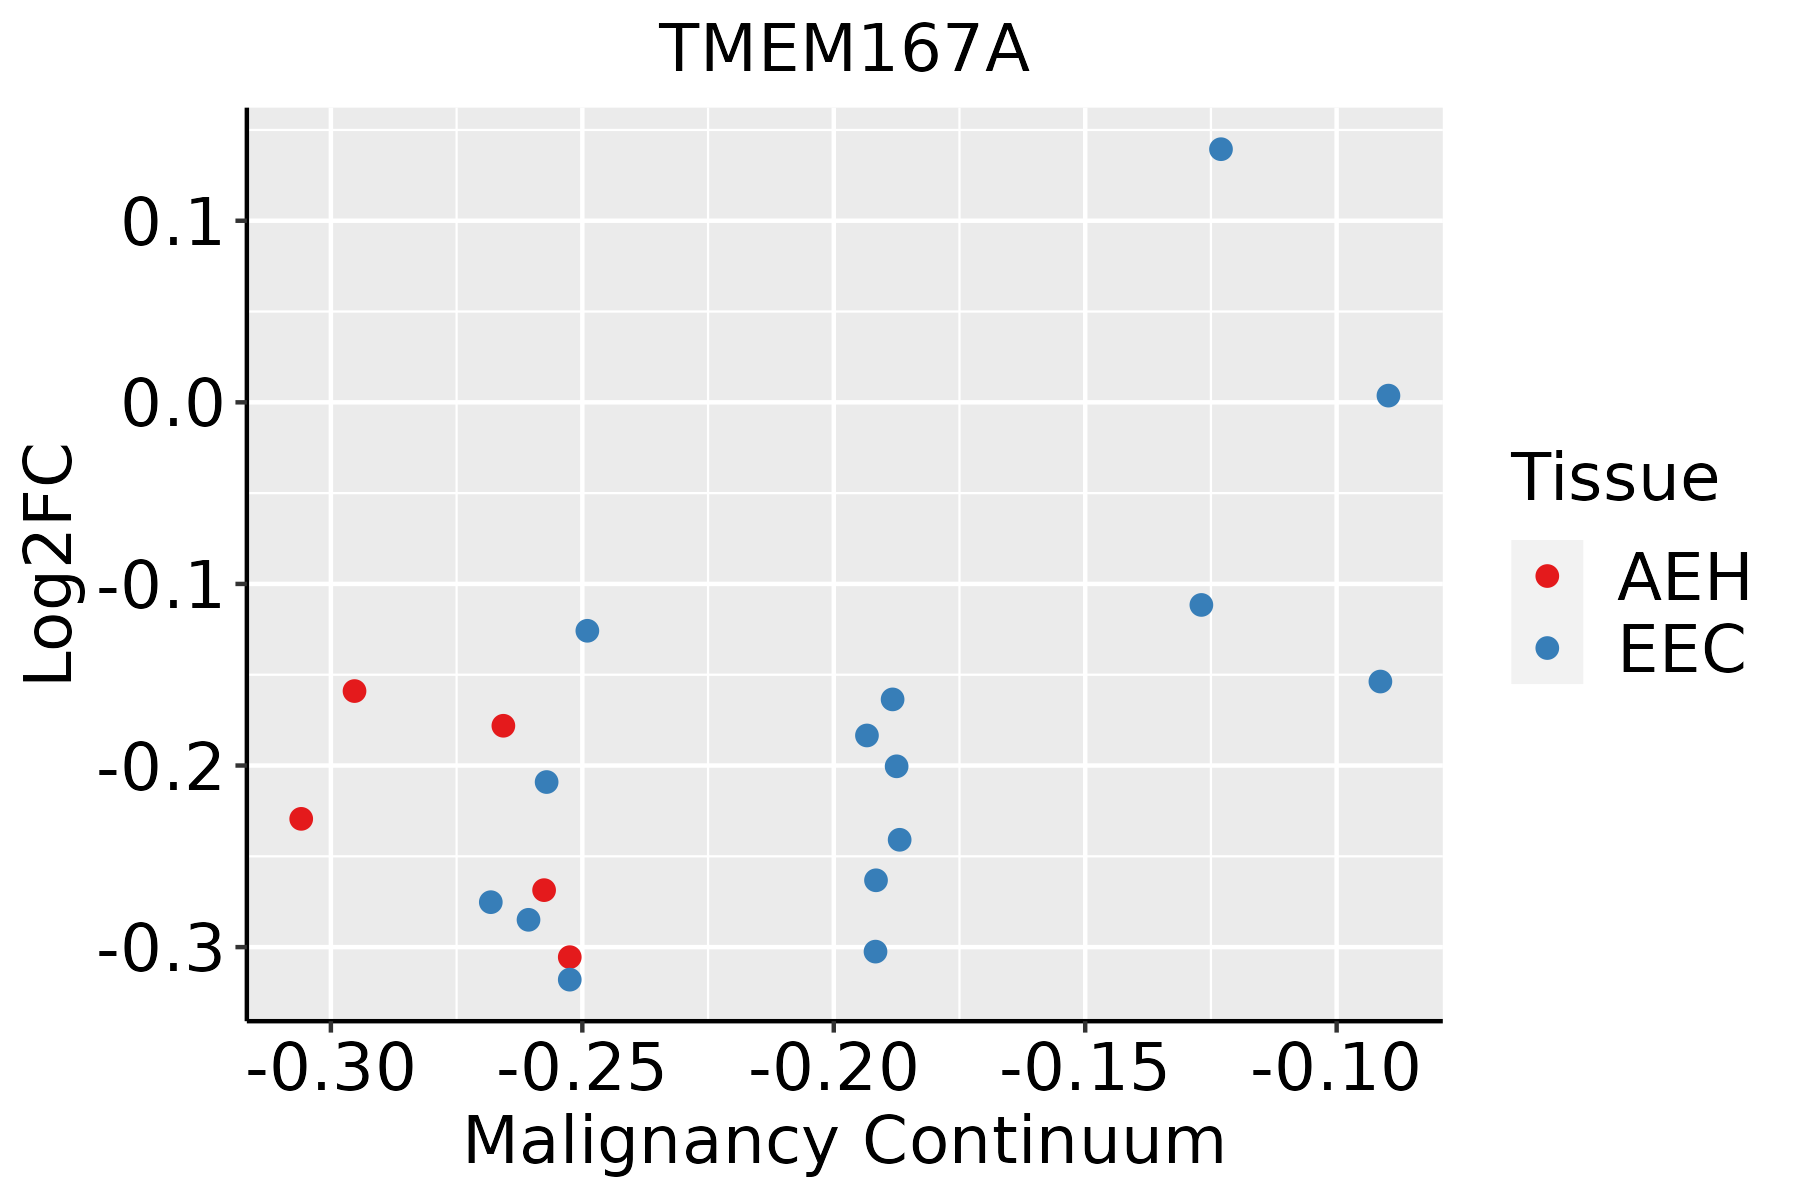 | AEH: Atypical endometrial hyperplasia |
| EEC: Endometrioid Cancer | ||
| Esophagus | 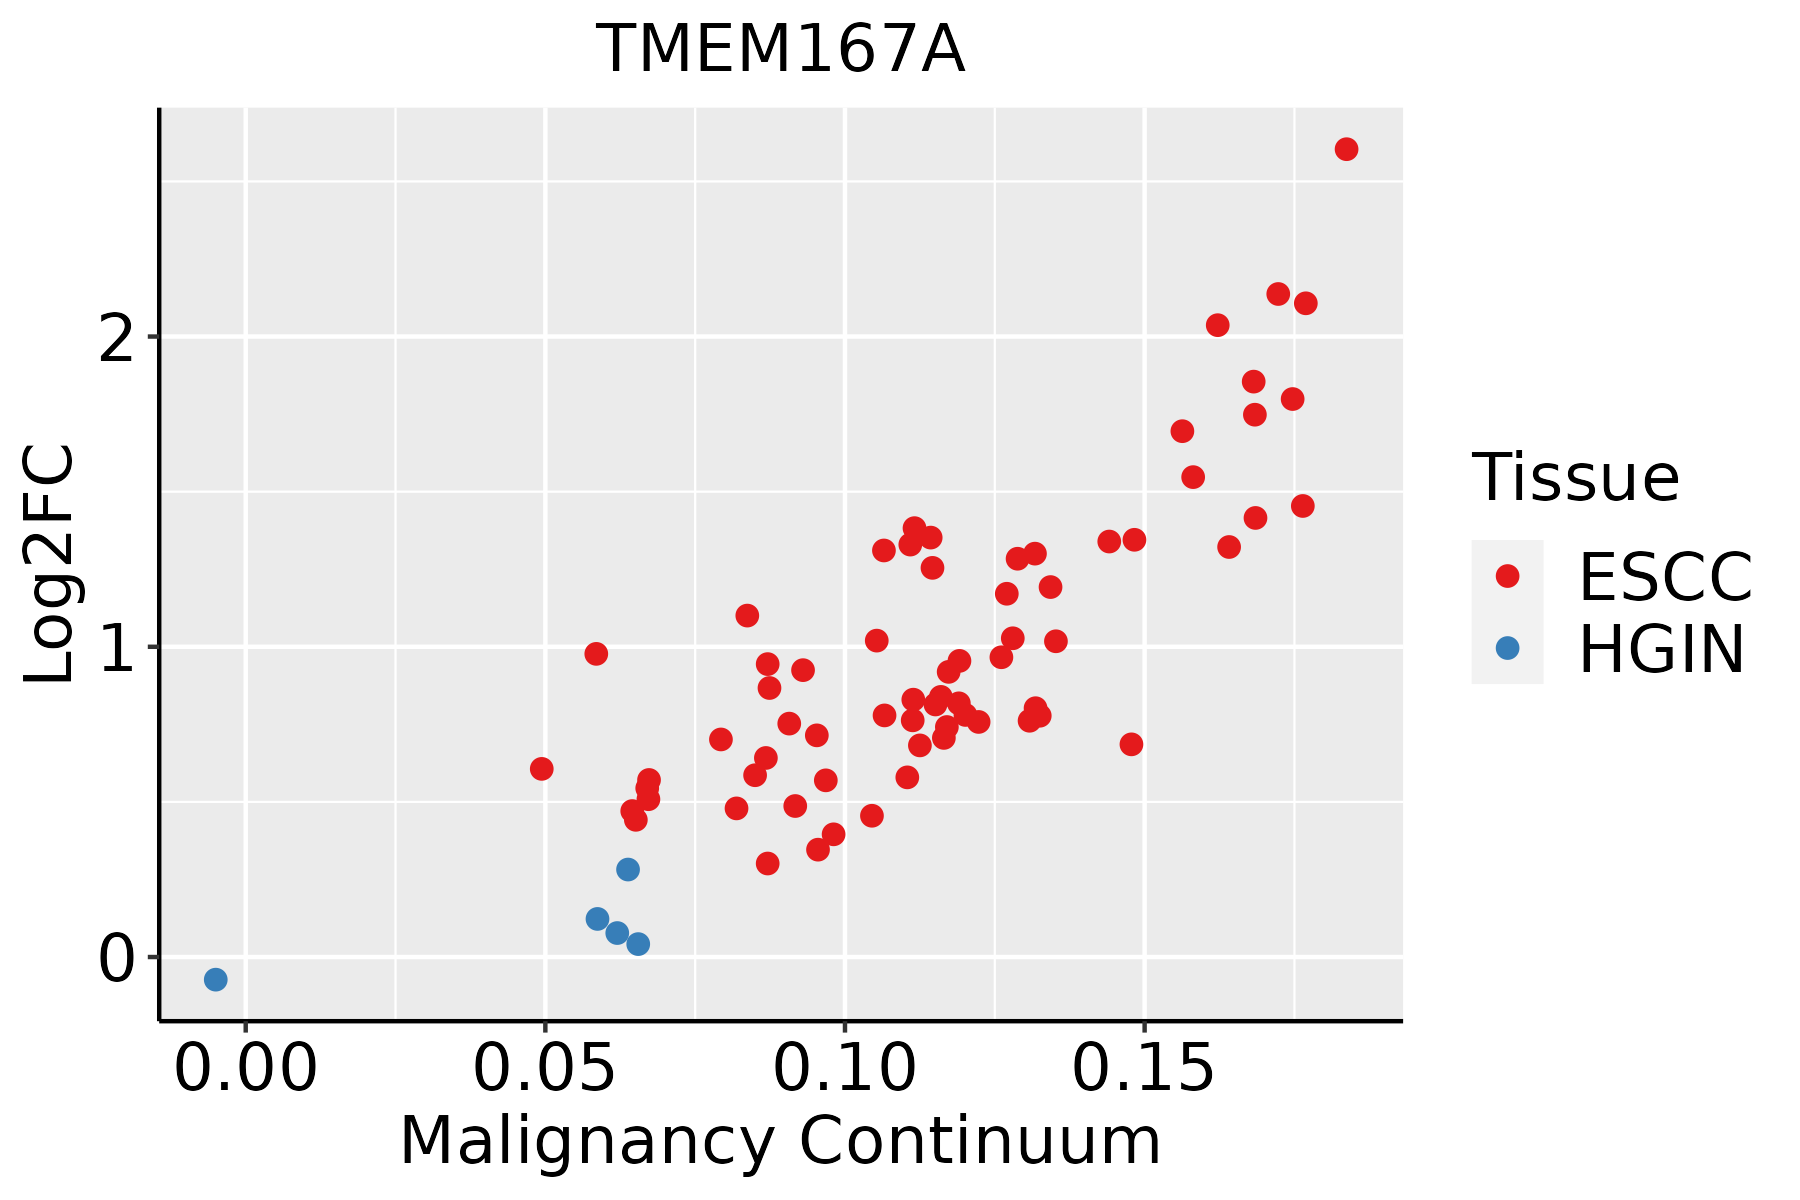 | ESCC: Esophageal squamous cell carcinoma |
| HGIN: High-grade intraepithelial neoplasias | ||
| LGIN: Low-grade intraepithelial neoplasias | ||
| Liver | 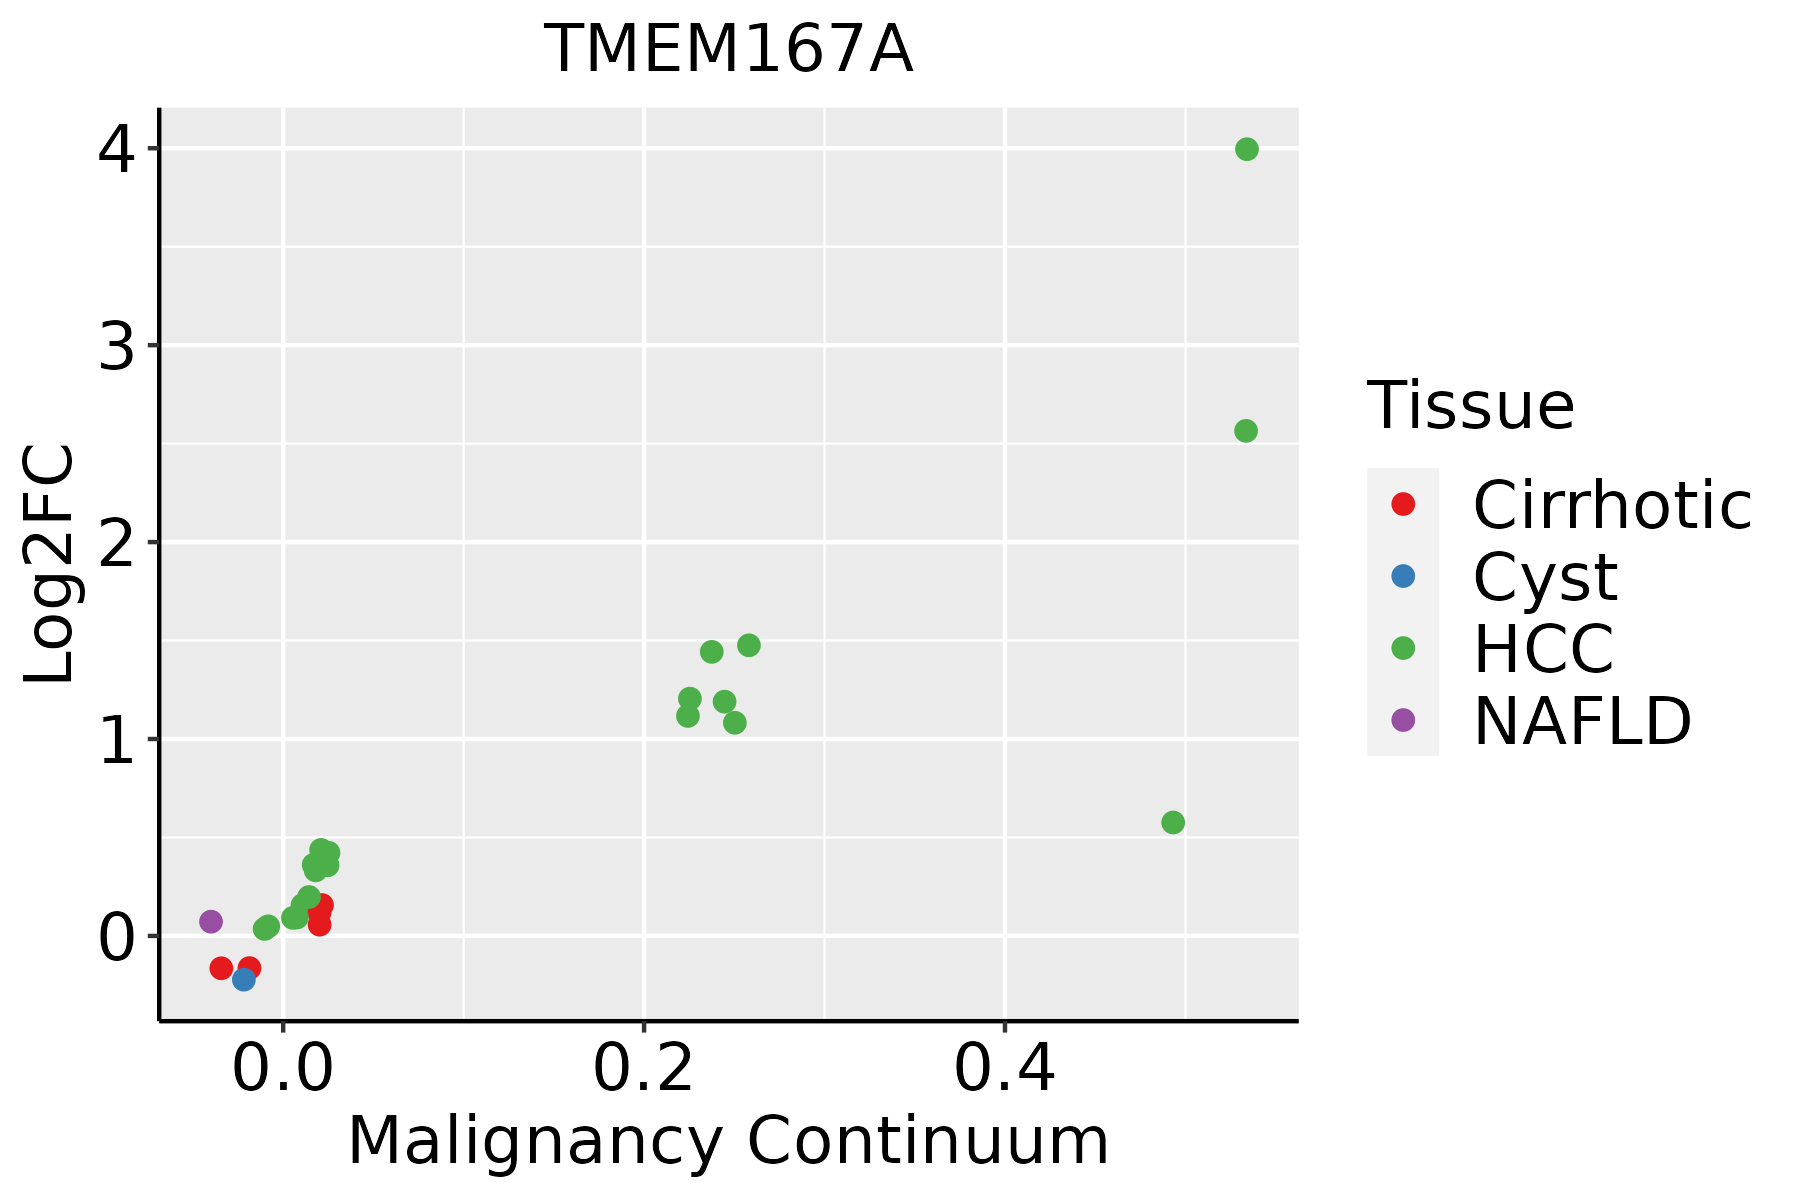 | HCC: Hepatocellular carcinoma |
| NAFLD: Non-alcoholic fatty liver disease | ||
| Oral Cavity | 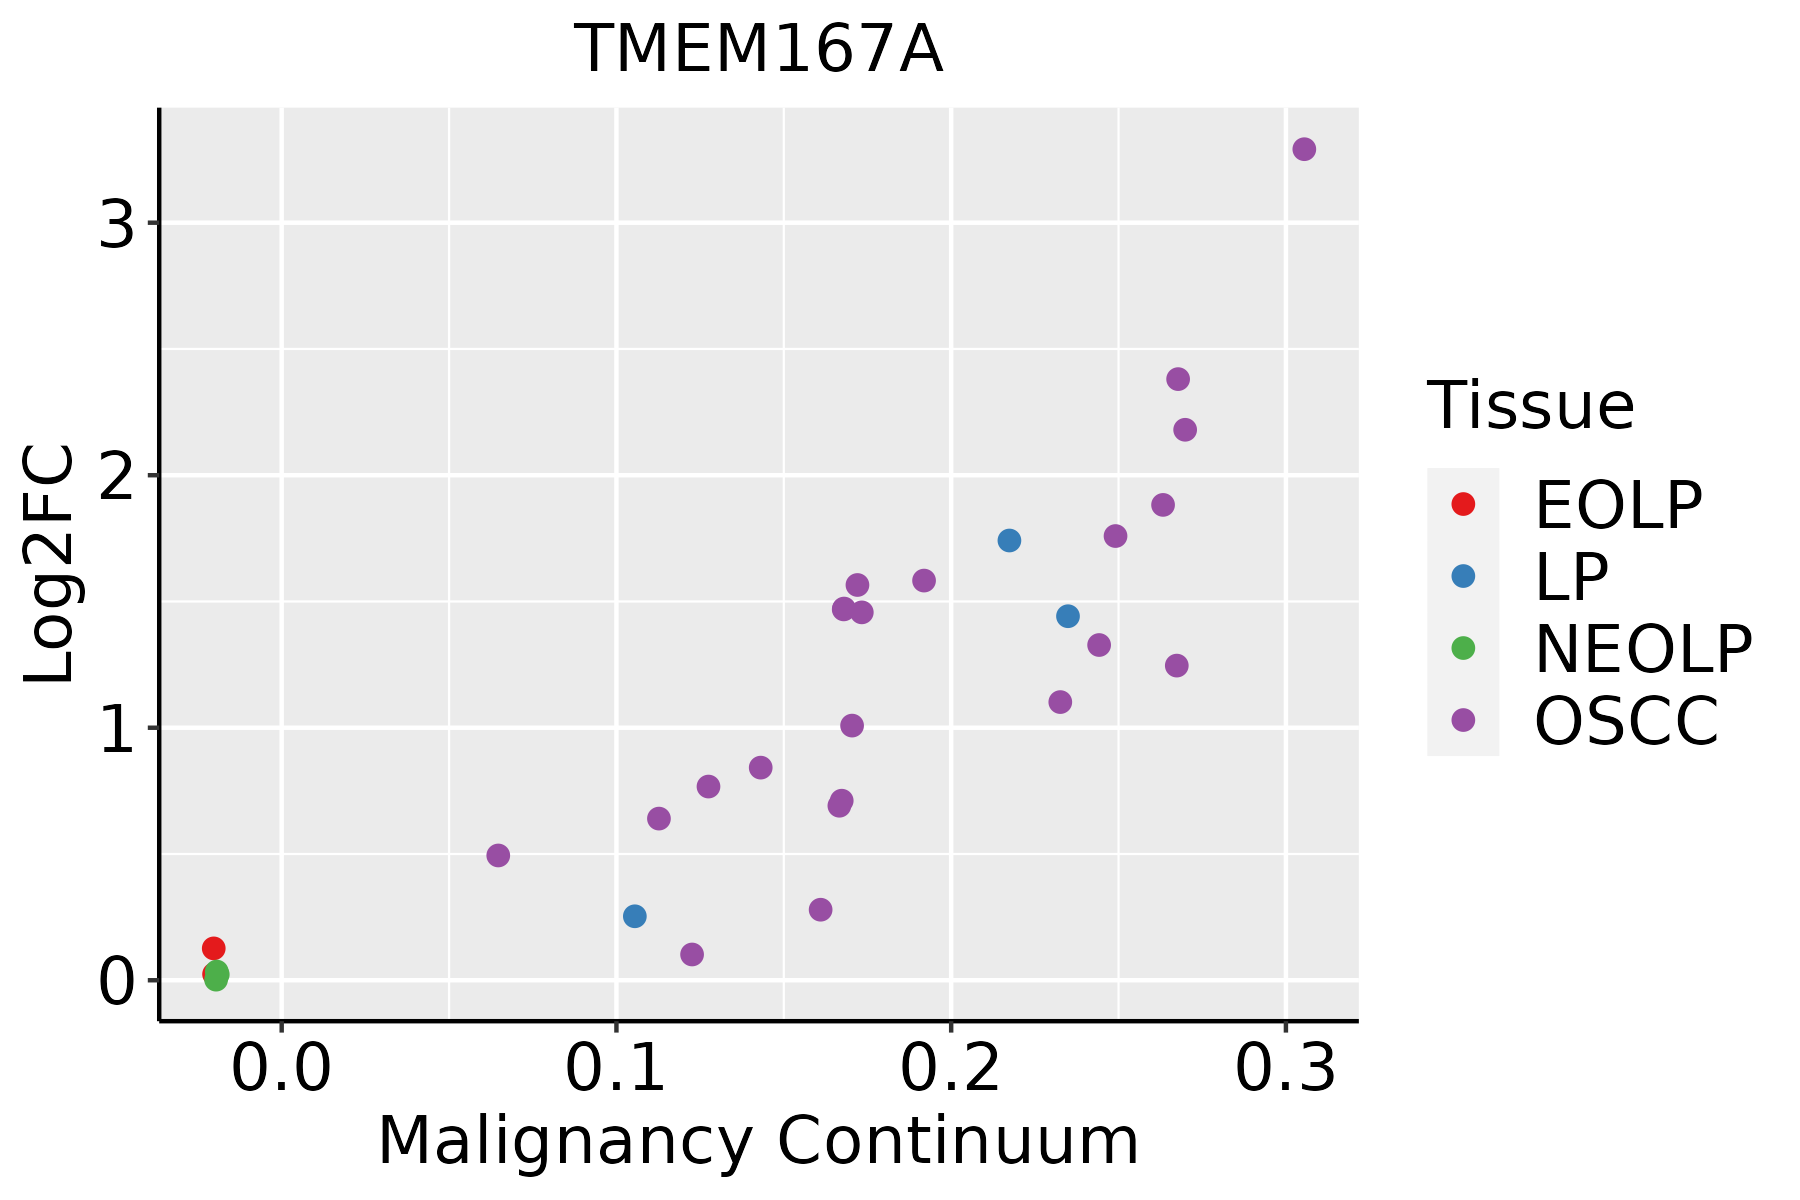 | EOLP: Erosive Oral lichen planus |
| LP: leukoplakia | ||
| NEOLP: Non-erosive oral lichen planus | ||
| OSCC: Oral squamous cell carcinoma | ||
| Skin | 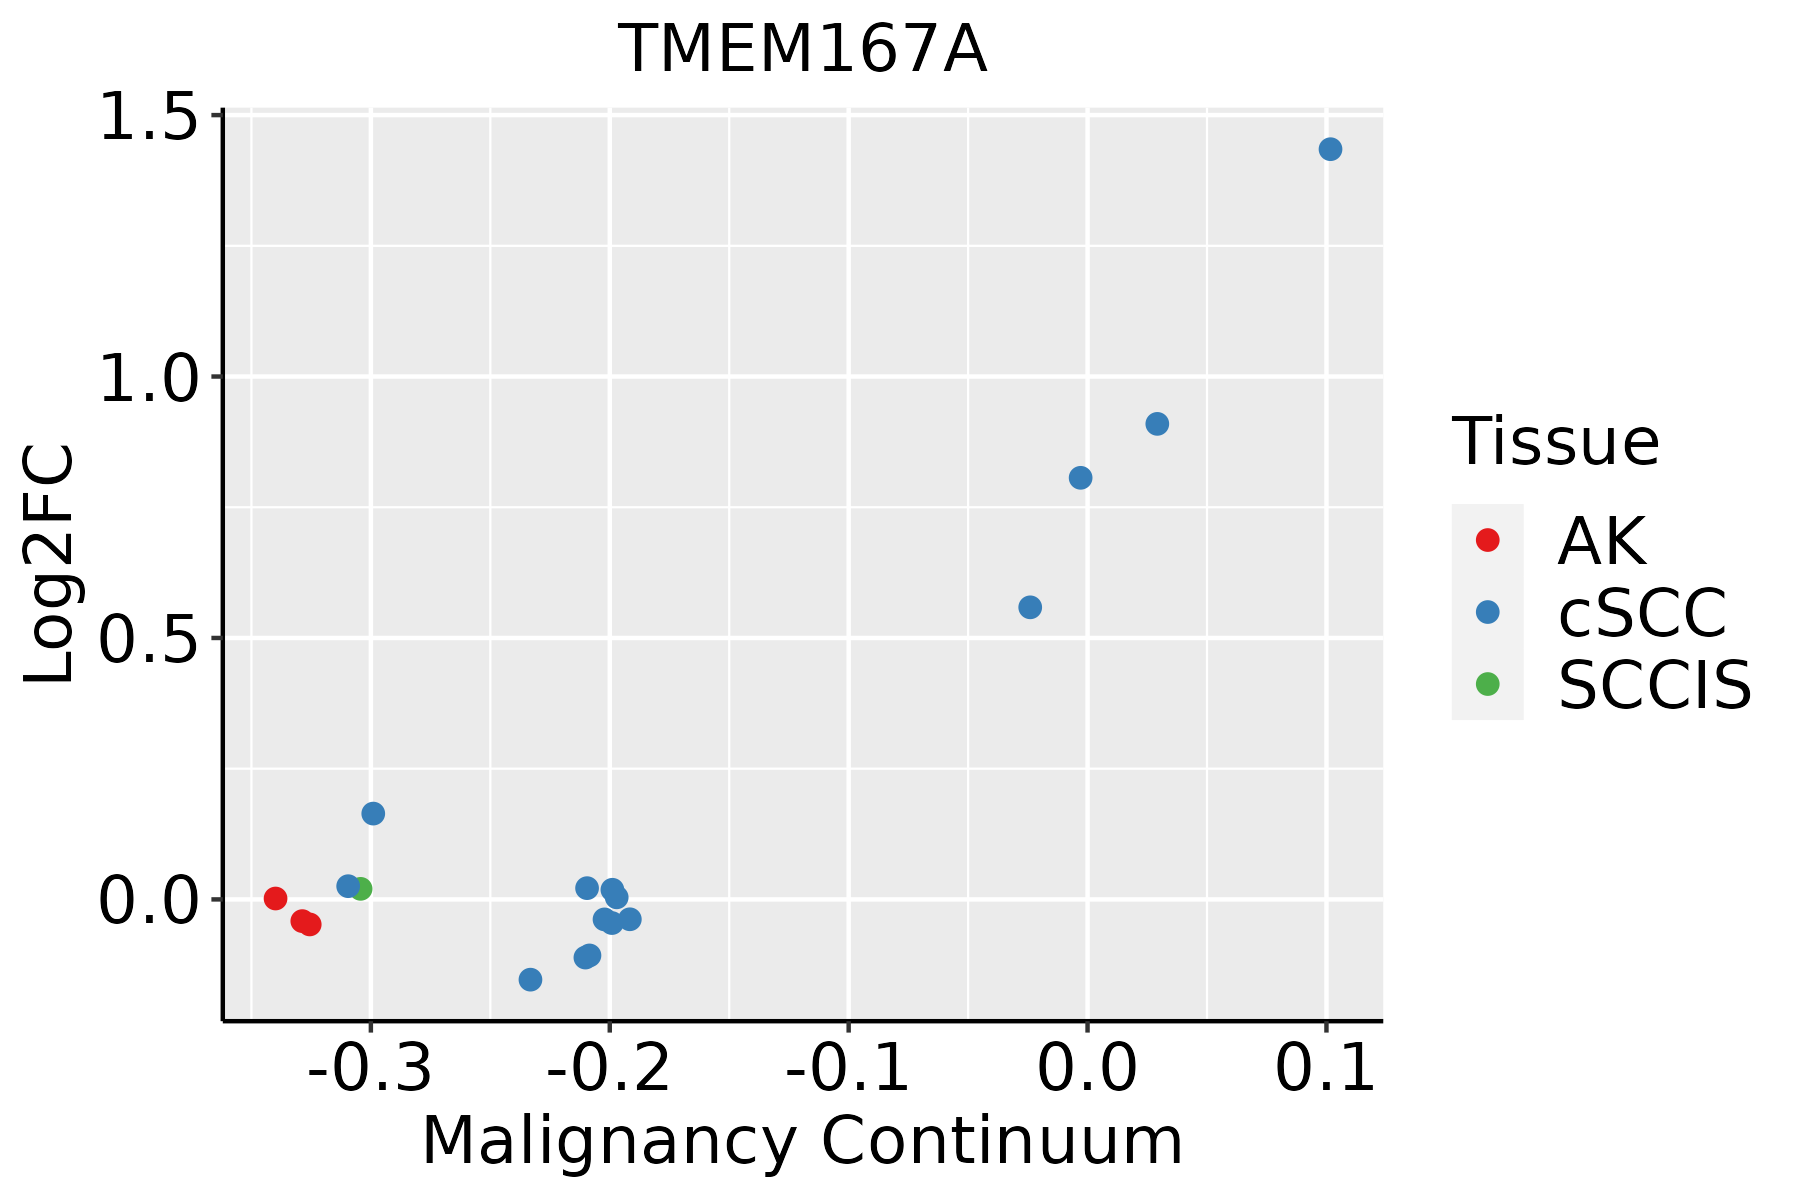 | AK: Actinic keratosis |
| cSCC: Cutaneous squamous cell carcinoma | ||
| SCCIS:squamous cell carcinoma in situ | ||
| Thyroid | 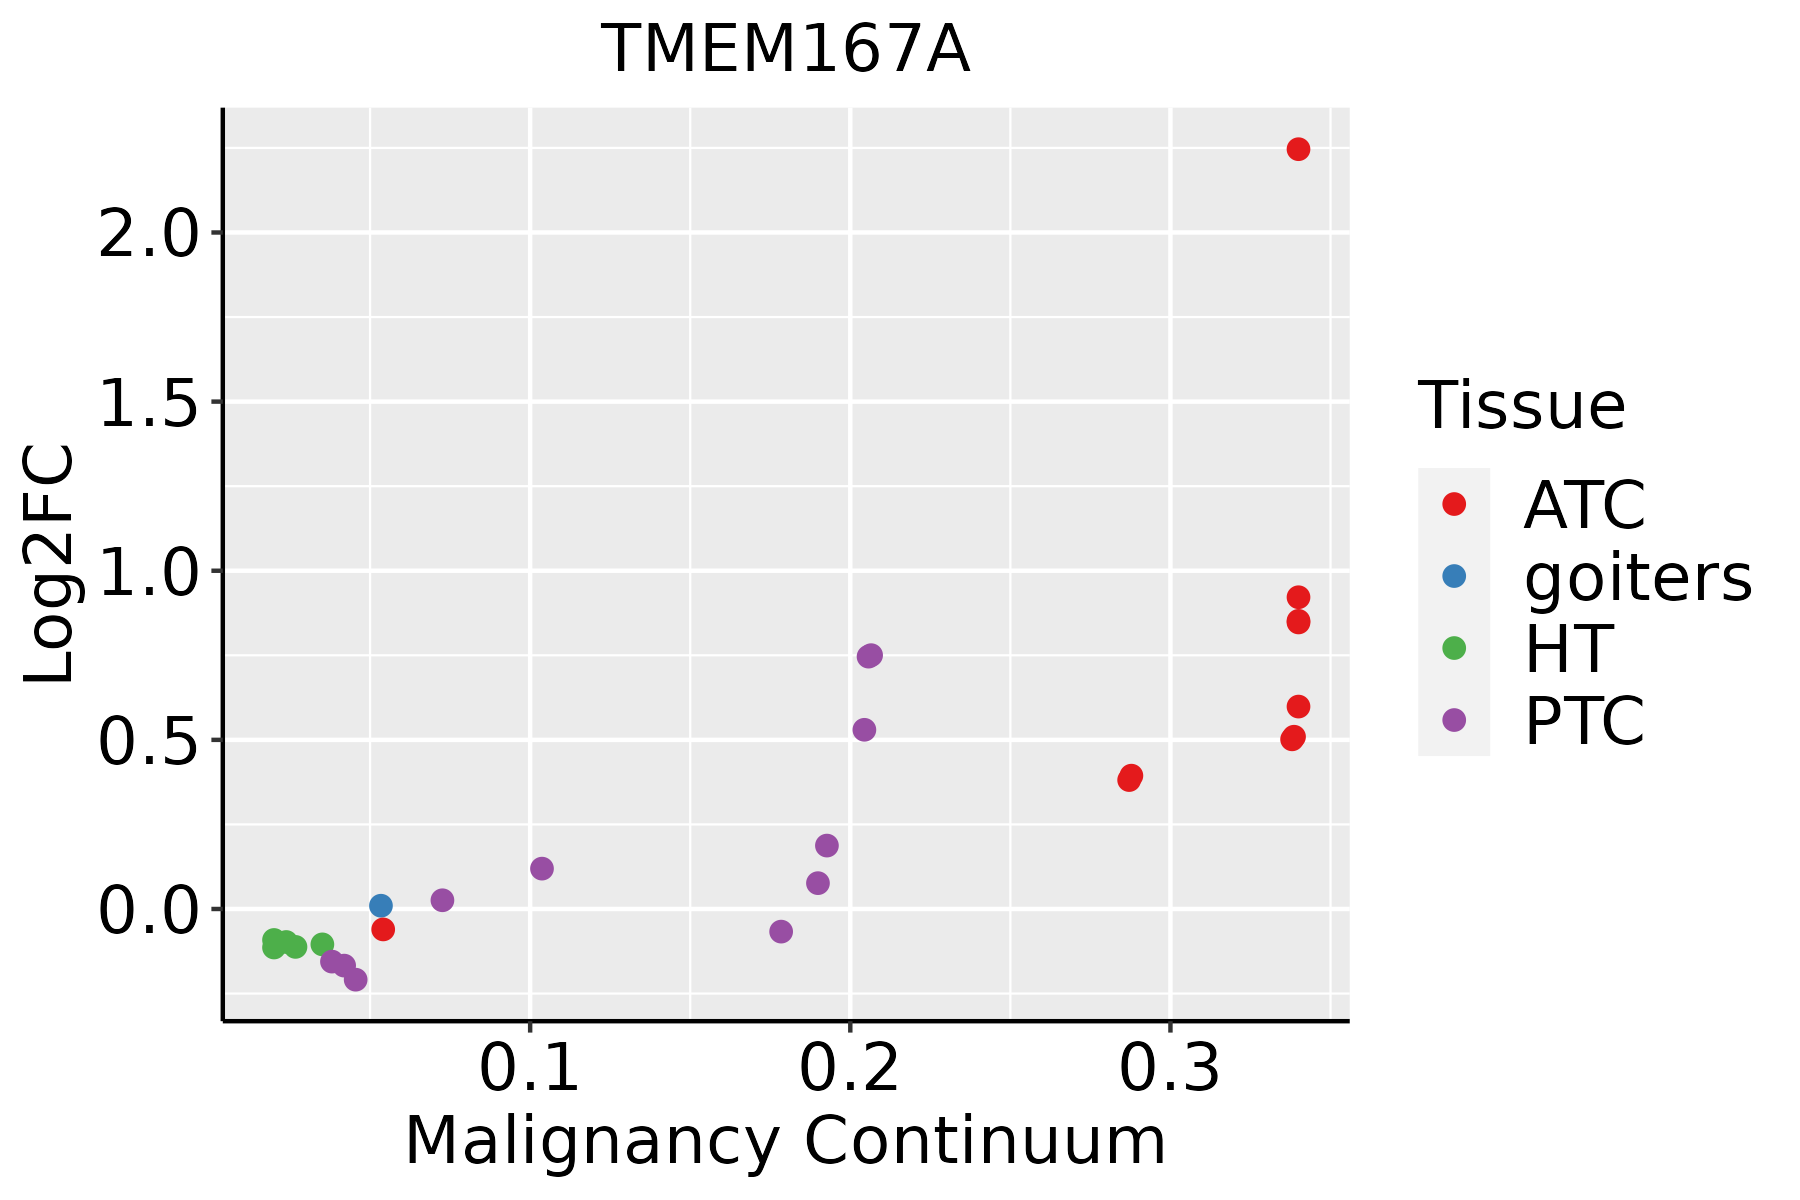 | ATC: Anaplastic thyroid cancer |
| HT: Hashimoto's thyroiditis | ||
| PTC: Papillary thyroid cancer |
| ∗log2FC in expression of this searched gene in stem-like cells from each diseased tissue sample relative to stem-like cells in normal samples in each tissue plotted against the malignancy continuum. Samples are colored based on if they are from different disease stage. |
Top |
Malignant transformation related pathway analysis |
| Find out the enriched GO biological processes and KEGG pathways involved in transition from healthy to precancer to cancer |
| Tissue | Disease Stage | Enriched GO biological Processes |
| Colorectum | AD |  |
| Colorectum | SER |  |
| Colorectum | MSS |  |
| Colorectum | MSI-H |  |
| Colorectum | FAP |  |
| ∗Top 15 enriched GO BP terms are showed in the bar plot of each disease state in each tissue. Each row represents a significant GO biological process which is colored according to the -log10(p.adjust). |
| Page: 1 2 3 4 5 6 7 8 9 |
| GO ID | Tissue | Disease Stage | Description | Gene Ratio | Bg Ratio | pvalue | p.adjust | Count |
| GO:00716926 | Breast | Precancer | protein localization to extracellular region | 34/1080 | 368/18723 | 4.65e-03 | 3.58e-02 | 34 |
| GO:00093067 | Breast | Precancer | protein secretion | 33/1080 | 359/18723 | 5.65e-03 | 4.08e-02 | 33 |
| GO:00355927 | Breast | Precancer | establishment of protein localization to extracellular region | 33/1080 | 360/18723 | 5.89e-03 | 4.21e-02 | 33 |
| GO:007169212 | Breast | IDC | protein localization to extracellular region | 42/1434 | 368/18723 | 6.13e-03 | 4.38e-02 | 42 |
| GO:000930613 | Breast | IDC | protein secretion | 41/1434 | 359/18723 | 6.64e-03 | 4.63e-02 | 41 |
| GO:003559213 | Breast | IDC | establishment of protein localization to extracellular region | 41/1434 | 360/18723 | 6.96e-03 | 4.81e-02 | 41 |
| GO:007169222 | Breast | DCIS | protein localization to extracellular region | 41/1390 | 368/18723 | 6.01e-03 | 4.29e-02 | 41 |
| GO:000930622 | Breast | DCIS | protein secretion | 40/1390 | 359/18723 | 6.59e-03 | 4.61e-02 | 40 |
| GO:003559222 | Breast | DCIS | establishment of protein localization to extracellular region | 40/1390 | 360/18723 | 6.90e-03 | 4.77e-02 | 40 |
| GO:00716927 | Endometrium | AEH | protein localization to extracellular region | 58/2100 | 368/18723 | 4.72e-03 | 3.00e-02 | 58 |
| GO:00093068 | Endometrium | AEH | protein secretion | 56/2100 | 359/18723 | 6.71e-03 | 3.94e-02 | 56 |
| GO:00355928 | Endometrium | AEH | establishment of protein localization to extracellular region | 56/2100 | 360/18723 | 7.10e-03 | 4.09e-02 | 56 |
| GO:007169213 | Endometrium | EEC | protein localization to extracellular region | 59/2168 | 368/18723 | 5.98e-03 | 3.56e-02 | 59 |
| GO:000930614 | Endometrium | EEC | protein secretion | 57/2168 | 359/18723 | 8.30e-03 | 4.57e-02 | 57 |
| GO:003559214 | Endometrium | EEC | establishment of protein localization to extracellular region | 57/2168 | 360/18723 | 8.78e-03 | 4.74e-02 | 57 |
| GO:000930617 | Esophagus | ESCC | protein secretion | 190/8552 | 359/18723 | 3.22e-03 | 1.34e-02 | 190 |
| GO:003559217 | Esophagus | ESCC | establishment of protein localization to extracellular region | 190/8552 | 360/18723 | 3.77e-03 | 1.53e-02 | 190 |
| GO:007169210 | Esophagus | ESCC | protein localization to extracellular region | 193/8552 | 368/18723 | 5.01e-03 | 1.92e-02 | 193 |
| GO:003559212 | Liver | HCC | establishment of protein localization to extracellular region | 176/7958 | 360/18723 | 7.96e-03 | 3.15e-02 | 176 |
| GO:000930612 | Liver | HCC | protein secretion | 175/7958 | 359/18723 | 9.32e-03 | 3.57e-02 | 175 |
| Page: 1 2 |
| Pathway ID | Tissue | Disease Stage | Description | Gene Ratio | Bg Ratio | pvalue | p.adjust | qvalue | Count |
| Page: 1 |
Top |
Cell-cell communication analysis |
| Identification of potential cell-cell interactions between two cell types and their ligand-receptor pairs for different disease states |
| Ligand | Receptor | LRpair | Pathway | Tissue | Disease Stage |
| Page: 1 |
Top |
Single-cell gene regulatory network inference analysis |
| Find out the significant the regulons (TFs) and the target genes of each regulon across cell types for different disease states |
| TF | Cell Type | Tissue | Disease Stage | Target Gene | RSS | Regulon Activity |
| ∗The dot plots of a searched regulon are shown for all cell subpopulations in each disease state of each tissue based on the regulon specific score inferred using pySCENIC and by calculating the average expression. |
| Page: 1 |
Top |
Somatic mutation of malignant transformation related genes |
| Annotation of somatic variants for genes involved in malignant transformation |
| Hugo Symbol | Variant Class | Variant Classification | dbSNP RS | HGVSc | HGVSp | HGVSp Short | SWISSPROT | BIOTYPE | SIFT | PolyPhen | Tumor Sample Barcode | Tissue | Histology | Sex | Age | Stage | Therapy Types | Drugs | Outcome |
| TMEM167A | SNV | Missense_Mutation | c.175G>A | p.Val59Ile | p.V59I | Q8TBQ9 | protein_coding | tolerated(0.76) | benign(0) | TCGA-BH-A0E1-01 | Breast | breast invasive carcinoma | Female | <65 | I/II | Chemotherapy | cytoxan | SD | |
| TMEM167A | SNV | Missense_Mutation | c.33N>C | p.Leu11Phe | p.L11F | Q8TBQ9 | protein_coding | deleterious(0.03) | probably_damaging(0.991) | TCGA-C8-A1HM-01 | Breast | breast invasive carcinoma | Female | >=65 | I/II | Chemotherapy | doxorubicin | CR | |
| TMEM167A | SNV | Missense_Mutation | c.143N>A | p.Arg48Lys | p.R48K | Q8TBQ9 | protein_coding | tolerated(0.06) | benign(0.358) | TCGA-JW-A5VL-01 | Cervix | cervical & endocervical cancer | Female | <65 | I/II | Unknown | Unknown | SD | |
| TMEM167A | SNV | Missense_Mutation | c.187G>C | p.Val63Leu | p.V63L | Q8TBQ9 | protein_coding | tolerated(0.33) | benign(0) | TCGA-AD-6895-01 | Colorectum | colon adenocarcinoma | Male | >=65 | III/IV | Unknown | Unknown | SD | |
| TMEM167A | SNV | Missense_Mutation | novel | c.18N>G | p.Asn6Lys | p.N6K | Q8TBQ9 | protein_coding | deleterious(0.04) | possibly_damaging(0.703) | TCGA-CA-6717-01 | Colorectum | colon adenocarcinoma | Male | <65 | I/II | Chemotherapy | oxaliplatin | CR |
| TMEM167A | SNV | Missense_Mutation | novel | c.34N>T | p.Thr12Ser | p.T12S | Q8TBQ9 | protein_coding | tolerated(0.25) | benign(0.007) | TCGA-DM-A282-01 | Colorectum | colon adenocarcinoma | Female | <65 | I/II | Unknown | Unknown | SD |
| TMEM167A | SNV | Missense_Mutation | c.143N>T | p.Arg48Ile | p.R48I | Q8TBQ9 | protein_coding | tolerated(0.05) | benign(0.105) | TCGA-AJ-A3EL-01 | Endometrium | uterine corpus endometrioid carcinoma | Female | <65 | I/II | Unknown | Unknown | SD | |
| TMEM167A | SNV | Missense_Mutation | novel | c.92N>C | p.Leu31Pro | p.L31P | Q8TBQ9 | protein_coding | deleterious(0) | possibly_damaging(0.908) | TCGA-FI-A2D5-01 | Endometrium | uterine corpus endometrioid carcinoma | Female | <65 | III/IV | Chemotherapy | carboplatinum | PD |
| TMEM167A | SNV | Missense_Mutation | rs868081483 | c.139N>T | p.Ala47Ser | p.A47S | Q8TBQ9 | protein_coding | tolerated(0.14) | benign(0.034) | TCGA-SL-A6J9-01 | Endometrium | uterine corpus endometrioid carcinoma | Female | >=65 | I/II | Unknown | Unknown | SD |
| TMEM167A | SNV | Missense_Mutation | novel | c.214N>A | p.Gln72Lys | p.Q72K | Q8TBQ9 | protein_coding | tolerated(0.09) | benign(0.012) | TCGA-NC-A5HN-01 | Lung | lung squamous cell carcinoma | Male | >=65 | I/II | Unknown | Unknown | SD |
| Page: 1 2 |
Top |
Related drugs of malignant transformation related genes |
| Identification of chemicals and drugs interact with genes involved in malignant transfromation |
| (DGIdb 4.0) |
| Entrez ID | Symbol | Category | Interaction Types | Drug Claim Name | Drug Name | PMIDs |
| 153339 | TMEM167A | NA | fluorouracil | FLUOROURACIL | 28796378 | |
| 153339 | TMEM167A | NA | radiotherapy | 28796378 | ||
| 153339 | TMEM167A | NA | Platinum compounds | 28796378 |
| Page: 1 |

Copyright 2023-Present -The University of Texas Health Science Center at Houston |