
|
|||||
|
 | |
| |
| |
| |
| |
| |
|
Gene: TMEM164 |
Gene summary for TMEM164 |
| Gene information | Species | Human | Gene symbol | TMEM164 | Gene ID | 84187 |
| Gene name | transmembrane protein 164 | |
| Gene Alias | bB360B22.3 | |
| Cytomap | Xq23 | |
| Gene Type | protein-coding | GO ID | GO:0005575 | UniProtAcc | Q5U3C3 |
Top |
Malignant transformation analysis |
| Identification of the aberrant gene expression in precancerous and cancerous lesions by comparing the gene expression of stem-like cells in diseased tissues with normal stem cells |
| Entrez ID | Symbol | Replicates | Species | Organ | Tissue | Adj P-value | Log2FC | Malignancy |
| 84187 | TMEM164 | HTA11_3410_2000001011 | Human | Colorectum | AD | 1.76e-09 | -3.14e-01 | 0.0155 |
| 84187 | TMEM164 | HTA11_347_2000001011 | Human | Colorectum | AD | 9.91e-05 | 5.58e-01 | -0.1954 |
| 84187 | TMEM164 | A015-C-203 | Human | Colorectum | FAP | 9.16e-22 | -4.37e-01 | -0.1294 |
| 84187 | TMEM164 | A015-C-204 | Human | Colorectum | FAP | 4.38e-03 | -2.79e-01 | -0.0228 |
| 84187 | TMEM164 | A014-C-040 | Human | Colorectum | FAP | 4.37e-02 | -3.77e-01 | -0.1184 |
| 84187 | TMEM164 | A002-C-201 | Human | Colorectum | FAP | 1.42e-09 | -3.28e-01 | 0.0324 |
| 84187 | TMEM164 | A002-C-203 | Human | Colorectum | FAP | 3.09e-06 | -2.56e-01 | 0.2786 |
| 84187 | TMEM164 | A001-C-119 | Human | Colorectum | FAP | 1.51e-05 | -4.25e-01 | -0.1557 |
| 84187 | TMEM164 | A001-C-108 | Human | Colorectum | FAP | 9.61e-16 | -3.86e-01 | -0.0272 |
| 84187 | TMEM164 | A002-C-205 | Human | Colorectum | FAP | 2.69e-18 | -4.72e-01 | -0.1236 |
| 84187 | TMEM164 | A001-C-104 | Human | Colorectum | FAP | 1.33e-07 | -3.44e-01 | 0.0184 |
| 84187 | TMEM164 | A015-C-005 | Human | Colorectum | FAP | 1.62e-02 | -2.85e-01 | -0.0336 |
| 84187 | TMEM164 | A015-C-006 | Human | Colorectum | FAP | 4.67e-12 | -4.36e-01 | -0.0994 |
| 84187 | TMEM164 | A015-C-106 | Human | Colorectum | FAP | 3.04e-16 | -4.53e-01 | -0.0511 |
| 84187 | TMEM164 | A002-C-114 | Human | Colorectum | FAP | 6.04e-17 | -5.50e-01 | -0.1561 |
| 84187 | TMEM164 | A015-C-104 | Human | Colorectum | FAP | 2.93e-20 | -4.64e-01 | -0.1899 |
| 84187 | TMEM164 | A001-C-014 | Human | Colorectum | FAP | 5.59e-14 | -3.50e-01 | 0.0135 |
| 84187 | TMEM164 | A002-C-016 | Human | Colorectum | FAP | 3.89e-13 | -3.41e-01 | 0.0521 |
| 84187 | TMEM164 | A015-C-002 | Human | Colorectum | FAP | 4.36e-09 | -4.00e-01 | -0.0763 |
| 84187 | TMEM164 | A001-C-203 | Human | Colorectum | FAP | 3.94e-06 | -2.39e-01 | -0.0481 |
| Page: 1 2 3 4 5 |
| Tissue | Expression Dynamics | Abbreviation |
| Colorectum (GSE201348) |  | FAP: Familial adenomatous polyposis |
| CRC: Colorectal cancer | ||
| Colorectum (HTA11) |  | AD: Adenomas |
| SER: Sessile serrated lesions | ||
| MSI-H: Microsatellite-high colorectal cancer | ||
| MSS: Microsatellite stable colorectal cancer | ||
| Esophagus | 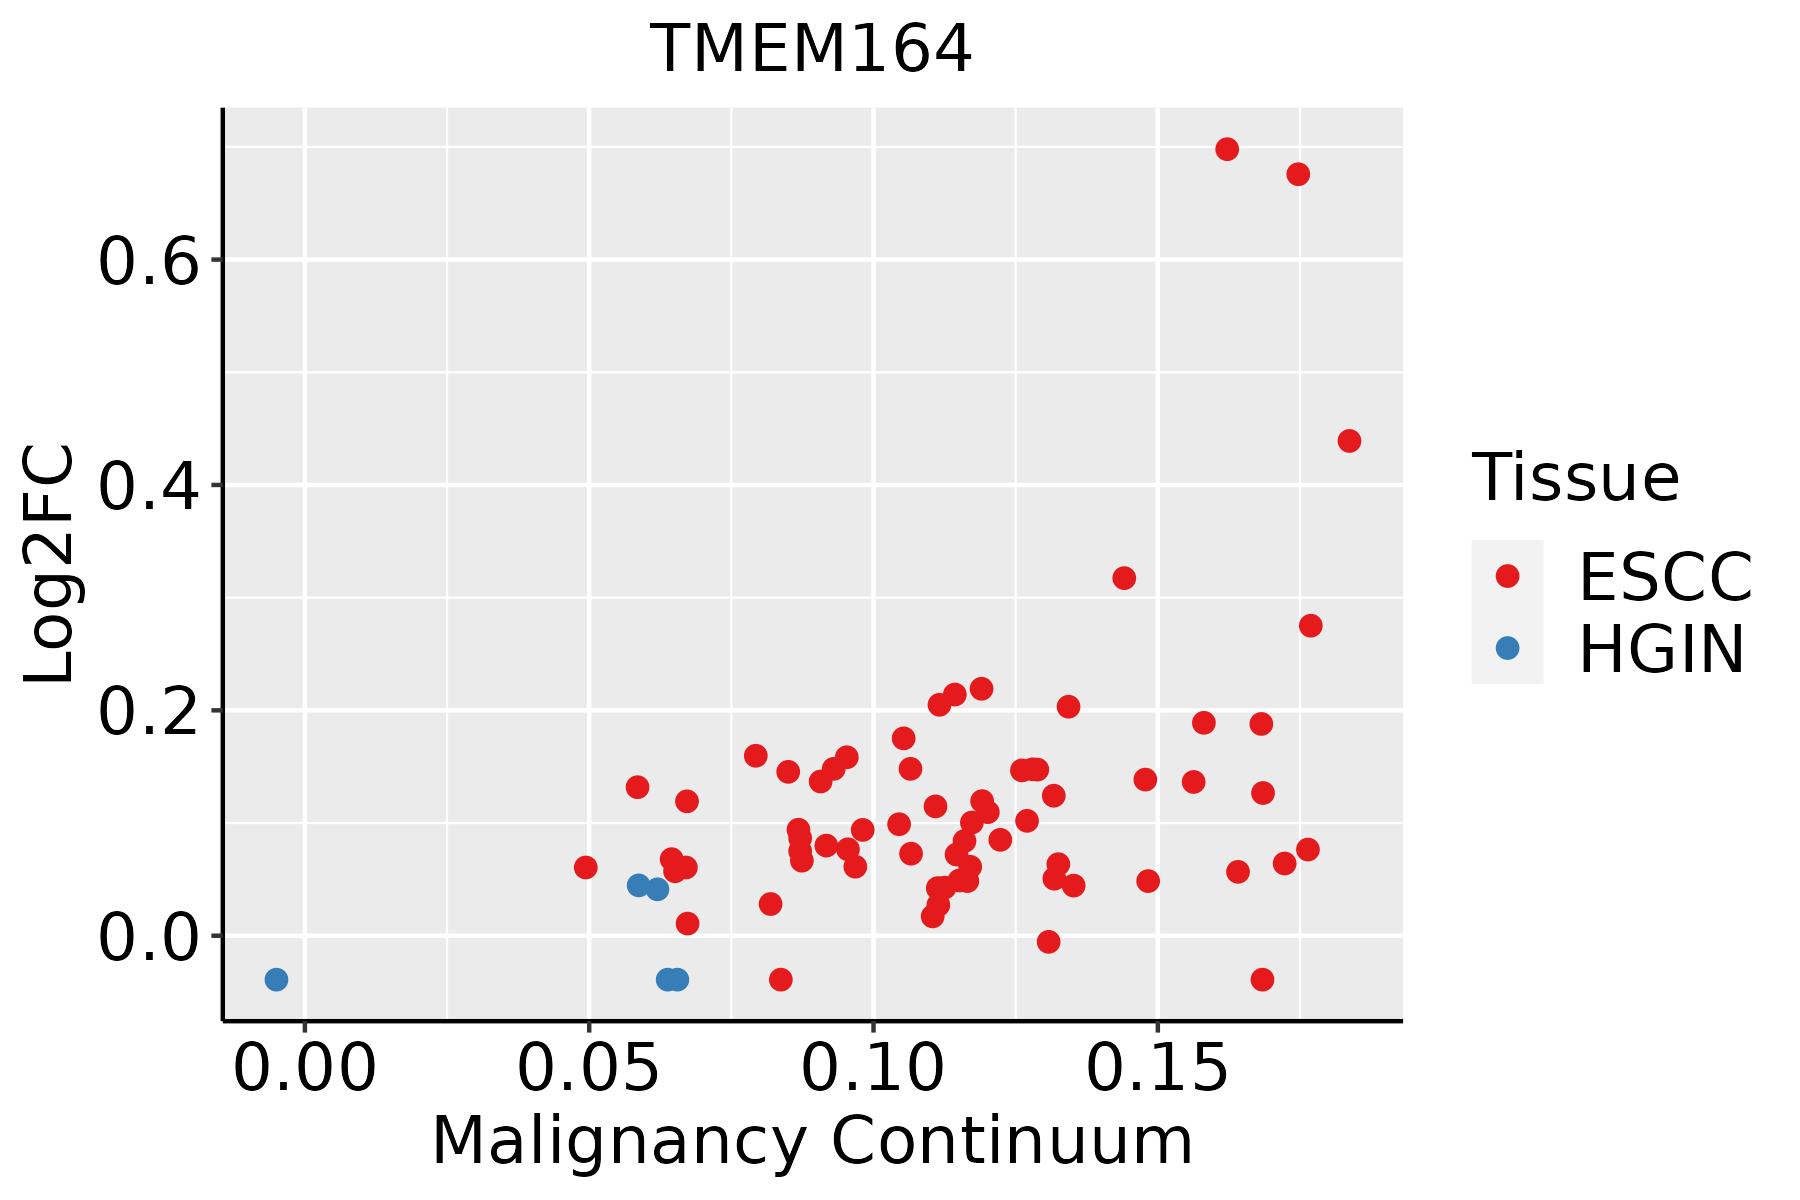 | ESCC: Esophageal squamous cell carcinoma |
| HGIN: High-grade intraepithelial neoplasias | ||
| LGIN: Low-grade intraepithelial neoplasias | ||
| Lung |  | AAH: Atypical adenomatous hyperplasia |
| AIS: Adenocarcinoma in situ | ||
| IAC: Invasive lung adenocarcinoma | ||
| MIA: Minimally invasive adenocarcinoma |
| ∗log2FC in expression of this searched gene in stem-like cells from each diseased tissue sample relative to stem-like cells in normal samples in each tissue plotted against the malignancy continuum. Samples are colored based on if they are from different disease stage. |
Top |
Malignant transformation related pathway analysis |
| Find out the enriched GO biological processes and KEGG pathways involved in transition from healthy to precancer to cancer |
| Tissue | Disease Stage | Enriched GO biological Processes |
| Colorectum | AD |  |
| Colorectum | SER |  |
| Colorectum | MSS |  |
| Colorectum | MSI-H |  |
| Colorectum | FAP |  |
| ∗Top 15 enriched GO BP terms are showed in the bar plot of each disease state in each tissue. Each row represents a significant GO biological process which is colored according to the -log10(p.adjust). |
| Page: 1 2 3 4 5 6 7 8 9 |
| GO ID | Tissue | Disease Stage | Description | Gene Ratio | Bg Ratio | pvalue | p.adjust | Count |
| Page: 1 |
| Pathway ID | Tissue | Disease Stage | Description | Gene Ratio | Bg Ratio | pvalue | p.adjust | qvalue | Count |
| Page: 1 |
Top |
Cell-cell communication analysis |
| Identification of potential cell-cell interactions between two cell types and their ligand-receptor pairs for different disease states |
| Ligand | Receptor | LRpair | Pathway | Tissue | Disease Stage |
| Page: 1 |
Top |
Single-cell gene regulatory network inference analysis |
| Find out the significant the regulons (TFs) and the target genes of each regulon across cell types for different disease states |
| TF | Cell Type | Tissue | Disease Stage | Target Gene | RSS | Regulon Activity |
| ∗The dot plots of a searched regulon are shown for all cell subpopulations in each disease state of each tissue based on the regulon specific score inferred using pySCENIC and by calculating the average expression. |
| Page: 1 |
Top |
Somatic mutation of malignant transformation related genes |
| Annotation of somatic variants for genes involved in malignant transformation |
| Hugo Symbol | Variant Class | Variant Classification | dbSNP RS | HGVSc | HGVSp | HGVSp Short | SWISSPROT | BIOTYPE | SIFT | PolyPhen | Tumor Sample Barcode | Tissue | Histology | Sex | Age | Stage | Therapy Types | Drugs | Outcome |
| TMEM164 | SNV | Missense_Mutation | rs757945538 | c.694G>A | p.Glu232Lys | p.E232K | Q5U3C3 | protein_coding | tolerated(0.17) | benign(0.063) | TCGA-AN-A046-01 | Breast | breast invasive carcinoma | Female | >=65 | I/II | Unknown | Unknown | SD |
| TMEM164 | SNV | Missense_Mutation | c.745N>A | p.Gly249Ser | p.G249S | Q5U3C3 | protein_coding | deleterious(0) | probably_damaging(0.997) | TCGA-C5-A8ZZ-01 | Cervix | cervical & endocervical cancer | Female | <65 | I/II | Unspecific | Cisplatin | SD | |
| TMEM164 | SNV | Missense_Mutation | c.276N>C | p.Lys92Asn | p.K92N | Q5U3C3 | protein_coding | deleterious(0) | probably_damaging(0.975) | TCGA-DR-A0ZM-01 | Cervix | cervical & endocervical cancer | Female | <65 | III/IV | Unspecific | Cisplatin | SD | |
| TMEM164 | SNV | Missense_Mutation | novel | c.358C>T | p.Leu120Phe | p.L120F | Q5U3C3 | protein_coding | deleterious(0.02) | probably_damaging(0.993) | TCGA-AA-3869-01 | Colorectum | colon adenocarcinoma | Male | >=65 | III/IV | Chemotherapy | capecitabine | PD |
| TMEM164 | SNV | Missense_Mutation | rs757945538 | c.694N>A | p.Glu232Lys | p.E232K | Q5U3C3 | protein_coding | tolerated(0.17) | benign(0.063) | TCGA-AA-3984-01 | Colorectum | colon adenocarcinoma | Female | <65 | I/II | Unknown | Unknown | SD |
| TMEM164 | SNV | Missense_Mutation | c.556N>A | p.Val186Met | p.V186M | Q5U3C3 | protein_coding | deleterious(0.04) | possibly_damaging(0.698) | TCGA-AA-A01D-01 | Colorectum | colon adenocarcinoma | Female | <65 | III/IV | Chemotherapy | capecitabine | PD | |
| TMEM164 | SNV | Missense_Mutation | c.76N>A | p.Gly26Ser | p.G26S | Q5U3C3 | protein_coding | deleterious(0.01) | probably_damaging(1) | TCGA-AA-A022-01 | Colorectum | colon adenocarcinoma | Female | >=65 | I/II | Unknown | Unknown | SD | |
| TMEM164 | SNV | Missense_Mutation | c.521T>C | p.Leu174Ser | p.L174S | Q5U3C3 | protein_coding | tolerated(0.73) | benign(0.053) | TCGA-F4-6570-01 | Colorectum | colon adenocarcinoma | Female | >=65 | I/II | Unknown | Unknown | SD | |
| TMEM164 | SNV | Missense_Mutation | c.540N>C | p.Gln180His | p.Q180H | Q5U3C3 | protein_coding | tolerated(0.07) | possibly_damaging(0.766) | TCGA-AF-2687-01 | Colorectum | rectum adenocarcinoma | Male | <65 | III/IV | Chemotherapy | xeloda | PD | |
| TMEM164 | SNV | Missense_Mutation | c.735C>A | p.Asp245Glu | p.D245E | Q5U3C3 | protein_coding | deleterious(0) | probably_damaging(0.999) | TCGA-AF-A56N-01 | Colorectum | rectum adenocarcinoma | Female | <65 | I/II | Chemotherapy | xeloda | CR |
| Page: 1 2 3 4 |
Top |
Related drugs of malignant transformation related genes |
| Identification of chemicals and drugs interact with genes involved in malignant transfromation |
| (DGIdb 4.0) |
| Entrez ID | Symbol | Category | Interaction Types | Drug Claim Name | Drug Name | PMIDs |
| Page: 1 |

Copyright 2023-Present -The University of Texas Health Science Center at Houston |