
|
|||||
|
 | |
| |
| |
| |
| |
| |
|
Gene: TMEM150C |
Gene summary for TMEM150C |
| Gene information | Species | Human | Gene symbol | TMEM150C | Gene ID | 441027 |
| Gene name | transmembrane protein 150C | |
| Gene Alias | TTN3 | |
| Cytomap | 4q21.22 | |
| Gene Type | protein-coding | GO ID | GO:0003008 | UniProtAcc | B9EJG8 |
Top |
Malignant transformation analysis |
| Identification of the aberrant gene expression in precancerous and cancerous lesions by comparing the gene expression of stem-like cells in diseased tissues with normal stem cells |
| Entrez ID | Symbol | Replicates | Species | Organ | Tissue | Adj P-value | Log2FC | Malignancy |
| 441027 | TMEM150C | GSM4909293 | Human | Breast | IDC | 2.49e-22 | 4.23e-01 | 0.1581 |
| 441027 | TMEM150C | GSM4909301 | Human | Breast | IDC | 3.73e-06 | 2.61e-01 | 0.1577 |
| 441027 | TMEM150C | GSM4909306 | Human | Breast | IDC | 4.71e-04 | 2.28e-01 | 0.1564 |
| 441027 | TMEM150C | GSM4909317 | Human | Breast | IDC | 2.85e-25 | 5.72e-01 | 0.1355 |
| 441027 | TMEM150C | M1 | Human | Breast | IDC | 3.50e-05 | 2.76e-01 | 0.1577 |
| 441027 | TMEM150C | NCCBC2 | Human | Breast | DCIS | 2.98e-09 | 8.32e-01 | 0.1554 |
| 441027 | TMEM150C | DCIS2 | Human | Breast | DCIS | 1.79e-09 | 4.17e-02 | 0.0085 |
| 441027 | TMEM150C | P2T-E | Human | Esophagus | ESCC | 8.68e-25 | 5.39e-01 | 0.1177 |
| 441027 | TMEM150C | P8T-E | Human | Esophagus | ESCC | 4.43e-14 | 1.43e-01 | 0.0889 |
| 441027 | TMEM150C | P9T-E | Human | Esophagus | ESCC | 3.98e-02 | 5.33e-02 | 0.1131 |
| 441027 | TMEM150C | P10T-E | Human | Esophagus | ESCC | 1.04e-08 | 8.75e-02 | 0.116 |
| 441027 | TMEM150C | P12T-E | Human | Esophagus | ESCC | 1.52e-24 | 4.78e-01 | 0.1122 |
| 441027 | TMEM150C | P15T-E | Human | Esophagus | ESCC | 4.16e-10 | 2.69e-01 | 0.1149 |
| 441027 | TMEM150C | P16T-E | Human | Esophagus | ESCC | 1.94e-15 | 2.32e-01 | 0.1153 |
| 441027 | TMEM150C | P21T-E | Human | Esophagus | ESCC | 1.74e-03 | 8.14e-03 | 0.1617 |
| 441027 | TMEM150C | P22T-E | Human | Esophagus | ESCC | 1.09e-08 | 6.62e-02 | 0.1236 |
| 441027 | TMEM150C | P23T-E | Human | Esophagus | ESCC | 1.62e-02 | 6.46e-02 | 0.108 |
| 441027 | TMEM150C | P26T-E | Human | Esophagus | ESCC | 5.66e-22 | 3.22e-01 | 0.1276 |
| 441027 | TMEM150C | P27T-E | Human | Esophagus | ESCC | 3.67e-10 | 1.76e-01 | 0.1055 |
| 441027 | TMEM150C | P28T-E | Human | Esophagus | ESCC | 1.90e-28 | 5.83e-01 | 0.1149 |
| Page: 1 2 3 |
| Tissue | Expression Dynamics | Abbreviation |
| Breast | 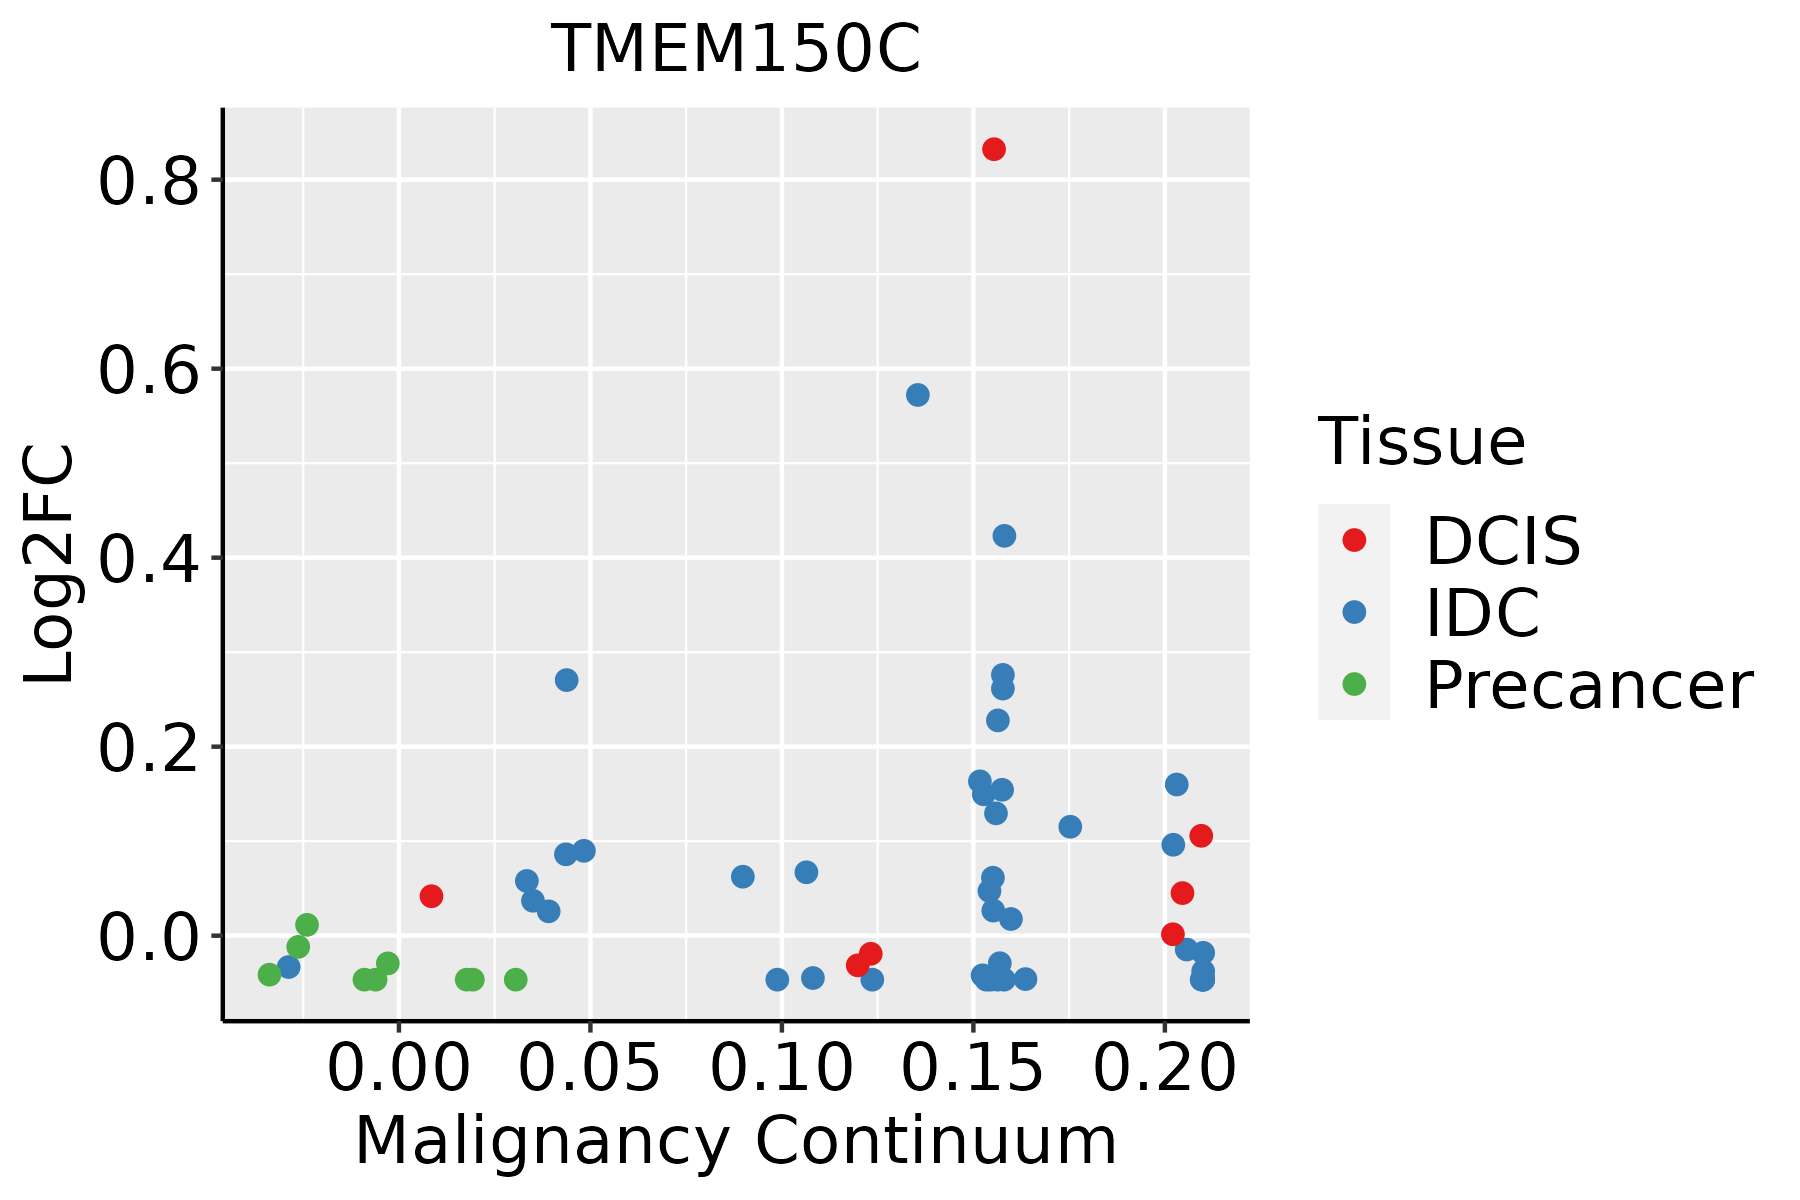 | IDC: Invasive ductal carcinoma |
| DCIS: Ductal carcinoma in situ | ||
| Precancer(BRCA1-mut): Precancerous lesion from BRCA1 mutation carriers | ||
| Esophagus | 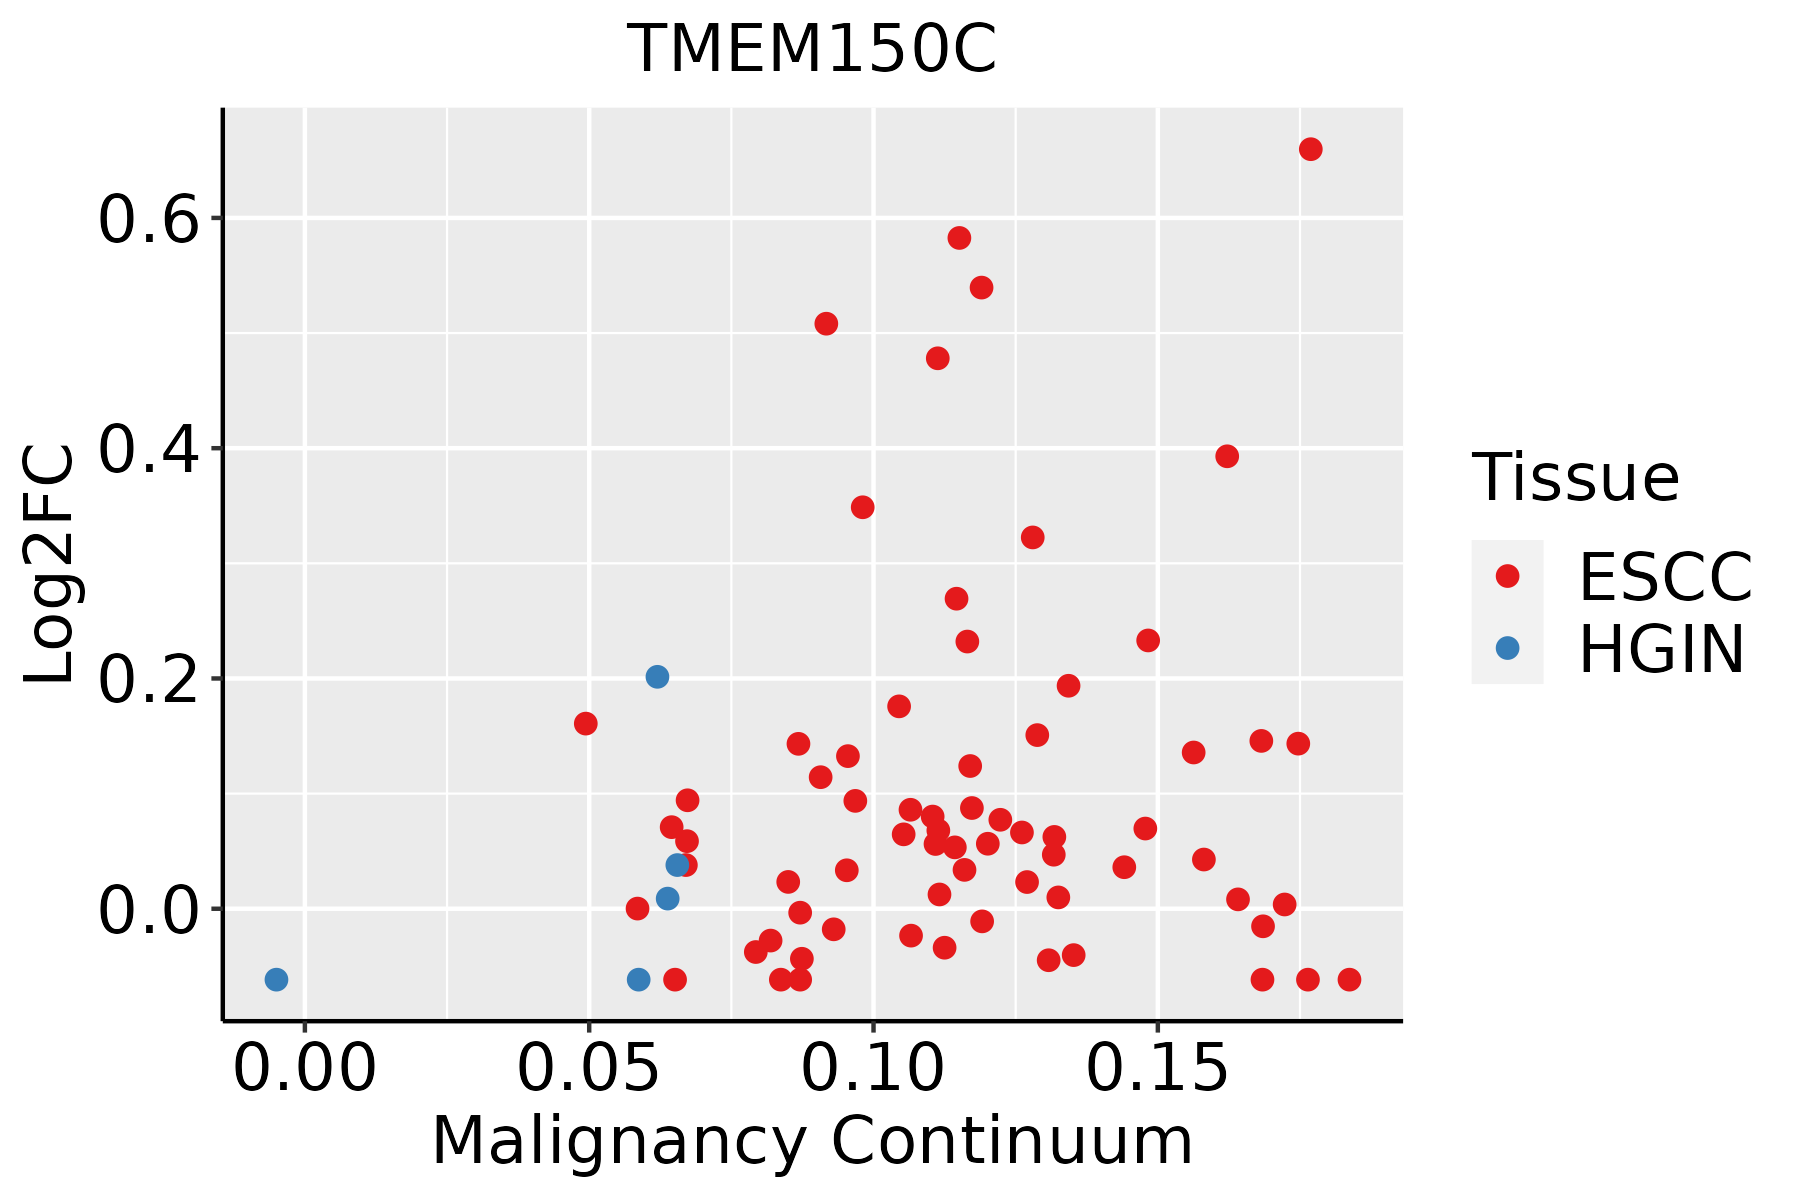 | ESCC: Esophageal squamous cell carcinoma |
| HGIN: High-grade intraepithelial neoplasias | ||
| LGIN: Low-grade intraepithelial neoplasias |
| ∗log2FC in expression of this searched gene in stem-like cells from each diseased tissue sample relative to stem-like cells in normal samples in each tissue plotted against the malignancy continuum. Samples are colored based on if they are from different disease stage. |
Top |
Malignant transformation related pathway analysis |
| Find out the enriched GO biological processes and KEGG pathways involved in transition from healthy to precancer to cancer |
| Tissue | Disease Stage | Enriched GO biological Processes |
| Colorectum | AD |  |
| Colorectum | SER |  |
| Colorectum | MSS |  |
| Colorectum | MSI-H |  |
| Colorectum | FAP |  |
| ∗Top 15 enriched GO BP terms are showed in the bar plot of each disease state in each tissue. Each row represents a significant GO biological process which is colored according to the -log10(p.adjust). |
| Page: 1 2 3 4 5 6 7 8 9 |
| GO ID | Tissue | Disease Stage | Description | Gene Ratio | Bg Ratio | pvalue | p.adjust | Count |
| GO:007121413 | Breast | IDC | cellular response to abiotic stimulus | 48/1434 | 331/18723 | 1.37e-05 | 3.53e-04 | 48 |
| GO:010400413 | Breast | IDC | cellular response to environmental stimulus | 48/1434 | 331/18723 | 1.37e-05 | 3.53e-04 | 48 |
| GO:000961211 | Breast | IDC | response to mechanical stimulus | 34/1434 | 216/18723 | 4.59e-05 | 1.03e-03 | 34 |
| GO:007149614 | Breast | IDC | cellular response to external stimulus | 45/1434 | 320/18723 | 5.40e-05 | 1.15e-03 | 45 |
| GO:007121423 | Breast | DCIS | cellular response to abiotic stimulus | 47/1390 | 331/18723 | 1.32e-05 | 3.31e-04 | 47 |
| GO:010400423 | Breast | DCIS | cellular response to environmental stimulus | 47/1390 | 331/18723 | 1.32e-05 | 3.31e-04 | 47 |
| GO:007149623 | Breast | DCIS | cellular response to external stimulus | 45/1390 | 320/18723 | 2.55e-05 | 5.87e-04 | 45 |
| GO:000961221 | Breast | DCIS | response to mechanical stimulus | 32/1390 | 216/18723 | 1.36e-04 | 2.33e-03 | 32 |
| GO:0071496111 | Esophagus | ESCC | cellular response to external stimulus | 215/8552 | 320/18723 | 4.29e-15 | 2.43e-13 | 215 |
| GO:007121419 | Esophagus | ESCC | cellular response to abiotic stimulus | 206/8552 | 331/18723 | 7.52e-10 | 1.88e-08 | 206 |
| GO:010400419 | Esophagus | ESCC | cellular response to environmental stimulus | 206/8552 | 331/18723 | 7.52e-10 | 1.88e-08 | 206 |
| GO:00712606 | Esophagus | ESCC | cellular response to mechanical stimulus | 54/8552 | 81/18723 | 1.09e-04 | 7.64e-04 | 54 |
| GO:000961216 | Esophagus | ESCC | response to mechanical stimulus | 124/8552 | 216/18723 | 3.30e-04 | 1.94e-03 | 124 |
| Page: 1 |
| Pathway ID | Tissue | Disease Stage | Description | Gene Ratio | Bg Ratio | pvalue | p.adjust | qvalue | Count |
| Page: 1 |
Top |
Cell-cell communication analysis |
| Identification of potential cell-cell interactions between two cell types and their ligand-receptor pairs for different disease states |
| Ligand | Receptor | LRpair | Pathway | Tissue | Disease Stage |
| Page: 1 |
Top |
Single-cell gene regulatory network inference analysis |
| Find out the significant the regulons (TFs) and the target genes of each regulon across cell types for different disease states |
| TF | Cell Type | Tissue | Disease Stage | Target Gene | RSS | Regulon Activity |
| ∗The dot plots of a searched regulon are shown for all cell subpopulations in each disease state of each tissue based on the regulon specific score inferred using pySCENIC and by calculating the average expression. |
| Page: 1 |
Top |
Somatic mutation of malignant transformation related genes |
| Annotation of somatic variants for genes involved in malignant transformation |
| Hugo Symbol | Variant Class | Variant Classification | dbSNP RS | HGVSc | HGVSp | HGVSp Short | SWISSPROT | BIOTYPE | SIFT | PolyPhen | Tumor Sample Barcode | Tissue | Histology | Sex | Age | Stage | Therapy Types | Drugs | Outcome |
| TMEM150C | SNV | Missense_Mutation | c.739N>A | p.Asp247Asn | p.D247N | B9EJG8 | protein_coding | deleterious_low_confidence(0.01) | probably_damaging(0.977) | TCGA-AC-A23H-01 | Breast | breast invasive carcinoma | Female | >=65 | I/II | Unknown | Unknown | PD | |
| TMEM150C | SNV | Missense_Mutation | rs745461497 | c.376N>A | p.Glu126Lys | p.E126K | B9EJG8 | protein_coding | tolerated(0.33) | probably_damaging(0.989) | TCGA-B6-A0WY-01 | Breast | breast invasive carcinoma | Female | <65 | III/IV | Unknown | Unknown | PD |
| TMEM150C | SNV | Missense_Mutation | c.443N>T | p.Ala148Val | p.A148V | B9EJG8 | protein_coding | tolerated(0.29) | benign(0.2) | TCGA-BH-A0HF-01 | Breast | breast invasive carcinoma | Female | >=65 | I/II | Hormone Therapy | arimidex | SD | |
| TMEM150C | SNV | Missense_Mutation | c.319C>A | p.Leu107Met | p.L107M | B9EJG8 | protein_coding | tolerated(0.22) | probably_damaging(0.977) | TCGA-2W-A8YY-01 | Cervix | cervical & endocervical cancer | Female | <65 | I/II | Chemotherapy | cisplatin | CR | |
| TMEM150C | SNV | Missense_Mutation | novel | c.226G>A | p.Ala76Thr | p.A76T | B9EJG8 | protein_coding | deleterious(0.02) | benign(0.299) | TCGA-2W-A8YY-01 | Cervix | cervical & endocervical cancer | Female | <65 | I/II | Chemotherapy | cisplatin | CR |
| TMEM150C | SNV | Missense_Mutation | rs761369207 | c.520N>G | p.Ile174Val | p.I174V | B9EJG8 | protein_coding | tolerated(0.6) | benign(0) | TCGA-A6-2686-01 | Colorectum | colon adenocarcinoma | Female | >=65 | I/II | Unknown | Unknown | SD |
| TMEM150C | SNV | Missense_Mutation | c.212T>G | p.Val71Gly | p.V71G | B9EJG8 | protein_coding | deleterious(0) | probably_damaging(0.995) | TCGA-AA-3811-01 | Colorectum | colon adenocarcinoma | Female | >=65 | III/IV | Unknown | Unknown | PD | |
| TMEM150C | SNV | Missense_Mutation | novel | c.431N>A | p.Cys144Tyr | p.C144Y | B9EJG8 | protein_coding | tolerated(0.51) | probably_damaging(0.995) | TCGA-AA-3950-01 | Colorectum | colon adenocarcinoma | Female | >=65 | I/II | Unknown | Unknown | SD |
| TMEM150C | SNV | Missense_Mutation | c.99A>C | p.Glu33Asp | p.E33D | B9EJG8 | protein_coding | tolerated(0.24) | probably_damaging(0.983) | TCGA-CA-6718-01 | Colorectum | colon adenocarcinoma | Male | <65 | I/II | Unknown | Unknown | PD | |
| TMEM150C | SNV | Missense_Mutation | novel | c.108A>C | p.Lys36Asn | p.K36N | B9EJG8 | protein_coding | tolerated(0.37) | possibly_damaging(0.481) | TCGA-F5-6814-01 | Colorectum | rectum adenocarcinoma | Male | <65 | I/II | Unknown | Unknown | SD |
| Page: 1 2 3 |
Top |
Related drugs of malignant transformation related genes |
| Identification of chemicals and drugs interact with genes involved in malignant transfromation |
| (DGIdb 4.0) |
| Entrez ID | Symbol | Category | Interaction Types | Drug Claim Name | Drug Name | PMIDs |
| Page: 1 |

Copyright 2023-Present -The University of Texas Health Science Center at Houston |