
|
|||||
|
 | |
| |
| |
| |
| |
| |
|
Gene: TMEM14B |
Gene summary for TMEM14B |
| Gene information | Species | Human | Gene symbol | TMEM14B | Gene ID | 81853 |
| Gene name | transmembrane protein 14B | |
| Gene Alias | TMEM14B | |
| Cytomap | 6p24.2 | |
| Gene Type | protein-coding | GO ID | GO:0000082 | UniProtAcc | Q9NUH8 |
Top |
Malignant transformation analysis |
| Identification of the aberrant gene expression in precancerous and cancerous lesions by comparing the gene expression of stem-like cells in diseased tissues with normal stem cells |
| Entrez ID | Symbol | Replicates | Species | Organ | Tissue | Adj P-value | Log2FC | Malignancy |
| 81853 | TMEM14B | GSM4909281 | Human | Breast | IDC | 2.22e-31 | 6.97e-01 | 0.21 |
| 81853 | TMEM14B | GSM4909282 | Human | Breast | IDC | 7.92e-16 | 4.89e-01 | -0.0288 |
| 81853 | TMEM14B | GSM4909285 | Human | Breast | IDC | 4.69e-24 | 5.62e-01 | 0.21 |
| 81853 | TMEM14B | GSM4909286 | Human | Breast | IDC | 1.15e-10 | 4.34e-01 | 0.1081 |
| 81853 | TMEM14B | GSM4909289 | Human | Breast | IDC | 5.21e-24 | 1.02e+00 | 0.1064 |
| 81853 | TMEM14B | GSM4909296 | Human | Breast | IDC | 4.06e-04 | -1.64e-01 | 0.1524 |
| 81853 | TMEM14B | GSM4909297 | Human | Breast | IDC | 2.43e-05 | -5.02e-02 | 0.1517 |
| 81853 | TMEM14B | GSM4909298 | Human | Breast | IDC | 8.99e-03 | 2.27e-01 | 0.1551 |
| 81853 | TMEM14B | GSM4909308 | Human | Breast | IDC | 7.93e-13 | 4.72e-01 | 0.158 |
| 81853 | TMEM14B | GSM4909311 | Human | Breast | IDC | 7.13e-27 | -1.77e-01 | 0.1534 |
| 81853 | TMEM14B | GSM4909312 | Human | Breast | IDC | 1.44e-07 | 1.63e-01 | 0.1552 |
| 81853 | TMEM14B | GSM4909319 | Human | Breast | IDC | 5.85e-32 | -2.22e-01 | 0.1563 |
| 81853 | TMEM14B | GSM4909321 | Human | Breast | IDC | 4.21e-13 | 7.03e-02 | 0.1559 |
| 81853 | TMEM14B | brca2 | Human | Breast | Precancer | 4.13e-03 | 1.05e-01 | -0.024 |
| 81853 | TMEM14B | brca3 | Human | Breast | Precancer | 4.97e-02 | 7.49e-02 | -0.0263 |
| 81853 | TMEM14B | NCCBC14 | Human | Breast | DCIS | 1.45e-06 | 1.43e-01 | 0.2021 |
| 81853 | TMEM14B | NCCBC5 | Human | Breast | DCIS | 5.29e-11 | 5.14e-02 | 0.2046 |
| 81853 | TMEM14B | P1 | Human | Breast | IDC | 7.50e-13 | -1.70e-01 | 0.1527 |
| 81853 | TMEM14B | DCIS2 | Human | Breast | DCIS | 1.45e-53 | 1.56e-01 | 0.0085 |
| 81853 | TMEM14B | CA_HPV_1 | Human | Cervix | CC | 3.36e-09 | -1.71e-01 | 0.0264 |
| Page: 1 2 3 4 5 6 7 8 9 10 11 12 |
| Tissue | Expression Dynamics | Abbreviation |
| Breast | 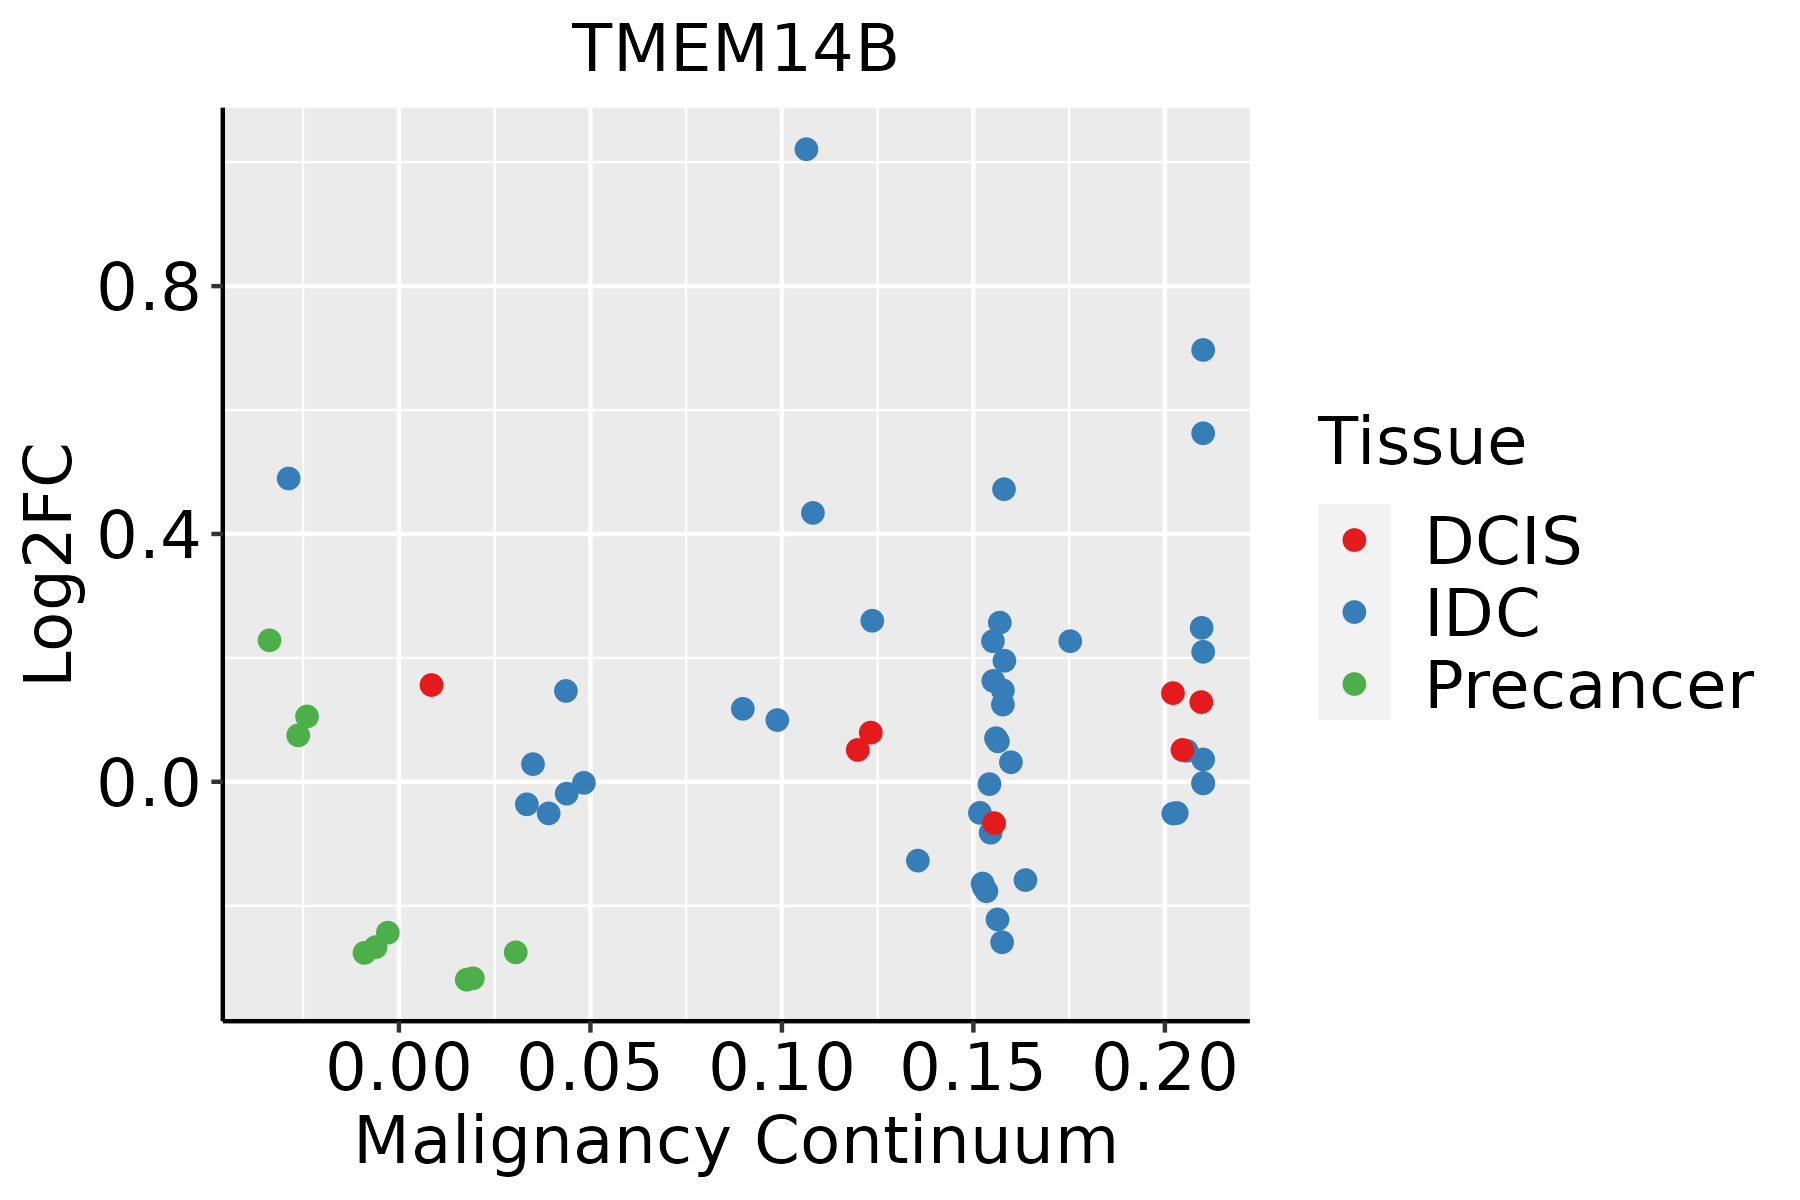 | IDC: Invasive ductal carcinoma |
| DCIS: Ductal carcinoma in situ | ||
| Precancer(BRCA1-mut): Precancerous lesion from BRCA1 mutation carriers | ||
| Cervix |  | CC: Cervix cancer |
| HSIL_HPV: HPV-infected high-grade squamous intraepithelial lesions | ||
| N_HPV: HPV-infected normal cervix | ||
| Colorectum (GSE201348) |  | FAP: Familial adenomatous polyposis |
| CRC: Colorectal cancer | ||
| Colorectum (HTA11) |  | AD: Adenomas |
| SER: Sessile serrated lesions | ||
| MSI-H: Microsatellite-high colorectal cancer | ||
| MSS: Microsatellite stable colorectal cancer | ||
| Endometrium |  | AEH: Atypical endometrial hyperplasia |
| EEC: Endometrioid Cancer | ||
| Esophagus | 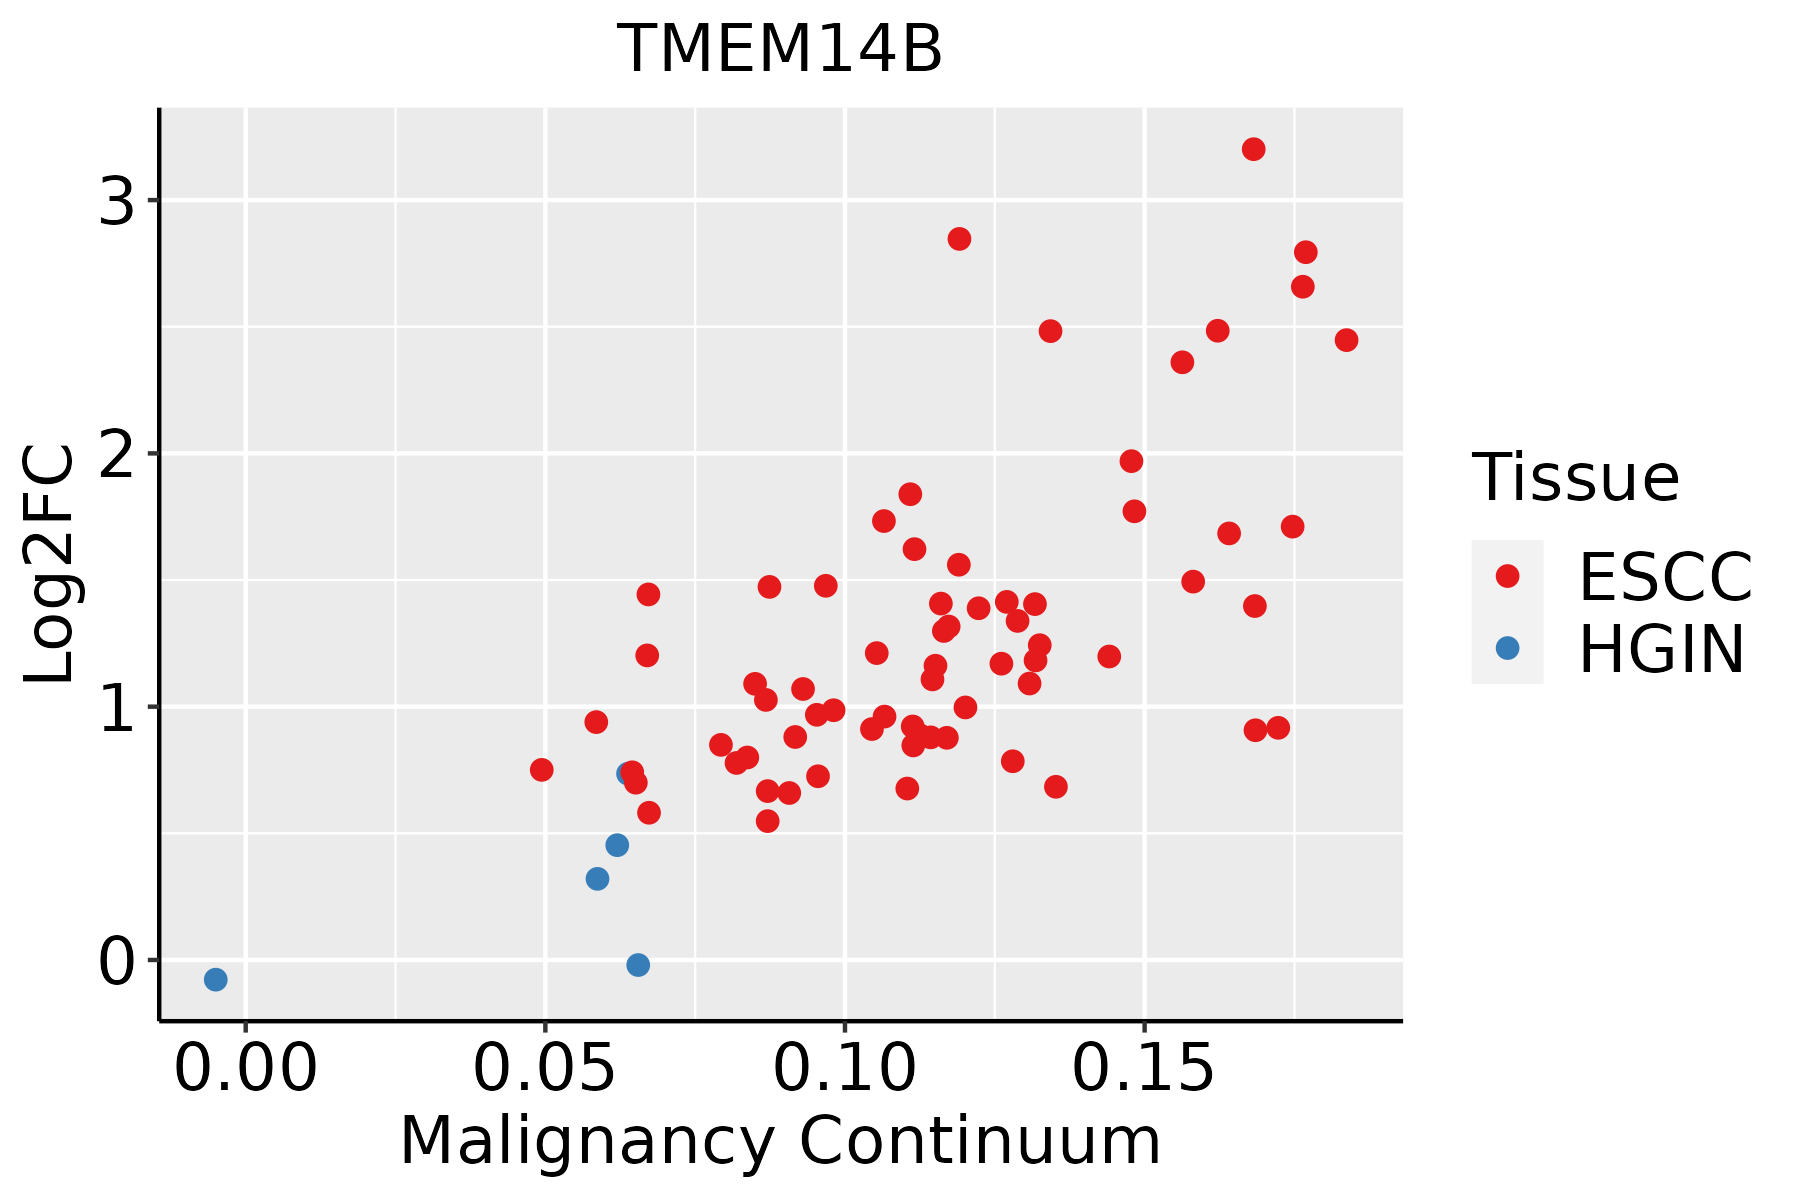 | ESCC: Esophageal squamous cell carcinoma |
| HGIN: High-grade intraepithelial neoplasias | ||
| LGIN: Low-grade intraepithelial neoplasias | ||
| Liver |  | HCC: Hepatocellular carcinoma |
| NAFLD: Non-alcoholic fatty liver disease | ||
| Oral Cavity | 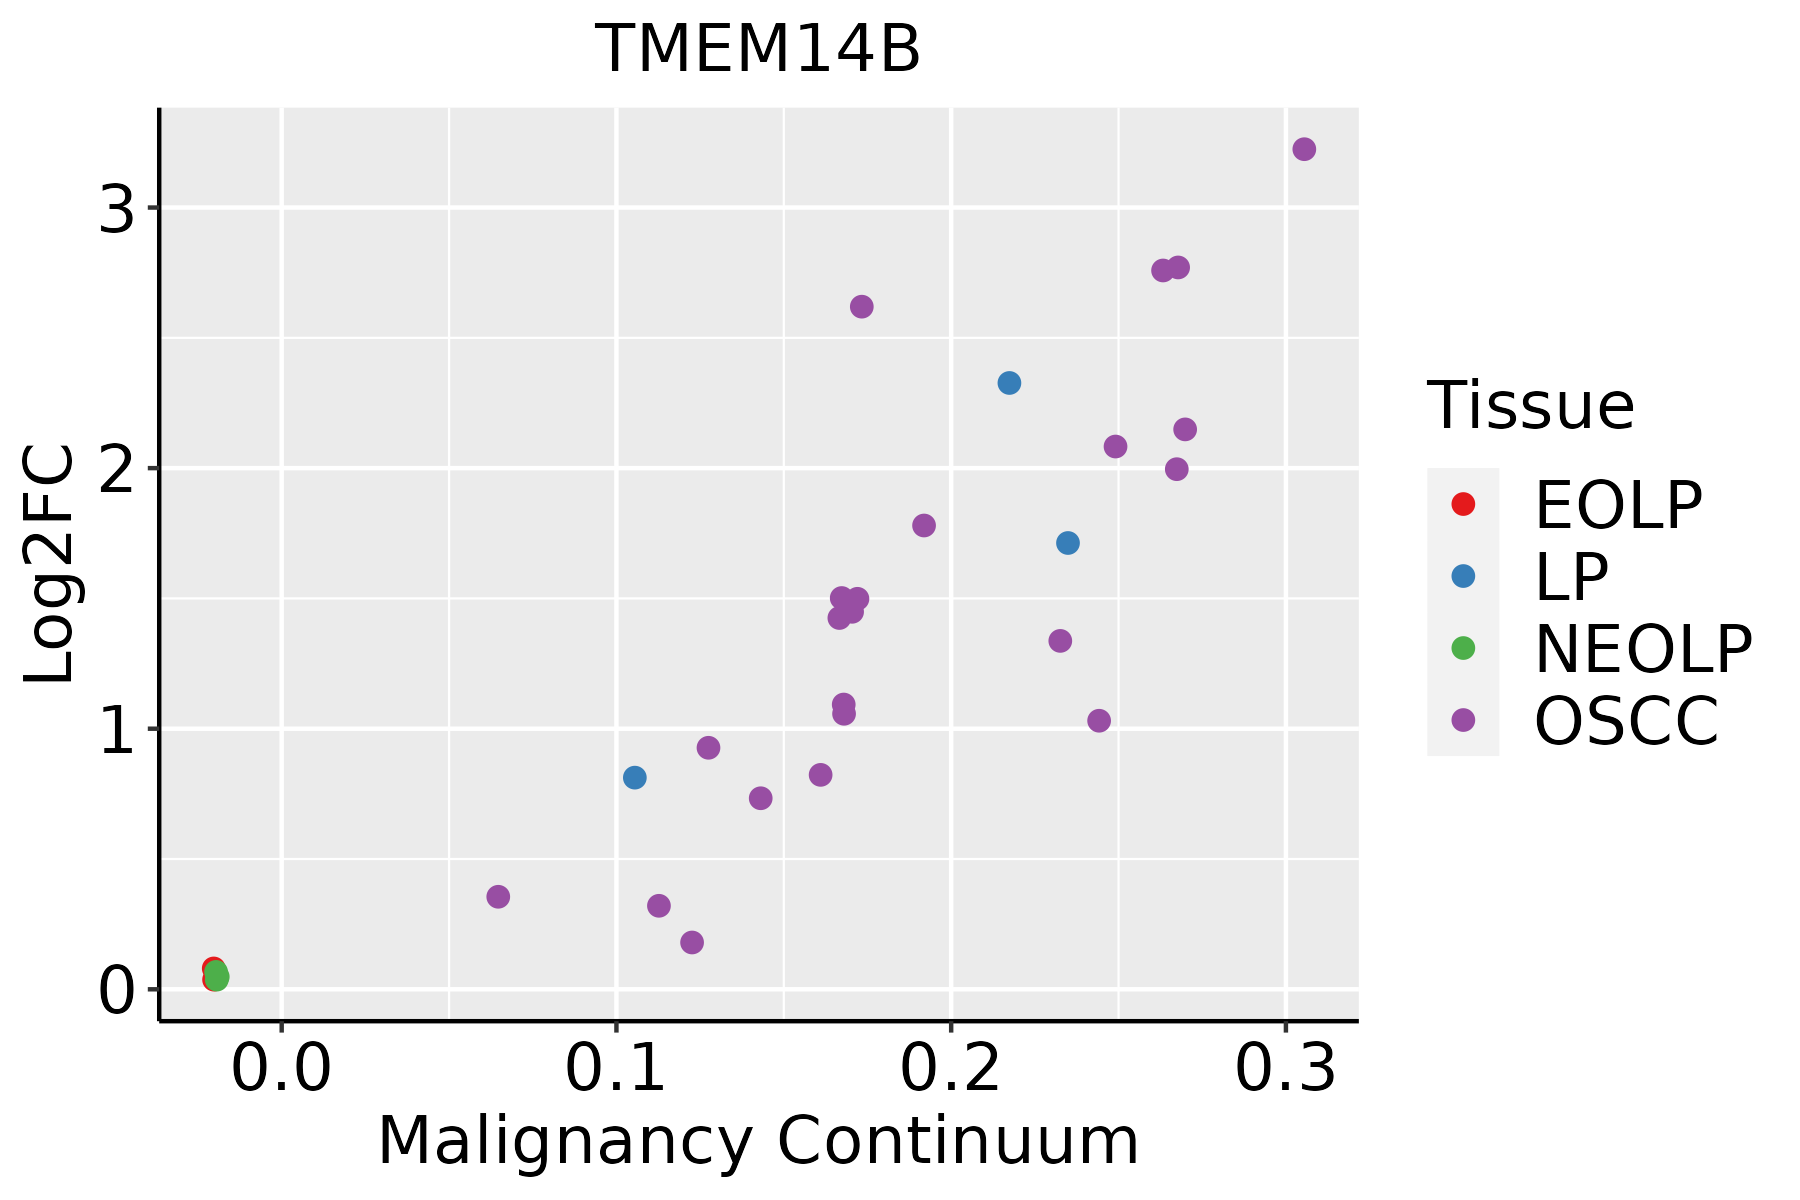 | EOLP: Erosive Oral lichen planus |
| LP: leukoplakia | ||
| NEOLP: Non-erosive oral lichen planus | ||
| OSCC: Oral squamous cell carcinoma | ||
| Prostate |  | BPH: Benign Prostatic Hyperplasia |
| Skin | 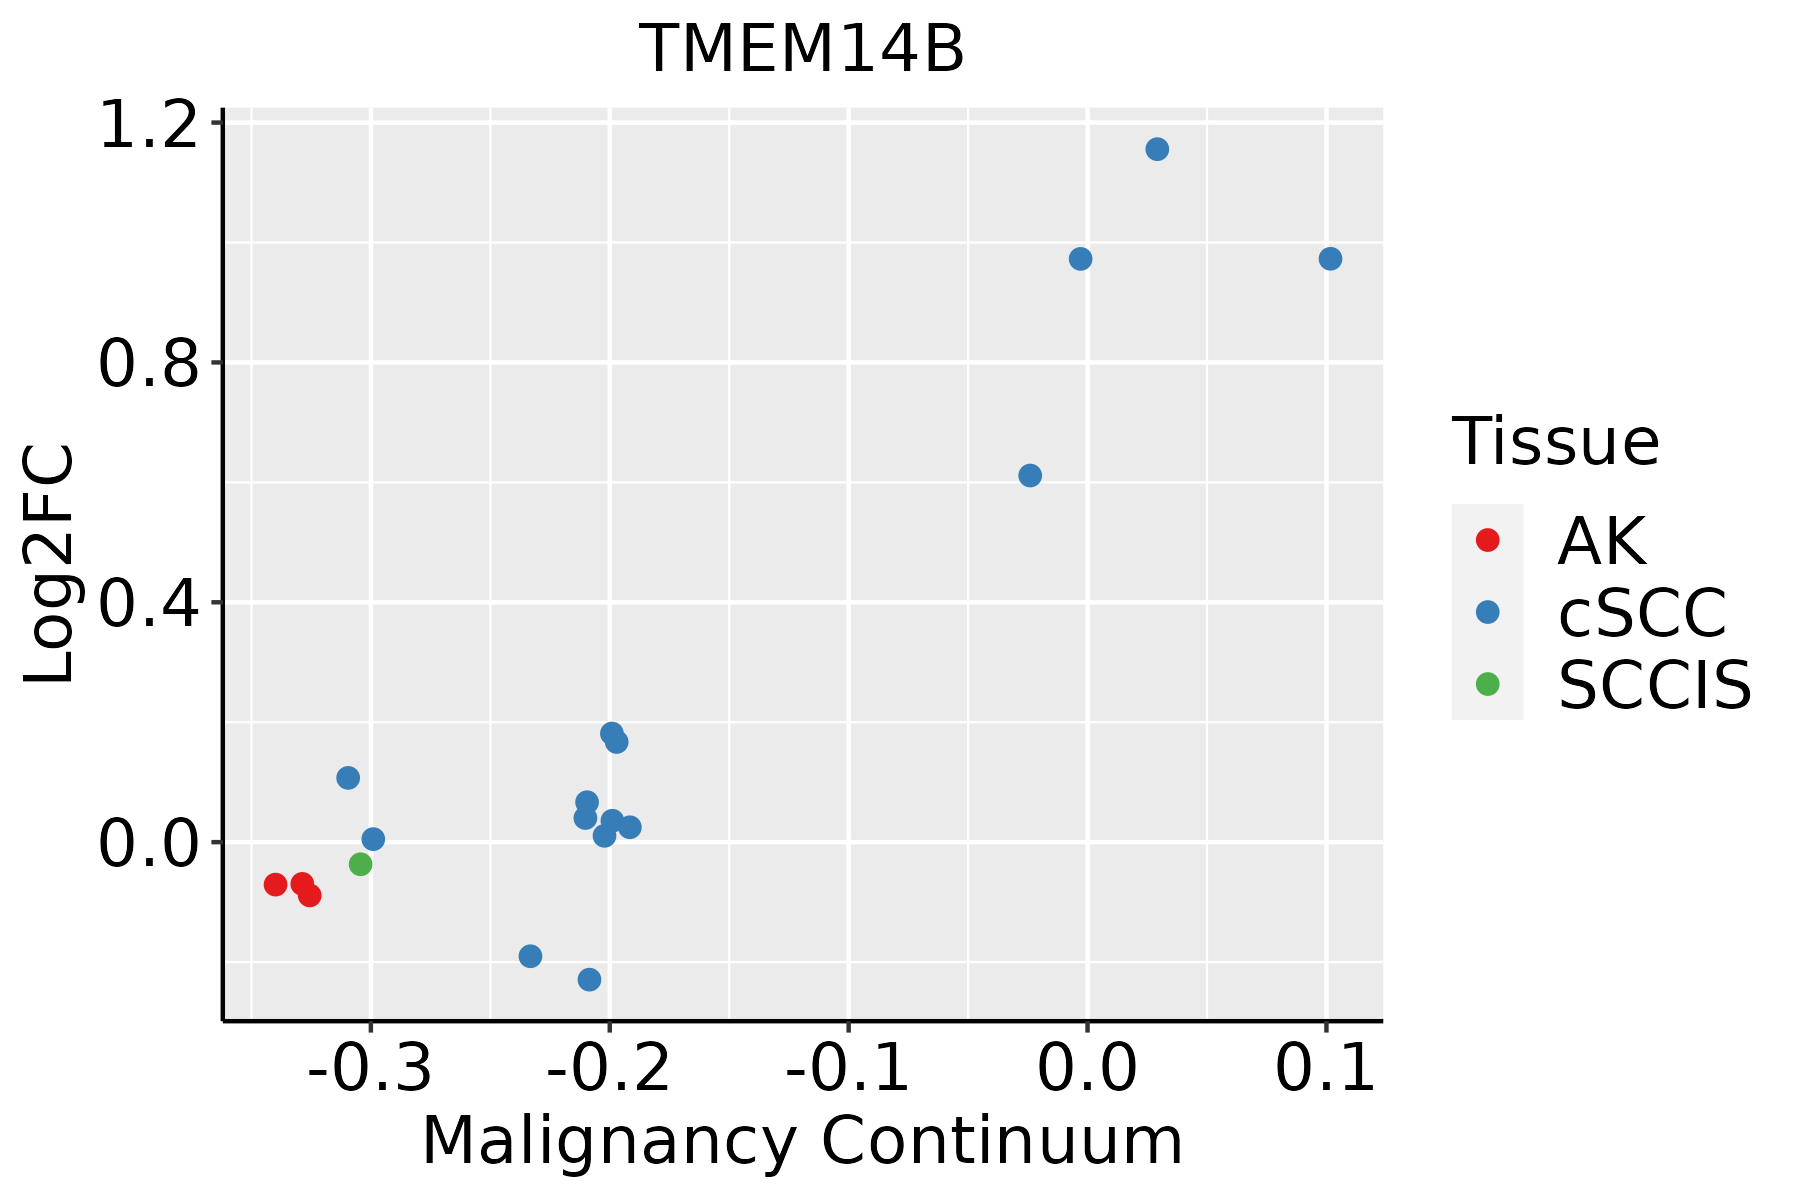 | AK: Actinic keratosis |
| cSCC: Cutaneous squamous cell carcinoma | ||
| SCCIS:squamous cell carcinoma in situ | ||
| Thyroid |  | ATC: Anaplastic thyroid cancer |
| HT: Hashimoto's thyroiditis | ||
| PTC: Papillary thyroid cancer |
| ∗log2FC in expression of this searched gene in stem-like cells from each diseased tissue sample relative to stem-like cells in normal samples in each tissue plotted against the malignancy continuum. Samples are colored based on if they are from different disease stage. |
Top |
Malignant transformation related pathway analysis |
| Find out the enriched GO biological processes and KEGG pathways involved in transition from healthy to precancer to cancer |
| Tissue | Disease Stage | Enriched GO biological Processes |
| Colorectum | AD |  |
| Colorectum | SER |  |
| Colorectum | MSS |  |
| Colorectum | MSI-H |  |
| Colorectum | FAP |  |
| ∗Top 15 enriched GO BP terms are showed in the bar plot of each disease state in each tissue. Each row represents a significant GO biological process which is colored according to the -log10(p.adjust). |
| Page: 1 2 3 4 5 6 7 8 9 |
| GO ID | Tissue | Disease Stage | Description | Gene Ratio | Bg Ratio | pvalue | p.adjust | Count |
| GO:00068398 | Breast | Precancer | mitochondrial transport | 45/1080 | 254/18723 | 1.37e-11 | 1.88e-09 | 45 |
| GO:000683913 | Breast | IDC | mitochondrial transport | 51/1434 | 254/18723 | 1.54e-10 | 1.83e-08 | 51 |
| GO:00073465 | Breast | IDC | regulation of mitotic cell cycle | 51/1434 | 457/18723 | 4.30e-03 | 3.35e-02 | 51 |
| GO:000683923 | Breast | DCIS | mitochondrial transport | 51/1390 | 254/18723 | 5.04e-11 | 6.79e-09 | 51 |
| GO:000734612 | Breast | DCIS | regulation of mitotic cell cycle | 52/1390 | 457/18723 | 1.38e-03 | 1.43e-02 | 52 |
| GO:00447724 | Breast | DCIS | mitotic cell cycle phase transition | 46/1390 | 424/18723 | 6.16e-03 | 4.39e-02 | 46 |
| GO:00447725 | Cervix | CC | mitotic cell cycle phase transition | 89/2311 | 424/18723 | 2.70e-07 | 1.12e-05 | 89 |
| GO:00068399 | Cervix | CC | mitochondrial transport | 60/2311 | 254/18723 | 4.21e-07 | 1.67e-05 | 60 |
| GO:20000453 | Cervix | CC | regulation of G1/S transition of mitotic cell cycle | 37/2311 | 142/18723 | 6.33e-06 | 1.53e-04 | 37 |
| GO:00000824 | Cervix | CC | G1/S transition of mitotic cell cycle | 49/2311 | 214/18723 | 1.16e-05 | 2.48e-04 | 49 |
| GO:19028062 | Cervix | CC | regulation of cell cycle G1/S phase transition | 41/2311 | 168/18723 | 1.18e-05 | 2.51e-04 | 41 |
| GO:00073466 | Cervix | CC | regulation of mitotic cell cycle | 88/2311 | 457/18723 | 1.26e-05 | 2.60e-04 | 88 |
| GO:19019903 | Cervix | CC | regulation of mitotic cell cycle phase transition | 63/2311 | 299/18723 | 1.27e-05 | 2.60e-04 | 63 |
| GO:00448434 | Cervix | CC | cell cycle G1/S phase transition | 53/2311 | 241/18723 | 1.76e-05 | 3.32e-04 | 53 |
| GO:19019873 | Cervix | CC | regulation of cell cycle phase transition | 74/2311 | 390/18723 | 9.80e-05 | 1.27e-03 | 74 |
| GO:00219873 | Cervix | CC | cerebral cortex development | 25/2311 | 114/18723 | 2.81e-03 | 1.88e-02 | 25 |
| GO:00309003 | Cervix | CC | forebrain development | 64/2311 | 379/18723 | 5.53e-03 | 3.19e-02 | 64 |
| GO:00215433 | Cervix | CC | pallium development | 32/2311 | 169/18723 | 8.73e-03 | 4.48e-02 | 32 |
| GO:0061351 | Cervix | CC | neural precursor cell proliferation | 28/2311 | 145/18723 | 1.04e-02 | 4.97e-02 | 28 |
| GO:0006839 | Colorectum | AD | mitochondrial transport | 102/3918 | 254/18723 | 1.87e-12 | 3.08e-10 | 102 |
| Page: 1 2 3 4 5 6 7 8 |
| Pathway ID | Tissue | Disease Stage | Description | Gene Ratio | Bg Ratio | pvalue | p.adjust | qvalue | Count |
| Page: 1 |
Top |
Cell-cell communication analysis |
| Identification of potential cell-cell interactions between two cell types and their ligand-receptor pairs for different disease states |
| Ligand | Receptor | LRpair | Pathway | Tissue | Disease Stage |
| Page: 1 |
Top |
Single-cell gene regulatory network inference analysis |
| Find out the significant the regulons (TFs) and the target genes of each regulon across cell types for different disease states |
| TF | Cell Type | Tissue | Disease Stage | Target Gene | RSS | Regulon Activity |
| ∗The dot plots of a searched regulon are shown for all cell subpopulations in each disease state of each tissue based on the regulon specific score inferred using pySCENIC and by calculating the average expression. |
| Page: 1 |
Top |
Somatic mutation of malignant transformation related genes |
| Annotation of somatic variants for genes involved in malignant transformation |
| Hugo Symbol | Variant Class | Variant Classification | dbSNP RS | HGVSc | HGVSp | HGVSp Short | SWISSPROT | BIOTYPE | SIFT | PolyPhen | Tumor Sample Barcode | Tissue | Histology | Sex | Age | Stage | Therapy Types | Drugs | Outcome |
| TMEM14B | SNV | Missense_Mutation | novel | c.154G>A | p.Gly52Ser | p.G52S | protein_coding | deleterious(0.01) | probably_damaging(0.936) | TCGA-F5-6814-01 | Colorectum | rectum adenocarcinoma | Male | <65 | I/II | Unknown | Unknown | SD | |
| TMEM14B | SNV | Missense_Mutation | c.275G>T | p.Gly92Val | p.G92V | protein_coding | deleterious(0) | probably_damaging(0.978) | TCGA-AX-A05T-01 | Endometrium | uterine corpus endometrioid carcinoma | Female | >=65 | I/II | Unknown | Unknown | SD | ||
| TMEM14B | SNV | Missense_Mutation | novel | c.94N>C | p.Lys32Gln | p.K32Q | protein_coding | deleterious(0) | probably_damaging(1) | TCGA-E6-A1LX-01 | Endometrium | uterine corpus endometrioid carcinoma | Female | <65 | I/II | Unknown | Unknown | SD | |
| TMEM14B | SNV | Missense_Mutation | novel | c.59N>G | p.Ala20Gly | p.A20G | protein_coding | deleterious(0.04) | possibly_damaging(0.905) | TCGA-EO-A22U-01 | Endometrium | uterine corpus endometrioid carcinoma | Female | >=65 | I/II | Unknown | Unknown | SD | |
| TMEM14B | SNV | Missense_Mutation | c.242G>C | p.Arg81Thr | p.R81T | protein_coding | deleterious(0.03) | probably_damaging(0.982) | TCGA-86-A4JF-01 | Lung | lung adenocarcinoma | Male | <65 | I/II | Chemotherapy | unknown | PD | ||
| TMEM14B | SNV | Missense_Mutation | novel | c.260A>T | p.Lys87Ile | p.K87I | protein_coding | deleterious(0.01) | probably_damaging(0.993) | TCGA-85-8666-01 | Lung | lung squamous cell carcinoma | Male | >=65 | I/II | Unknown | Unknown | SD | |
| TMEM14B | SNV | Missense_Mutation | novel | c.58G>A | p.Ala20Thr | p.A20T | protein_coding | tolerated(0.08) | possibly_damaging(0.517) | TCGA-QK-A64Z-01 | Oral cavity | head & neck squamous cell carcinoma | Female | >=65 | I/II | Unknown | Unknown | PD |
| Page: 1 |
Top |
Related drugs of malignant transformation related genes |
| Identification of chemicals and drugs interact with genes involved in malignant transfromation |
| (DGIdb 4.0) |
| Entrez ID | Symbol | Category | Interaction Types | Drug Claim Name | Drug Name | PMIDs |
| Page: 1 |

Copyright 2023-Present -The University of Texas Health Science Center at Houston |