
|
|||||
|
 | |
| |
| |
| |
| |
| |
|
Gene: TMEM14A |
Gene summary for TMEM14A |
| Gene information | Species | Human | Gene symbol | TMEM14A | Gene ID | 28978 |
| Gene name | transmembrane protein 14A | |
| Gene Alias | C6orf73 | |
| Cytomap | 6p12.2 | |
| Gene Type | protein-coding | GO ID | GO:0006810 | UniProtAcc | Q9Y6G1 |
Top |
Malignant transformation analysis |
| Identification of the aberrant gene expression in precancerous and cancerous lesions by comparing the gene expression of stem-like cells in diseased tissues with normal stem cells |
| Entrez ID | Symbol | Replicates | Species | Organ | Tissue | Adj P-value | Log2FC | Malignancy |
| 28978 | TMEM14A | GSM4909281 | Human | Breast | IDC | 3.78e-24 | 6.31e-01 | 0.21 |
| 28978 | TMEM14A | GSM4909282 | Human | Breast | IDC | 6.52e-31 | 7.23e-01 | -0.0288 |
| 28978 | TMEM14A | GSM4909285 | Human | Breast | IDC | 9.62e-16 | 4.60e-01 | 0.21 |
| 28978 | TMEM14A | GSM4909291 | Human | Breast | IDC | 2.19e-06 | 4.20e-01 | 0.1753 |
| 28978 | TMEM14A | GSM4909293 | Human | Breast | IDC | 6.63e-06 | 2.53e-01 | 0.1581 |
| 28978 | TMEM14A | GSM4909296 | Human | Breast | IDC | 1.54e-02 | 1.44e-01 | 0.1524 |
| 28978 | TMEM14A | GSM4909297 | Human | Breast | IDC | 3.29e-03 | 3.67e-02 | 0.1517 |
| 28978 | TMEM14A | GSM4909301 | Human | Breast | IDC | 6.96e-06 | 3.60e-01 | 0.1577 |
| 28978 | TMEM14A | GSM4909306 | Human | Breast | IDC | 4.71e-04 | 3.55e-01 | 0.1564 |
| 28978 | TMEM14A | GSM4909307 | Human | Breast | IDC | 6.89e-20 | 6.32e-01 | 0.1569 |
| 28978 | TMEM14A | GSM4909308 | Human | Breast | IDC | 2.78e-30 | 6.81e-01 | 0.158 |
| 28978 | TMEM14A | GSM4909311 | Human | Breast | IDC | 4.30e-09 | -1.48e-01 | 0.1534 |
| 28978 | TMEM14A | GSM4909319 | Human | Breast | IDC | 1.17e-18 | -5.70e-02 | 0.1563 |
| 28978 | TMEM14A | GSM4909321 | Human | Breast | IDC | 2.60e-08 | 2.91e-01 | 0.1559 |
| 28978 | TMEM14A | brca2 | Human | Breast | Precancer | 2.54e-03 | 1.35e-01 | -0.024 |
| 28978 | TMEM14A | NCCBC5 | Human | Breast | DCIS | 1.08e-02 | 5.13e-02 | 0.2046 |
| 28978 | TMEM14A | P1 | Human | Breast | IDC | 1.40e-03 | -1.78e-01 | 0.1527 |
| 28978 | TMEM14A | DCIS2 | Human | Breast | DCIS | 5.62e-27 | -4.71e-02 | 0.0085 |
| 28978 | TMEM14A | LZE2T | Human | Esophagus | ESCC | 7.73e-10 | 2.22e+00 | 0.082 |
| 28978 | TMEM14A | LZE4T | Human | Esophagus | ESCC | 1.73e-17 | 8.74e-01 | 0.0811 |
| Page: 1 2 3 4 5 6 7 8 |
| Tissue | Expression Dynamics | Abbreviation |
| Breast | 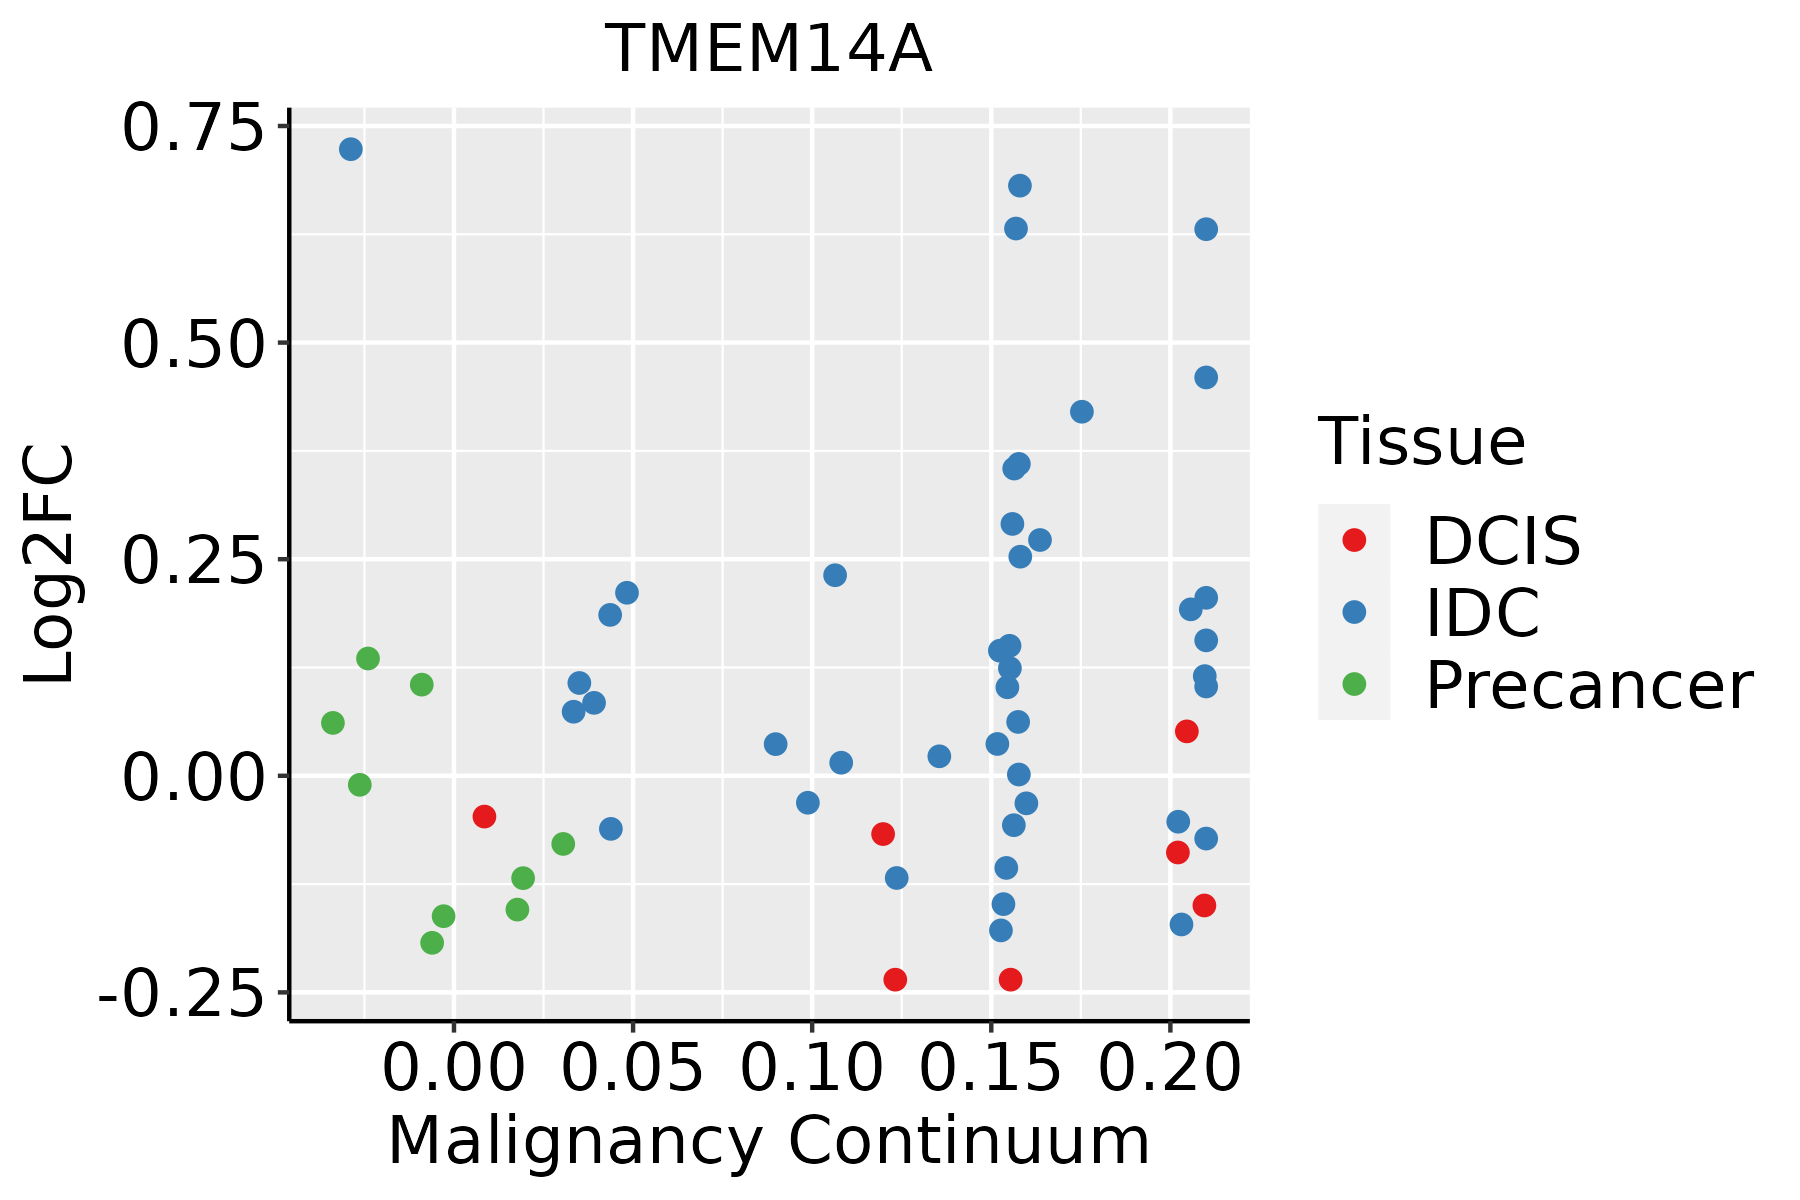 | IDC: Invasive ductal carcinoma |
| DCIS: Ductal carcinoma in situ | ||
| Precancer(BRCA1-mut): Precancerous lesion from BRCA1 mutation carriers | ||
| Esophagus |  | ESCC: Esophageal squamous cell carcinoma |
| HGIN: High-grade intraepithelial neoplasias | ||
| LGIN: Low-grade intraepithelial neoplasias | ||
| GC | 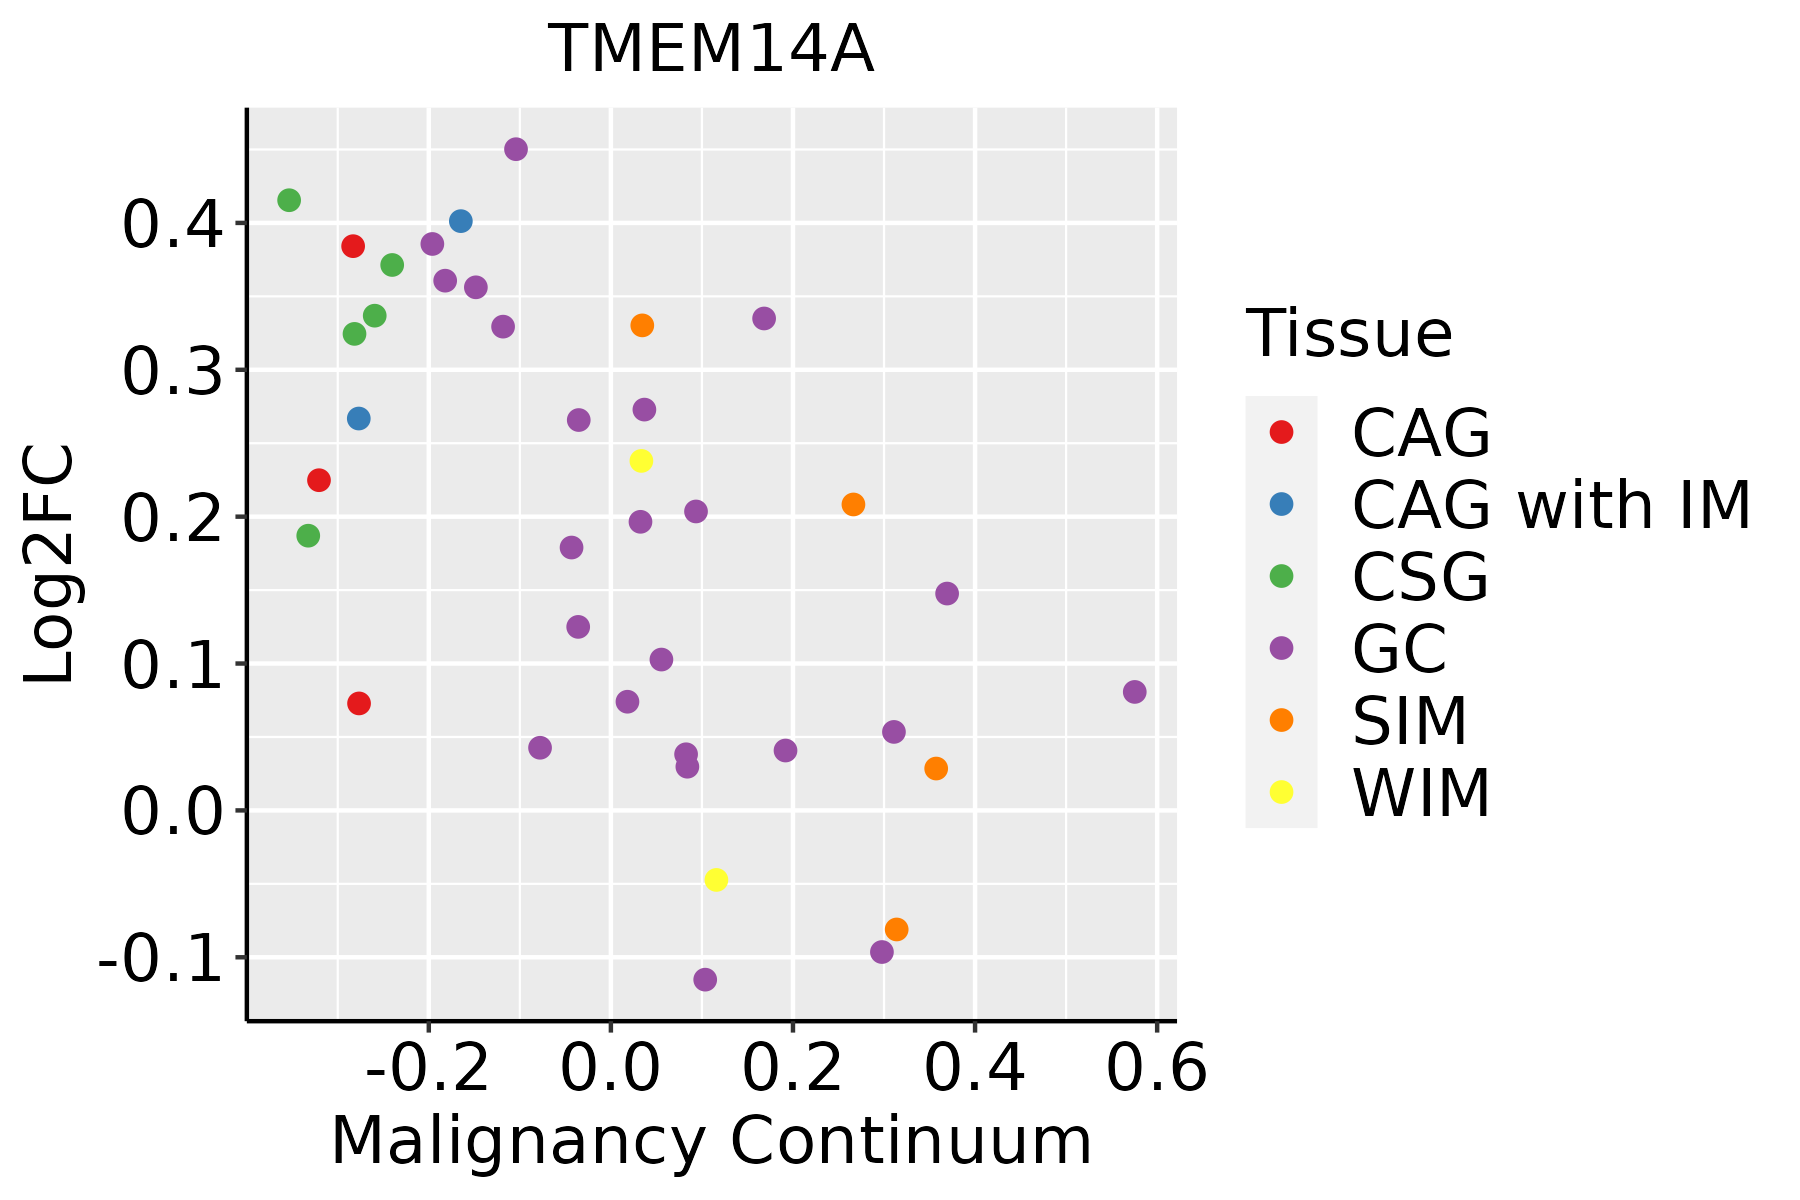 | CAG: Chronic atrophic gastritis |
| CAG with IM: Chronic atrophic gastritis with intestinal metaplasia | ||
| CSG: Chronic superficial gastritis | ||
| GC: Gastric cancer | ||
| SIM: Severe intestinal metaplasia | ||
| WIM: Wild intestinal metaplasia | ||
| Liver | 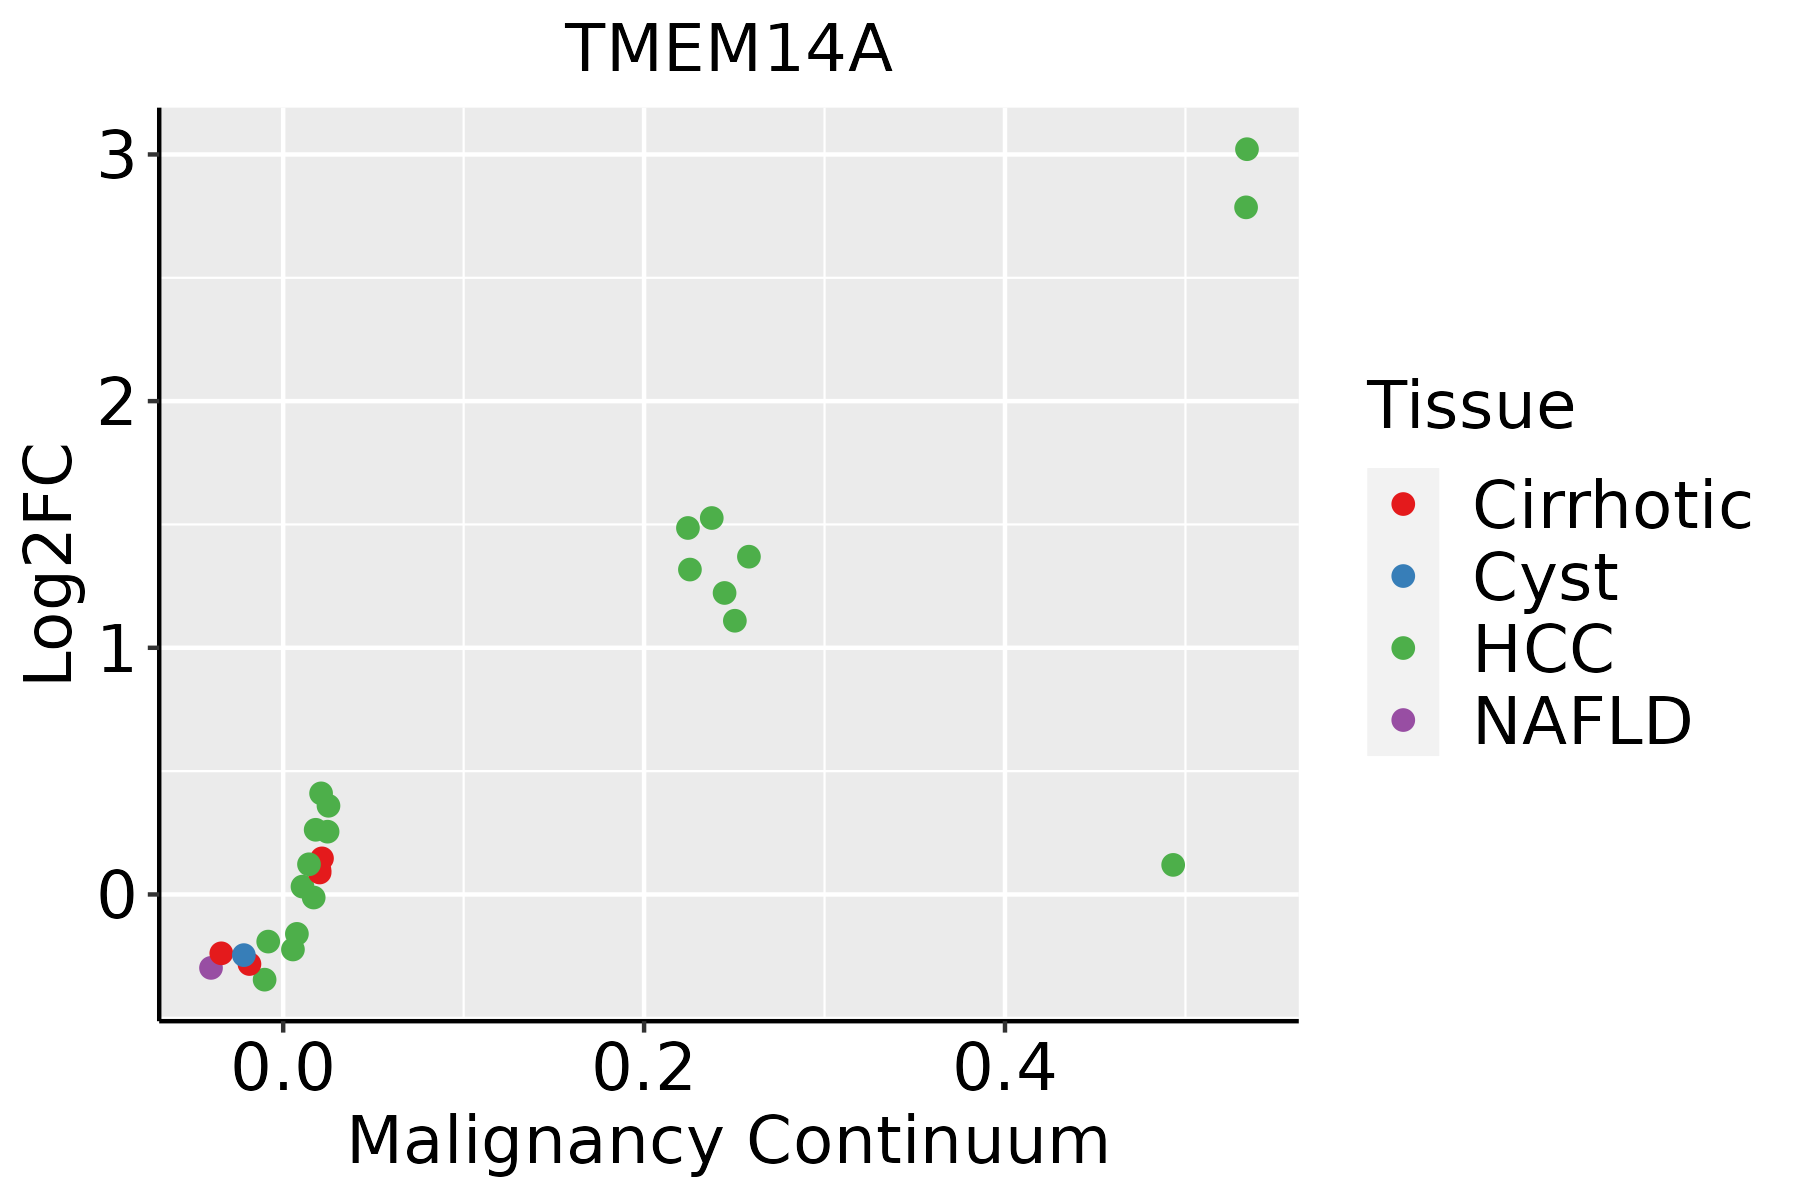 | HCC: Hepatocellular carcinoma |
| NAFLD: Non-alcoholic fatty liver disease | ||
| Oral Cavity |  | EOLP: Erosive Oral lichen planus |
| LP: leukoplakia | ||
| NEOLP: Non-erosive oral lichen planus | ||
| OSCC: Oral squamous cell carcinoma | ||
| Skin | 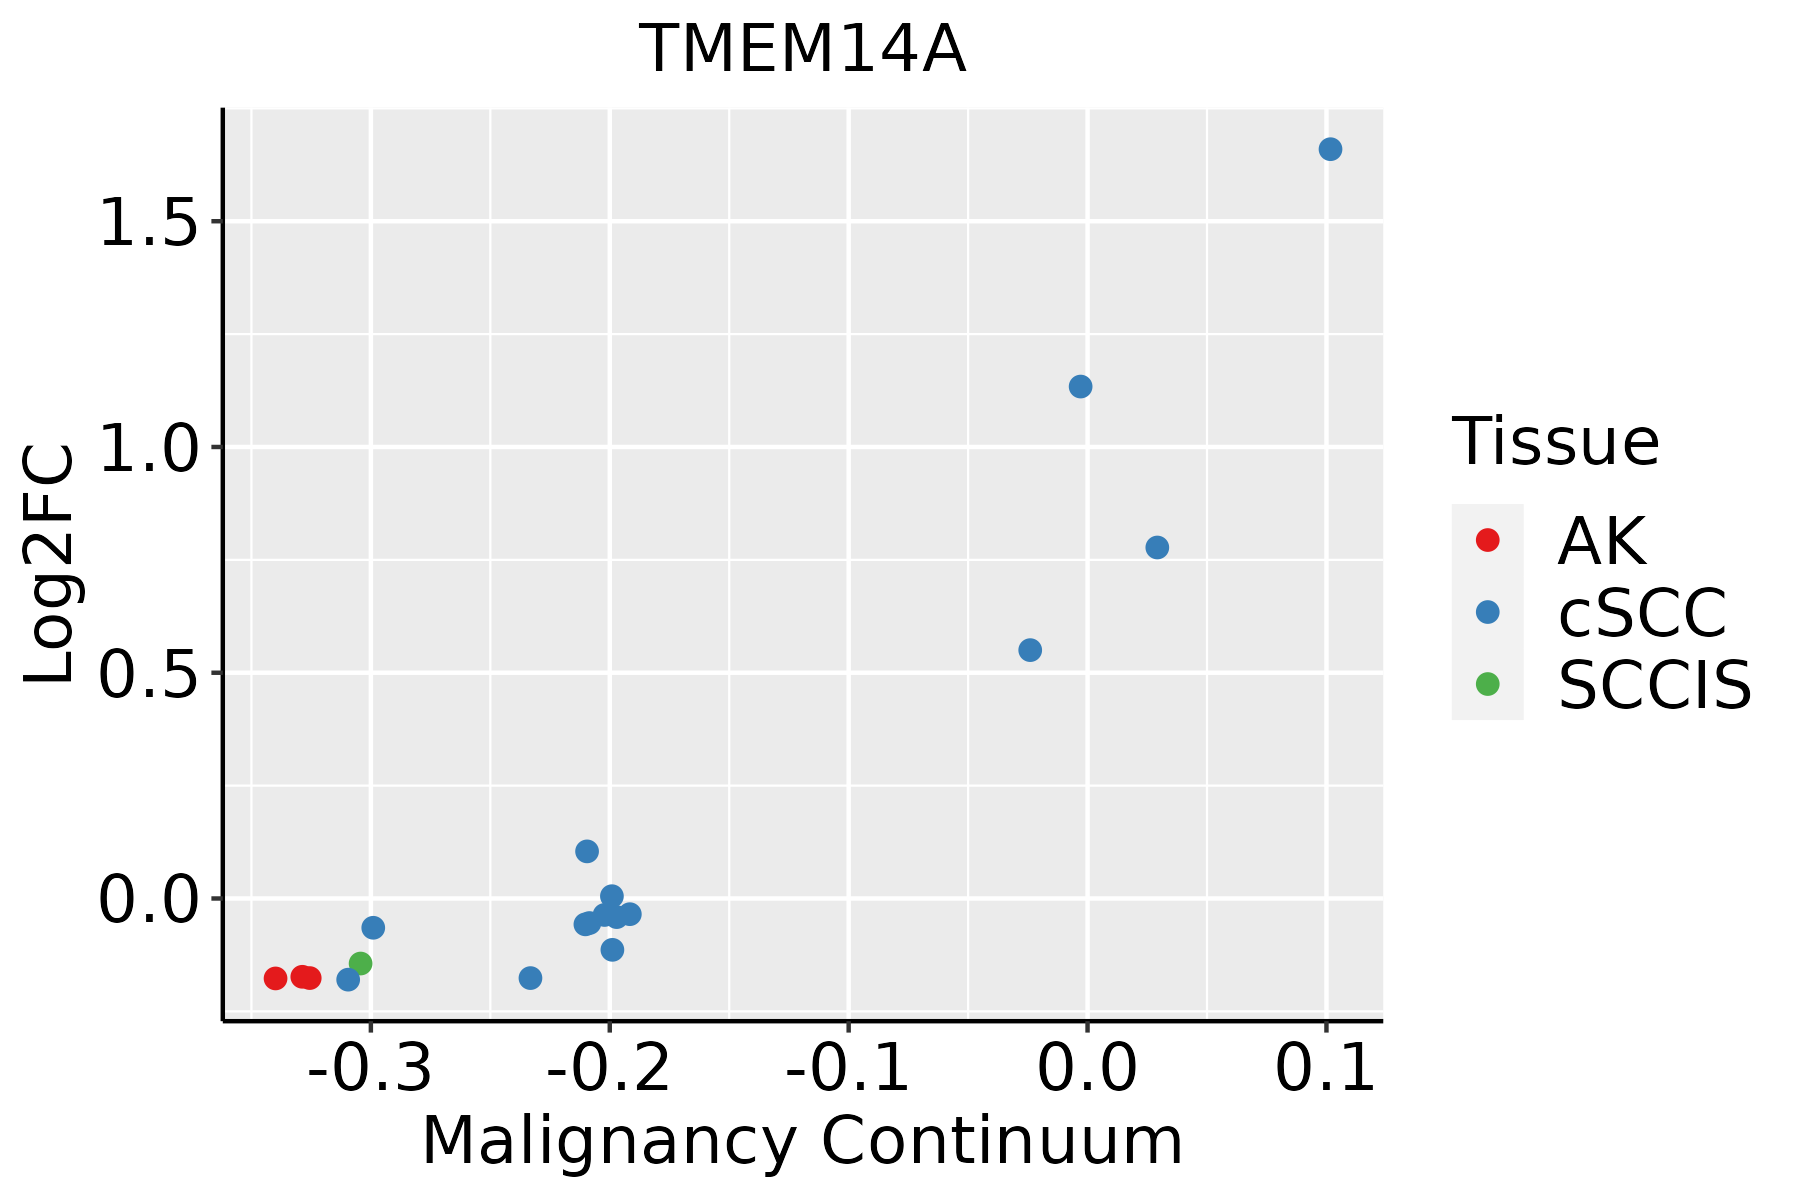 | AK: Actinic keratosis |
| cSCC: Cutaneous squamous cell carcinoma | ||
| SCCIS:squamous cell carcinoma in situ |
| ∗log2FC in expression of this searched gene in stem-like cells from each diseased tissue sample relative to stem-like cells in normal samples in each tissue plotted against the malignancy continuum. Samples are colored based on if they are from different disease stage. |
Top |
Malignant transformation related pathway analysis |
| Find out the enriched GO biological processes and KEGG pathways involved in transition from healthy to precancer to cancer |
| Tissue | Disease Stage | Enriched GO biological Processes |
| Colorectum | AD |  |
| Colorectum | SER |  |
| Colorectum | MSS |  |
| Colorectum | MSI-H |  |
| Colorectum | FAP |  |
| ∗Top 15 enriched GO BP terms are showed in the bar plot of each disease state in each tissue. Each row represents a significant GO biological process which is colored according to the -log10(p.adjust). |
| Page: 1 2 3 4 5 6 7 8 9 |
| GO ID | Tissue | Disease Stage | Description | Gene Ratio | Bg Ratio | pvalue | p.adjust | Count |
| GO:20012339 | Breast | Precancer | regulation of apoptotic signaling pathway | 65/1080 | 356/18723 | 7.70e-17 | 3.17e-14 | 65 |
| GO:00068398 | Breast | Precancer | mitochondrial transport | 45/1080 | 254/18723 | 1.37e-11 | 1.88e-09 | 45 |
| GO:20012349 | Breast | Precancer | negative regulation of apoptotic signaling pathway | 39/1080 | 224/18723 | 5.35e-10 | 4.77e-08 | 39 |
| GO:00086378 | Breast | Precancer | apoptotic mitochondrial changes | 23/1080 | 107/18723 | 3.44e-08 | 2.12e-06 | 23 |
| GO:00070066 | Breast | Precancer | mitochondrial membrane organization | 20/1080 | 116/18723 | 9.88e-06 | 2.61e-04 | 20 |
| GO:00905595 | Breast | Precancer | regulation of membrane permeability | 15/1080 | 78/18723 | 3.35e-05 | 7.29e-04 | 15 |
| GO:00469025 | Breast | Precancer | regulation of mitochondrial membrane permeability | 13/1080 | 63/18723 | 5.13e-05 | 1.07e-03 | 13 |
| GO:00973456 | Breast | Precancer | mitochondrial outer membrane permeabilization | 8/1080 | 32/18723 | 3.62e-04 | 5.00e-03 | 8 |
| GO:00108217 | Breast | Precancer | regulation of mitochondrion organization | 19/1080 | 144/18723 | 6.26e-04 | 7.78e-03 | 19 |
| GO:00357945 | Breast | Precancer | positive regulation of mitochondrial membrane permeability | 9/1080 | 43/18723 | 6.51e-04 | 7.99e-03 | 9 |
| GO:19021084 | Breast | Precancer | regulation of mitochondrial membrane permeability involved in apoptotic process | 9/1080 | 45/18723 | 9.22e-04 | 1.05e-02 | 9 |
| GO:19021105 | Breast | Precancer | positive regulation of mitochondrial membrane permeability involved in apoptotic process | 8/1080 | 38/18723 | 1.24e-03 | 1.32e-02 | 8 |
| GO:19057105 | Breast | Precancer | positive regulation of membrane permeability | 9/1080 | 48/18723 | 1.49e-03 | 1.54e-02 | 9 |
| GO:00108237 | Breast | Precancer | negative regulation of mitochondrion organization | 9/1080 | 49/18723 | 1.74e-03 | 1.74e-02 | 9 |
| GO:19026866 | Breast | Precancer | mitochondrial outer membrane permeabilization involved in programmed cell death | 8/1080 | 40/18723 | 1.76e-03 | 1.74e-02 | 8 |
| GO:19010286 | Breast | Precancer | regulation of mitochondrial outer membrane permeabilization involved in apoptotic signaling pathway | 5/1080 | 21/18723 | 5.93e-03 | 4.21e-02 | 5 |
| GO:200123314 | Breast | IDC | regulation of apoptotic signaling pathway | 82/1434 | 356/18723 | 6.27e-20 | 5.93e-17 | 82 |
| GO:200123414 | Breast | IDC | negative regulation of apoptotic signaling pathway | 49/1434 | 224/18723 | 1.45e-11 | 2.58e-09 | 49 |
| GO:000683913 | Breast | IDC | mitochondrial transport | 51/1434 | 254/18723 | 1.54e-10 | 1.83e-08 | 51 |
| GO:000863713 | Breast | IDC | apoptotic mitochondrial changes | 27/1434 | 107/18723 | 2.29e-08 | 1.57e-06 | 27 |
| Page: 1 2 3 4 5 6 7 8 9 10 11 |
| Pathway ID | Tissue | Disease Stage | Description | Gene Ratio | Bg Ratio | pvalue | p.adjust | qvalue | Count |
| Page: 1 |
Top |
Cell-cell communication analysis |
| Identification of potential cell-cell interactions between two cell types and their ligand-receptor pairs for different disease states |
| Ligand | Receptor | LRpair | Pathway | Tissue | Disease Stage |
| Page: 1 |
Top |
Single-cell gene regulatory network inference analysis |
| Find out the significant the regulons (TFs) and the target genes of each regulon across cell types for different disease states |
| TF | Cell Type | Tissue | Disease Stage | Target Gene | RSS | Regulon Activity |
| ∗The dot plots of a searched regulon are shown for all cell subpopulations in each disease state of each tissue based on the regulon specific score inferred using pySCENIC and by calculating the average expression. |
| Page: 1 |
Top |
Somatic mutation of malignant transformation related genes |
| Annotation of somatic variants for genes involved in malignant transformation |
| Hugo Symbol | Variant Class | Variant Classification | dbSNP RS | HGVSc | HGVSp | HGVSp Short | SWISSPROT | BIOTYPE | SIFT | PolyPhen | Tumor Sample Barcode | Tissue | Histology | Sex | Age | Stage | Therapy Types | Drugs | Outcome |
| TMEM14A | SNV | Missense_Mutation | novel | c.275T>G | p.Leu92Arg | p.L92R | Q9Y6G1 | protein_coding | tolerated(0.34) | probably_damaging(0.999) | TCGA-AA-3950-01 | Colorectum | colon adenocarcinoma | Female | >=65 | I/II | Unknown | Unknown | SD |
| TMEM14A | SNV | Missense_Mutation | rs769068441 | c.234G>A | p.Met78Ile | p.M78I | Q9Y6G1 | protein_coding | deleterious(0.03) | benign(0.015) | TCGA-AX-A0J1-01 | Endometrium | uterine corpus endometrioid carcinoma | Female | >=65 | I/II | Unknown | Unknown | SD |
| TMEM14A | SNV | Missense_Mutation | novel | c.169C>A | p.Leu57Met | p.L57M | Q9Y6G1 | protein_coding | deleterious(0) | probably_damaging(0.992) | TCGA-B5-A1MX-01 | Endometrium | uterine corpus endometrioid carcinoma | Female | <65 | I/II | Hormone Therapy | megace | SD |
| TMEM14A | SNV | Missense_Mutation | novel | c.172N>G | p.Phe58Val | p.F58V | Q9Y6G1 | protein_coding | tolerated(0.57) | benign(0.037) | TCGA-BK-A6W3-01 | Endometrium | uterine corpus endometrioid carcinoma | Female | <65 | I/II | Unknown | Unknown | SD |
| TMEM14A | SNV | Missense_Mutation | c.236N>A | p.Pro79His | p.P79H | Q9Y6G1 | protein_coding | deleterious(0) | probably_damaging(0.999) | TCGA-95-7039-01 | Lung | lung adenocarcinoma | Female | <65 | I/II | Unknown | Unknown | PD | |
| TMEM14A | insertion | In_Frame_Ins | novel | c.260_260+1insCCTCATGATGATCCTGAGACTTGTCTTGTTGCT | p.Met89_Met90insMetIleLeuArgLeuValLeuLeuLeuLeuMet | p.M89_M90insMILRLVLLLLM | Q9Y6G1 | protein_coding | TCGA-22-4613-01 | Lung | lung squamous cell carcinoma | Female | >=65 | I/II | Unknown | Unknown | SD | ||
| TMEM14A | SNV | Missense_Mutation | novel | c.278N>C | p.Arg93Thr | p.R93T | Q9Y6G1 | protein_coding | deleterious(0) | probably_damaging(0.995) | TCGA-CV-5440-01 | Oral cavity | head & neck squamous cell carcinoma | Male | <65 | I/II | Chemotherapy | paclitaxel | SD |
| Page: 1 |
Top |
Related drugs of malignant transformation related genes |
| Identification of chemicals and drugs interact with genes involved in malignant transfromation |
| (DGIdb 4.0) |
| Entrez ID | Symbol | Category | Interaction Types | Drug Claim Name | Drug Name | PMIDs |
| Page: 1 |

Copyright 2023-Present -The University of Texas Health Science Center at Houston |