
|
|||||
|
 | |
| |
| |
| |
| |
| |
|
Gene: TMEM147 |
Gene summary for TMEM147 |
| Gene information | Species | Human | Gene symbol | TMEM147 | Gene ID | 10430 |
| Gene name | transmembrane protein 147 | |
| Gene Alias | NIFIE14 | |
| Cytomap | 19q13.12 | |
| Gene Type | protein-coding | GO ID | GO:0005575 | UniProtAcc | Q9BVK8 |
Top |
Malignant transformation analysis |
| Identification of the aberrant gene expression in precancerous and cancerous lesions by comparing the gene expression of stem-like cells in diseased tissues with normal stem cells |
| Entrez ID | Symbol | Replicates | Species | Organ | Tissue | Adj P-value | Log2FC | Malignancy |
| 10430 | TMEM147 | HTA11_3410_2000001011 | Human | Colorectum | AD | 3.24e-18 | 3.86e-01 | 0.0155 |
| 10430 | TMEM147 | HTA11_2487_2000001011 | Human | Colorectum | SER | 1.67e-15 | 5.63e-01 | -0.1808 |
| 10430 | TMEM147 | HTA11_2951_2000001011 | Human | Colorectum | AD | 4.45e-02 | 3.11e-01 | 0.0216 |
| 10430 | TMEM147 | HTA11_1938_2000001011 | Human | Colorectum | AD | 1.06e-11 | 4.16e-01 | -0.0811 |
| 10430 | TMEM147 | HTA11_347_2000001011 | Human | Colorectum | AD | 2.70e-18 | 4.21e-01 | -0.1954 |
| 10430 | TMEM147 | HTA11_411_2000001011 | Human | Colorectum | SER | 3.90e-04 | 5.45e-01 | -0.2602 |
| 10430 | TMEM147 | HTA11_2112_2000001011 | Human | Colorectum | SER | 3.60e-03 | 5.09e-01 | -0.2196 |
| 10430 | TMEM147 | HTA11_3361_2000001011 | Human | Colorectum | AD | 1.05e-09 | 4.59e-01 | -0.1207 |
| 10430 | TMEM147 | HTA11_83_2000001011 | Human | Colorectum | SER | 1.49e-11 | 4.52e-01 | -0.1526 |
| 10430 | TMEM147 | HTA11_696_2000001011 | Human | Colorectum | AD | 2.23e-34 | 6.83e-01 | -0.1464 |
| 10430 | TMEM147 | HTA11_866_2000001011 | Human | Colorectum | AD | 7.73e-14 | 3.09e-01 | -0.1001 |
| 10430 | TMEM147 | HTA11_1391_2000001011 | Human | Colorectum | AD | 5.71e-31 | 8.94e-01 | -0.059 |
| 10430 | TMEM147 | HTA11_2992_2000001011 | Human | Colorectum | SER | 3.37e-12 | 5.98e-01 | -0.1706 |
| 10430 | TMEM147 | HTA11_5212_2000001011 | Human | Colorectum | AD | 9.56e-07 | 3.97e-01 | -0.2061 |
| 10430 | TMEM147 | HTA11_5216_2000001011 | Human | Colorectum | SER | 1.08e-07 | 5.14e-01 | -0.1462 |
| 10430 | TMEM147 | HTA11_546_2000001011 | Human | Colorectum | AD | 8.11e-07 | 4.81e-01 | -0.0842 |
| 10430 | TMEM147 | HTA11_7862_2000001011 | Human | Colorectum | AD | 7.85e-08 | 3.95e-01 | -0.0179 |
| 10430 | TMEM147 | HTA11_866_3004761011 | Human | Colorectum | AD | 4.28e-19 | 5.07e-01 | 0.096 |
| 10430 | TMEM147 | HTA11_4255_2000001011 | Human | Colorectum | SER | 7.92e-05 | 4.16e-01 | 0.0446 |
| 10430 | TMEM147 | HTA11_9408_2000001011 | Human | Colorectum | AD | 6.78e-04 | 4.11e-01 | 0.0451 |
| Page: 1 2 3 4 5 6 7 8 9 10 |
| Tissue | Expression Dynamics | Abbreviation |
| Colorectum (GSE201348) |  | FAP: Familial adenomatous polyposis |
| CRC: Colorectal cancer | ||
| Colorectum (HTA11) | 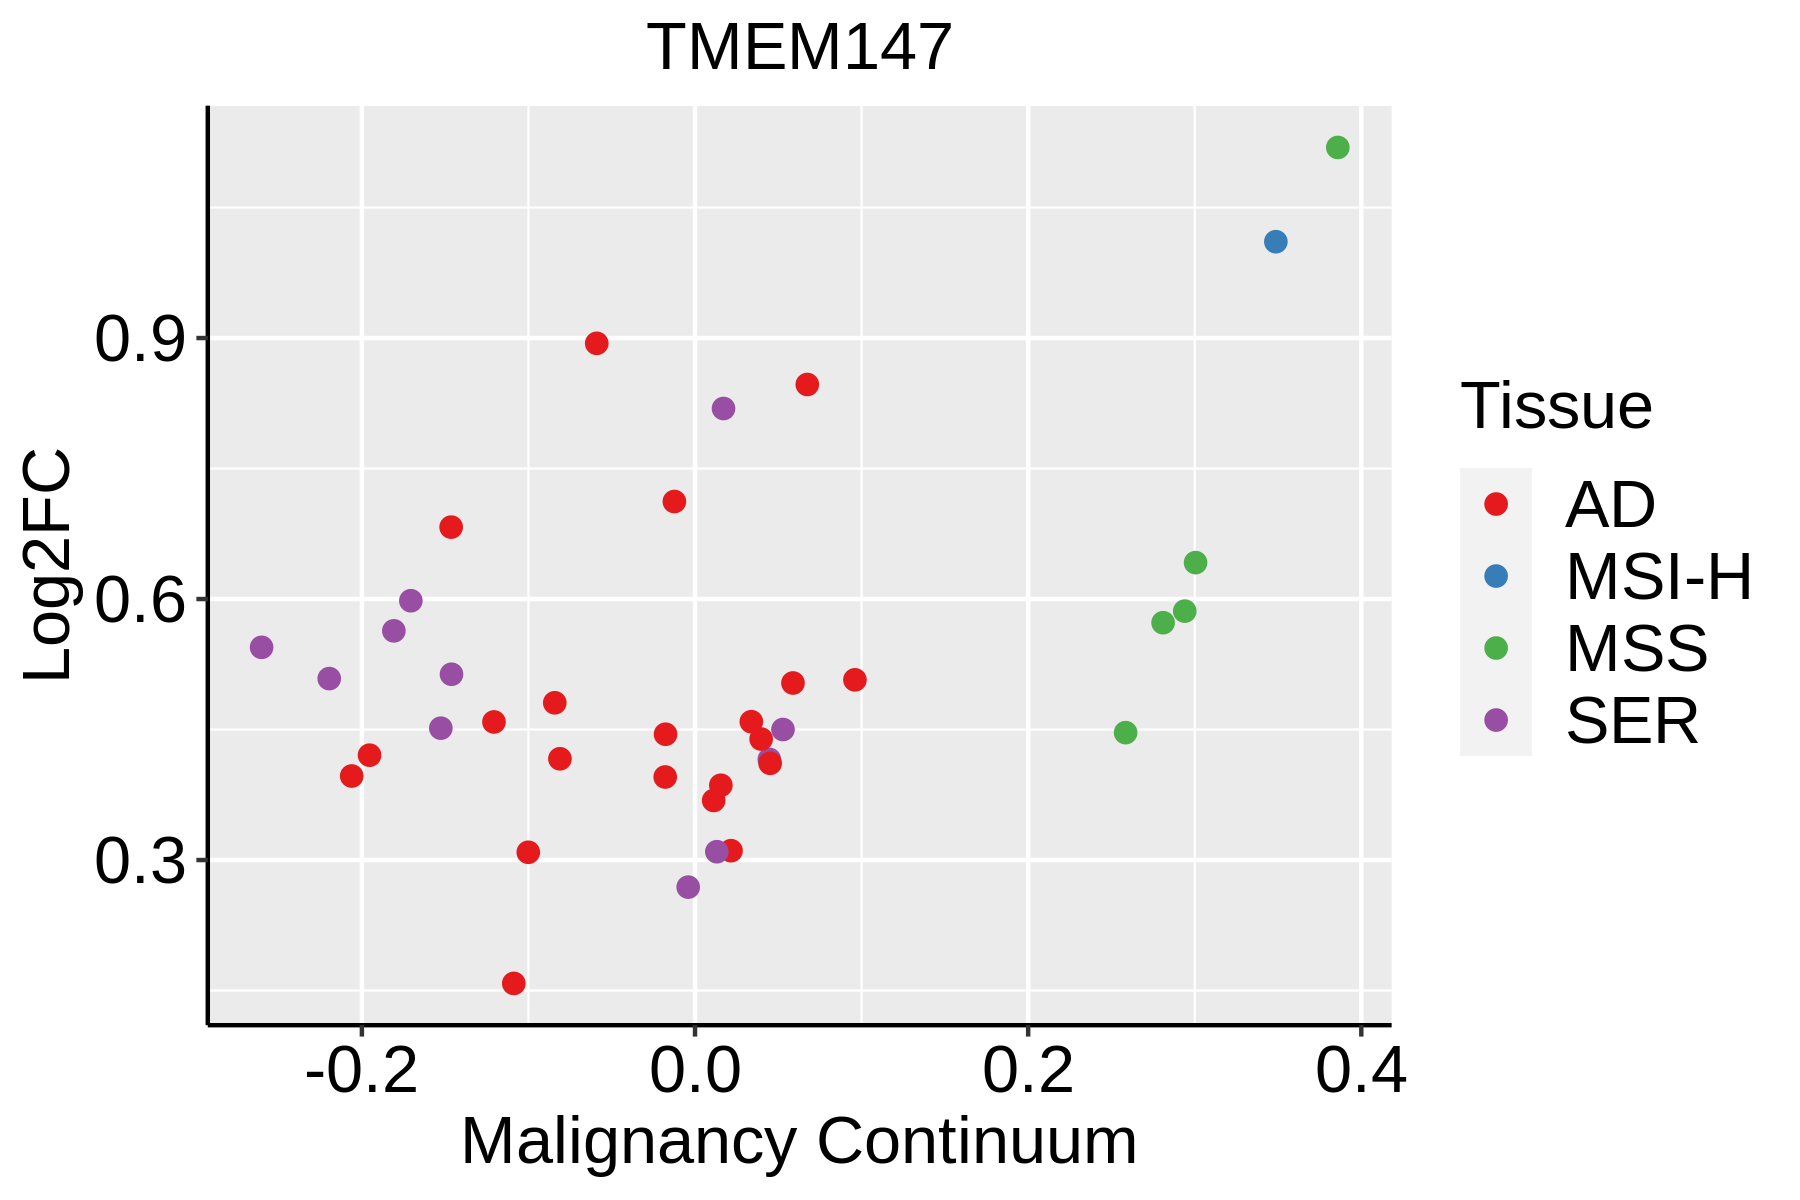 | AD: Adenomas |
| SER: Sessile serrated lesions | ||
| MSI-H: Microsatellite-high colorectal cancer | ||
| MSS: Microsatellite stable colorectal cancer | ||
| Endometrium | 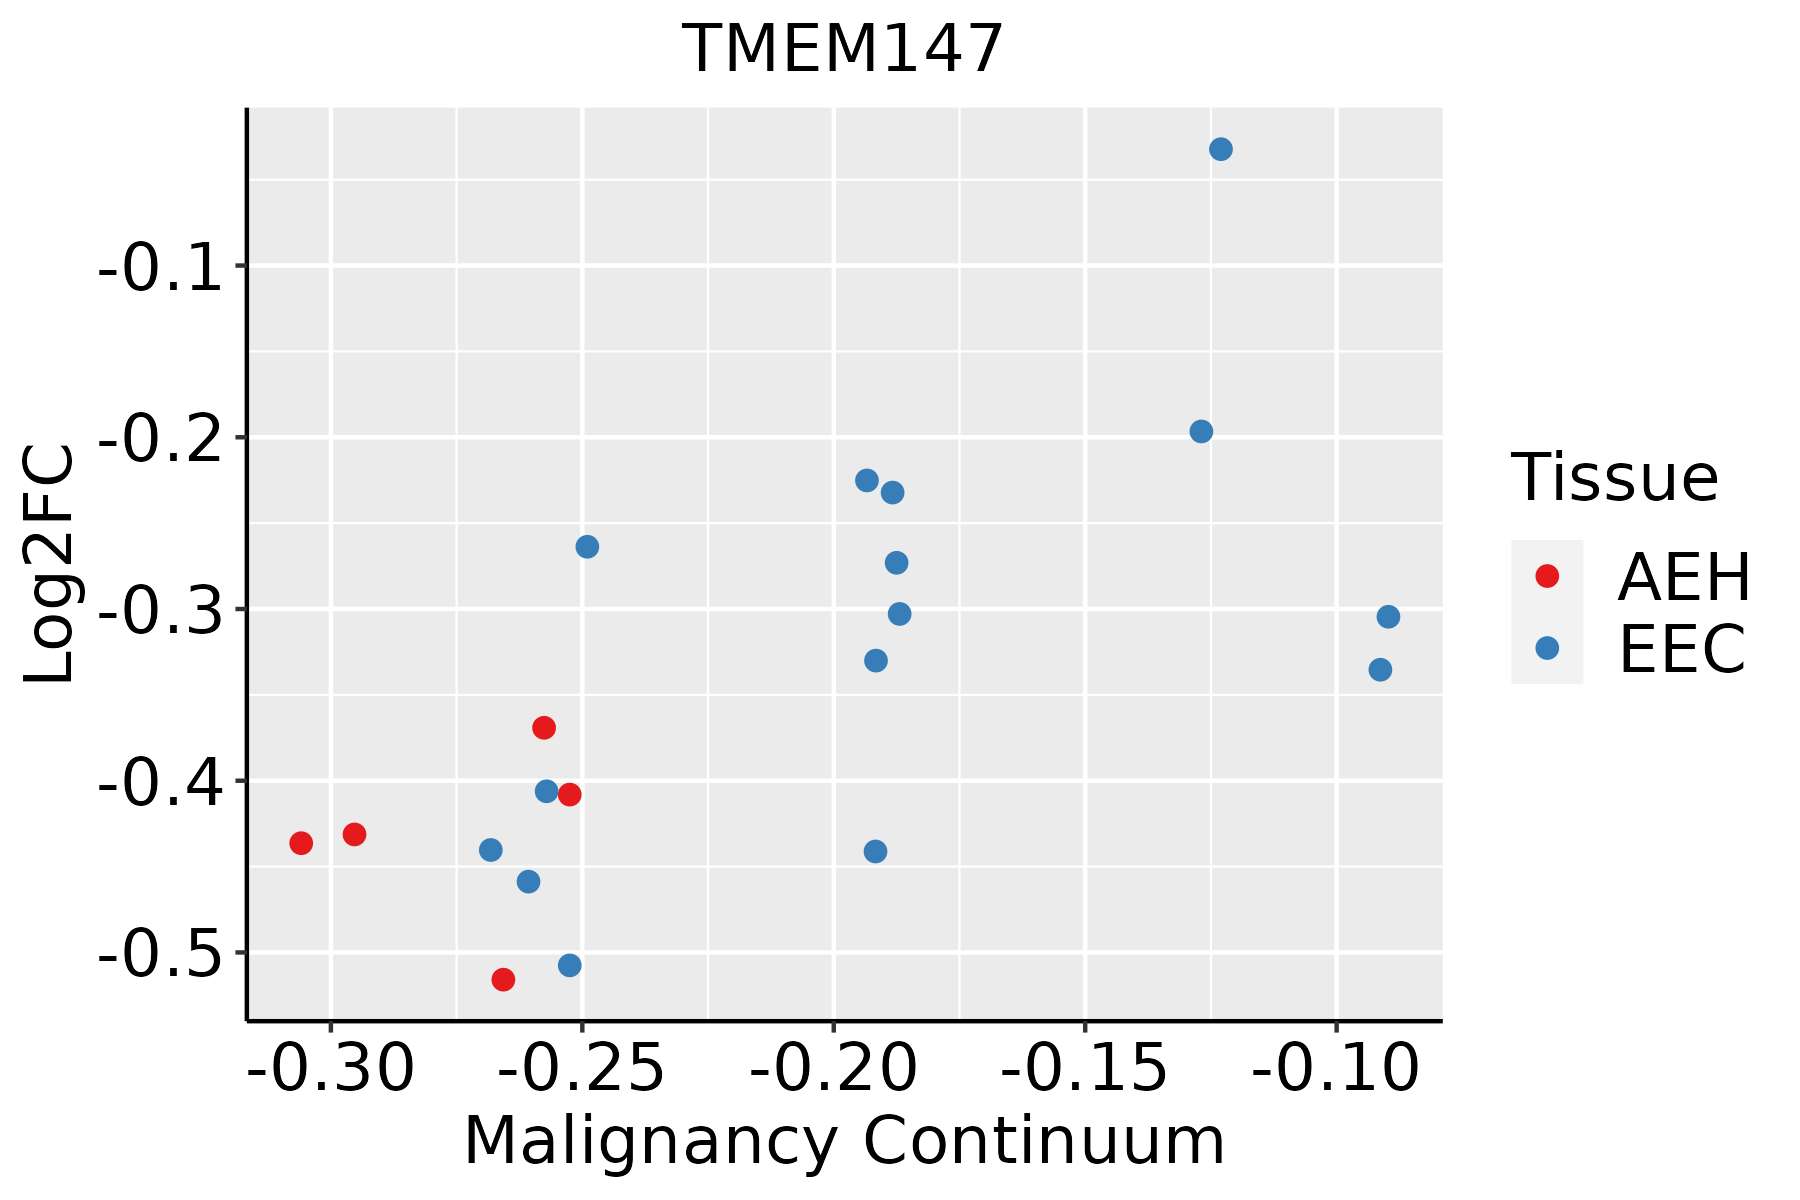 | AEH: Atypical endometrial hyperplasia |
| EEC: Endometrioid Cancer | ||
| Esophagus | 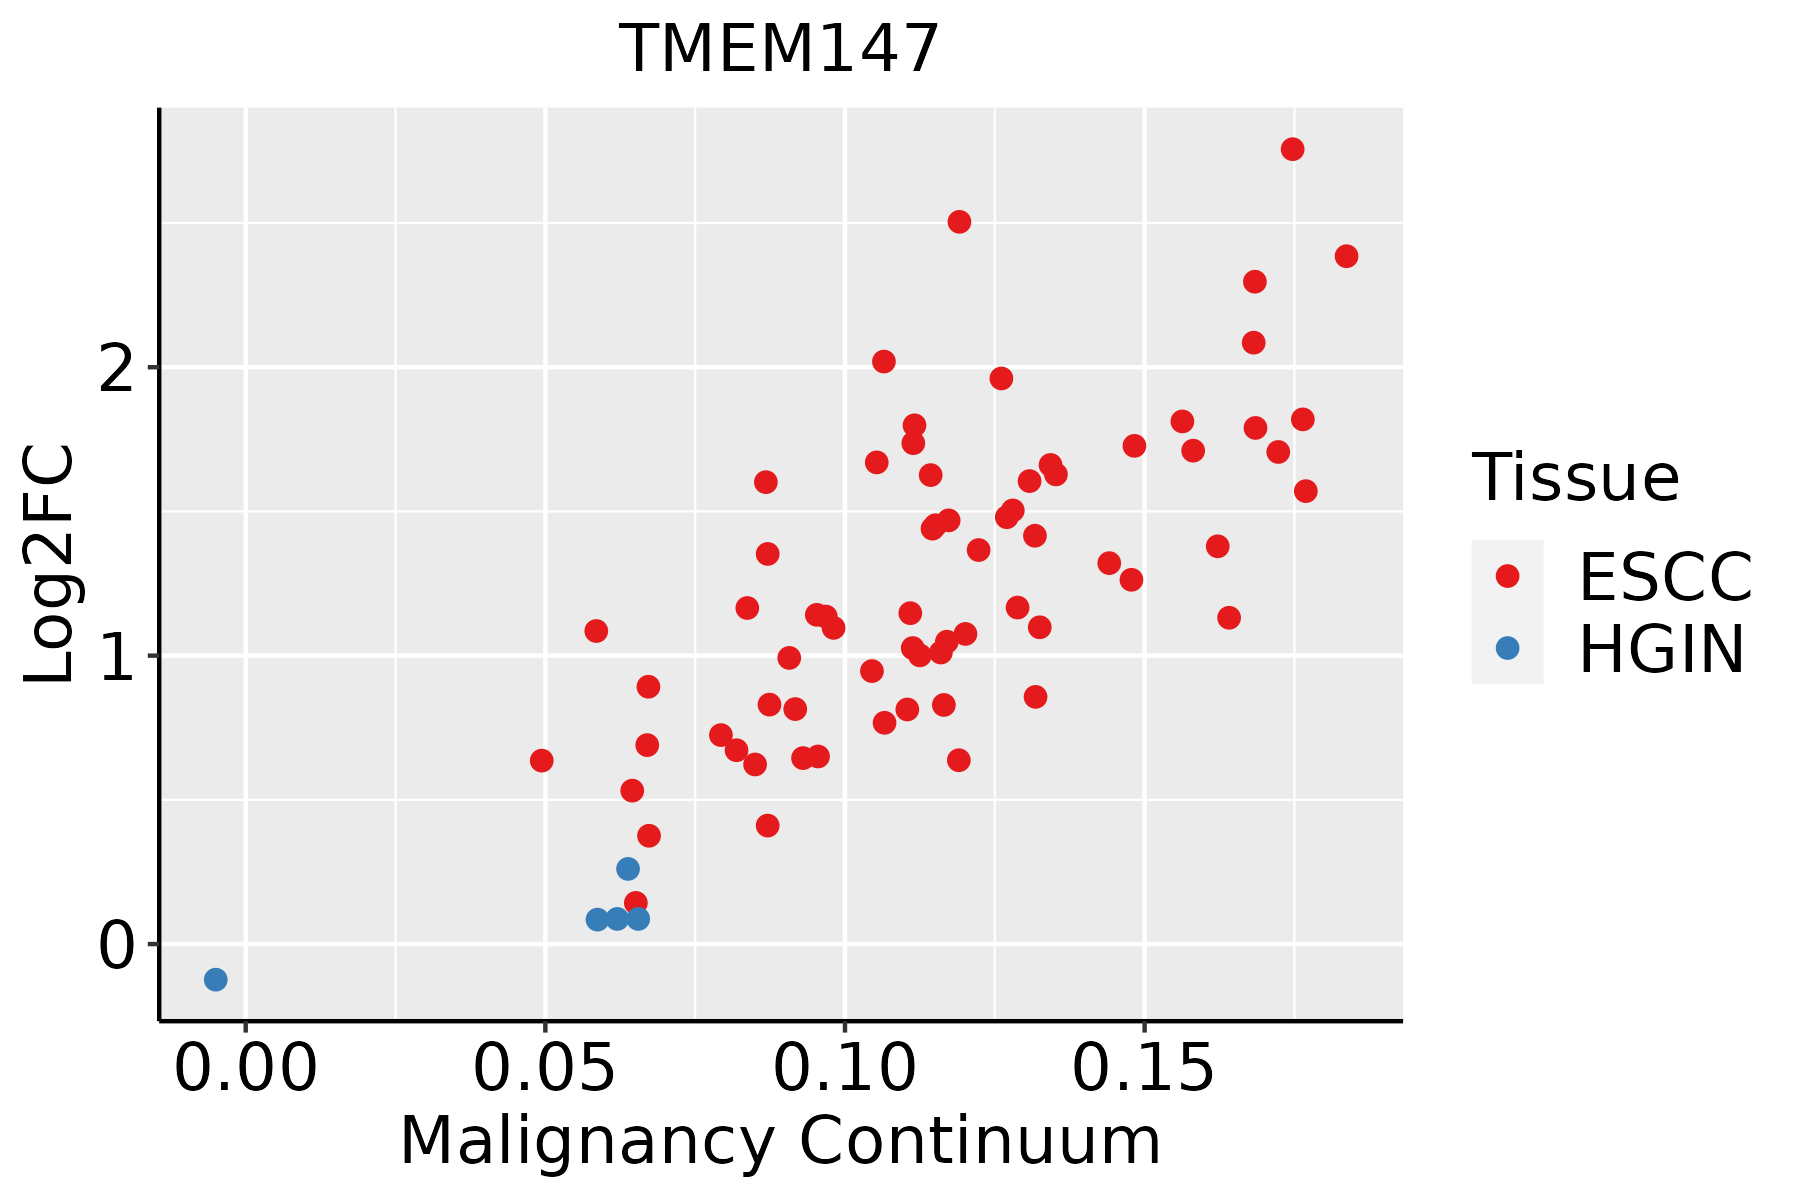 | ESCC: Esophageal squamous cell carcinoma |
| HGIN: High-grade intraepithelial neoplasias | ||
| LGIN: Low-grade intraepithelial neoplasias | ||
| Liver |  | HCC: Hepatocellular carcinoma |
| NAFLD: Non-alcoholic fatty liver disease | ||
| Oral Cavity | 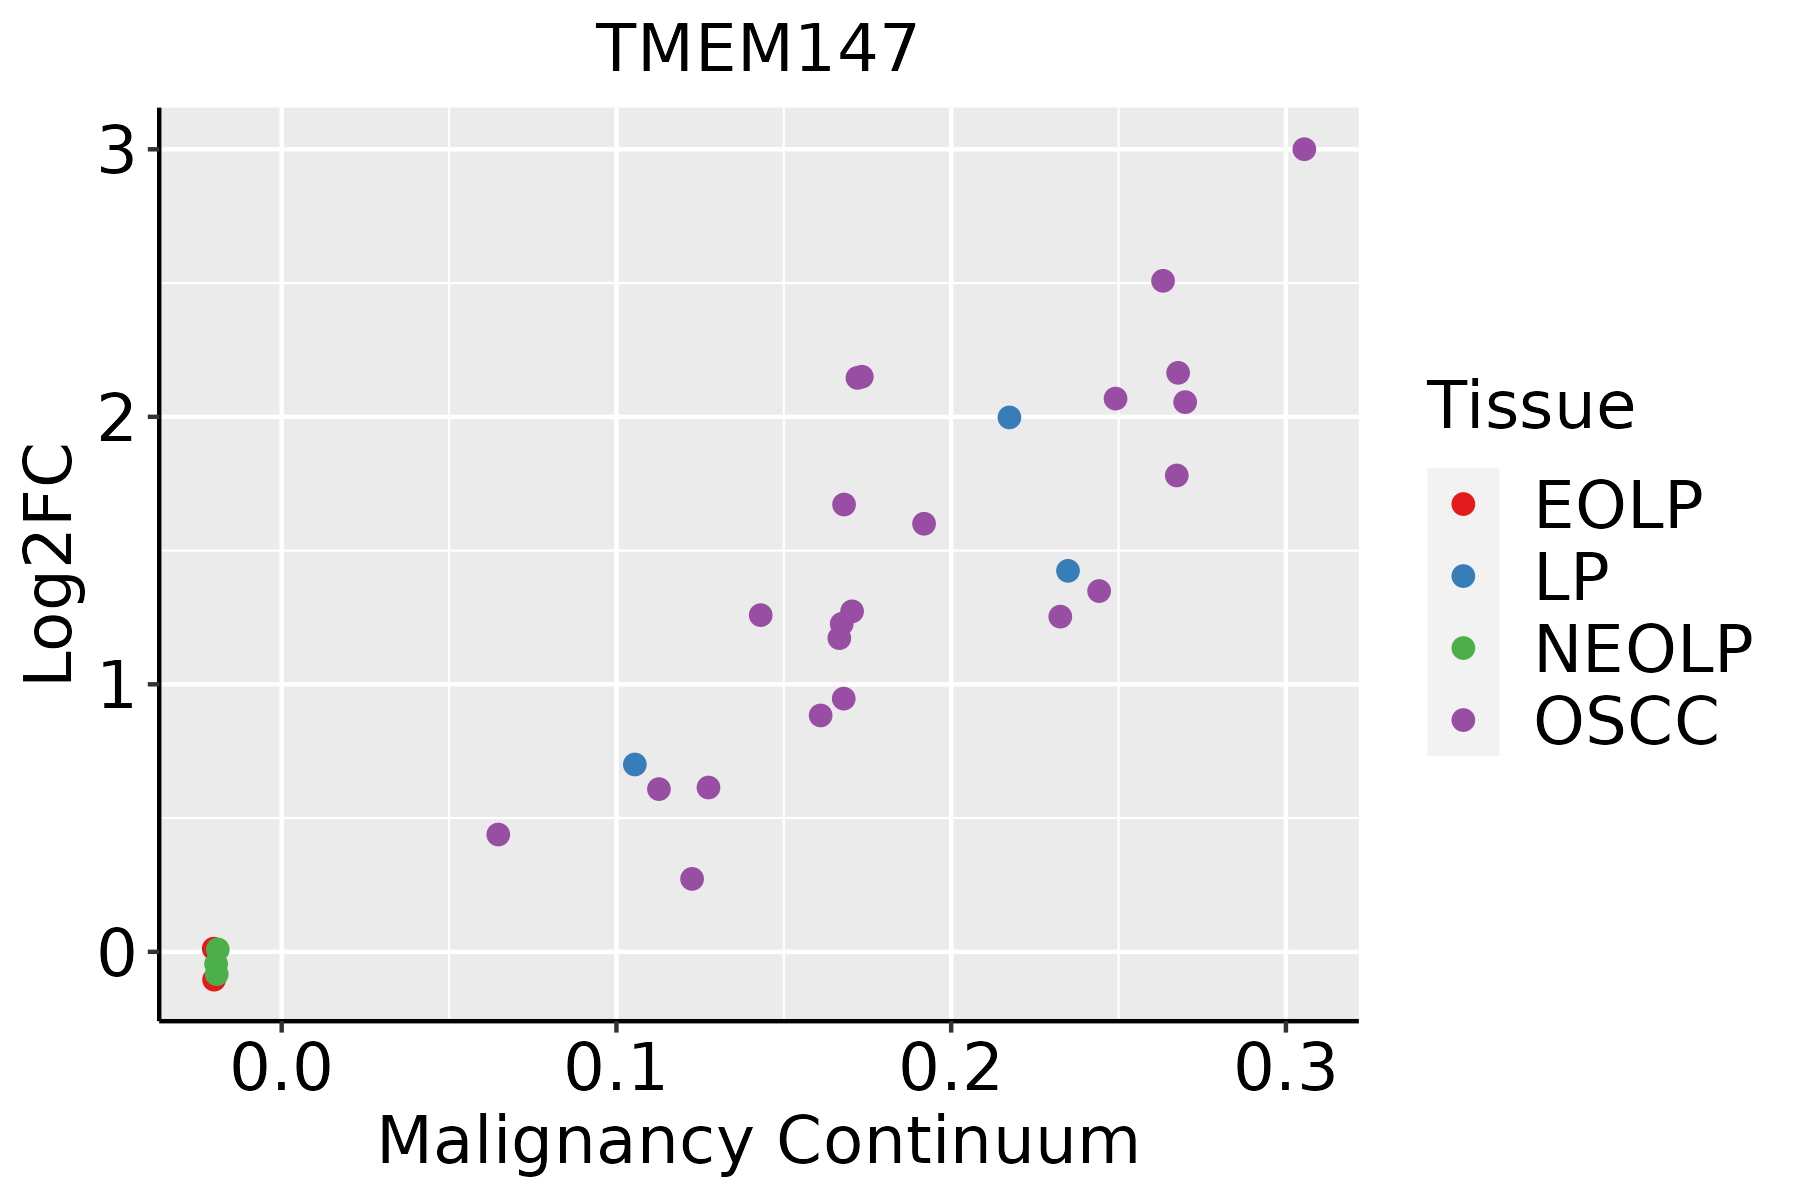 | EOLP: Erosive Oral lichen planus |
| LP: leukoplakia | ||
| NEOLP: Non-erosive oral lichen planus | ||
| OSCC: Oral squamous cell carcinoma | ||
| Prostate | 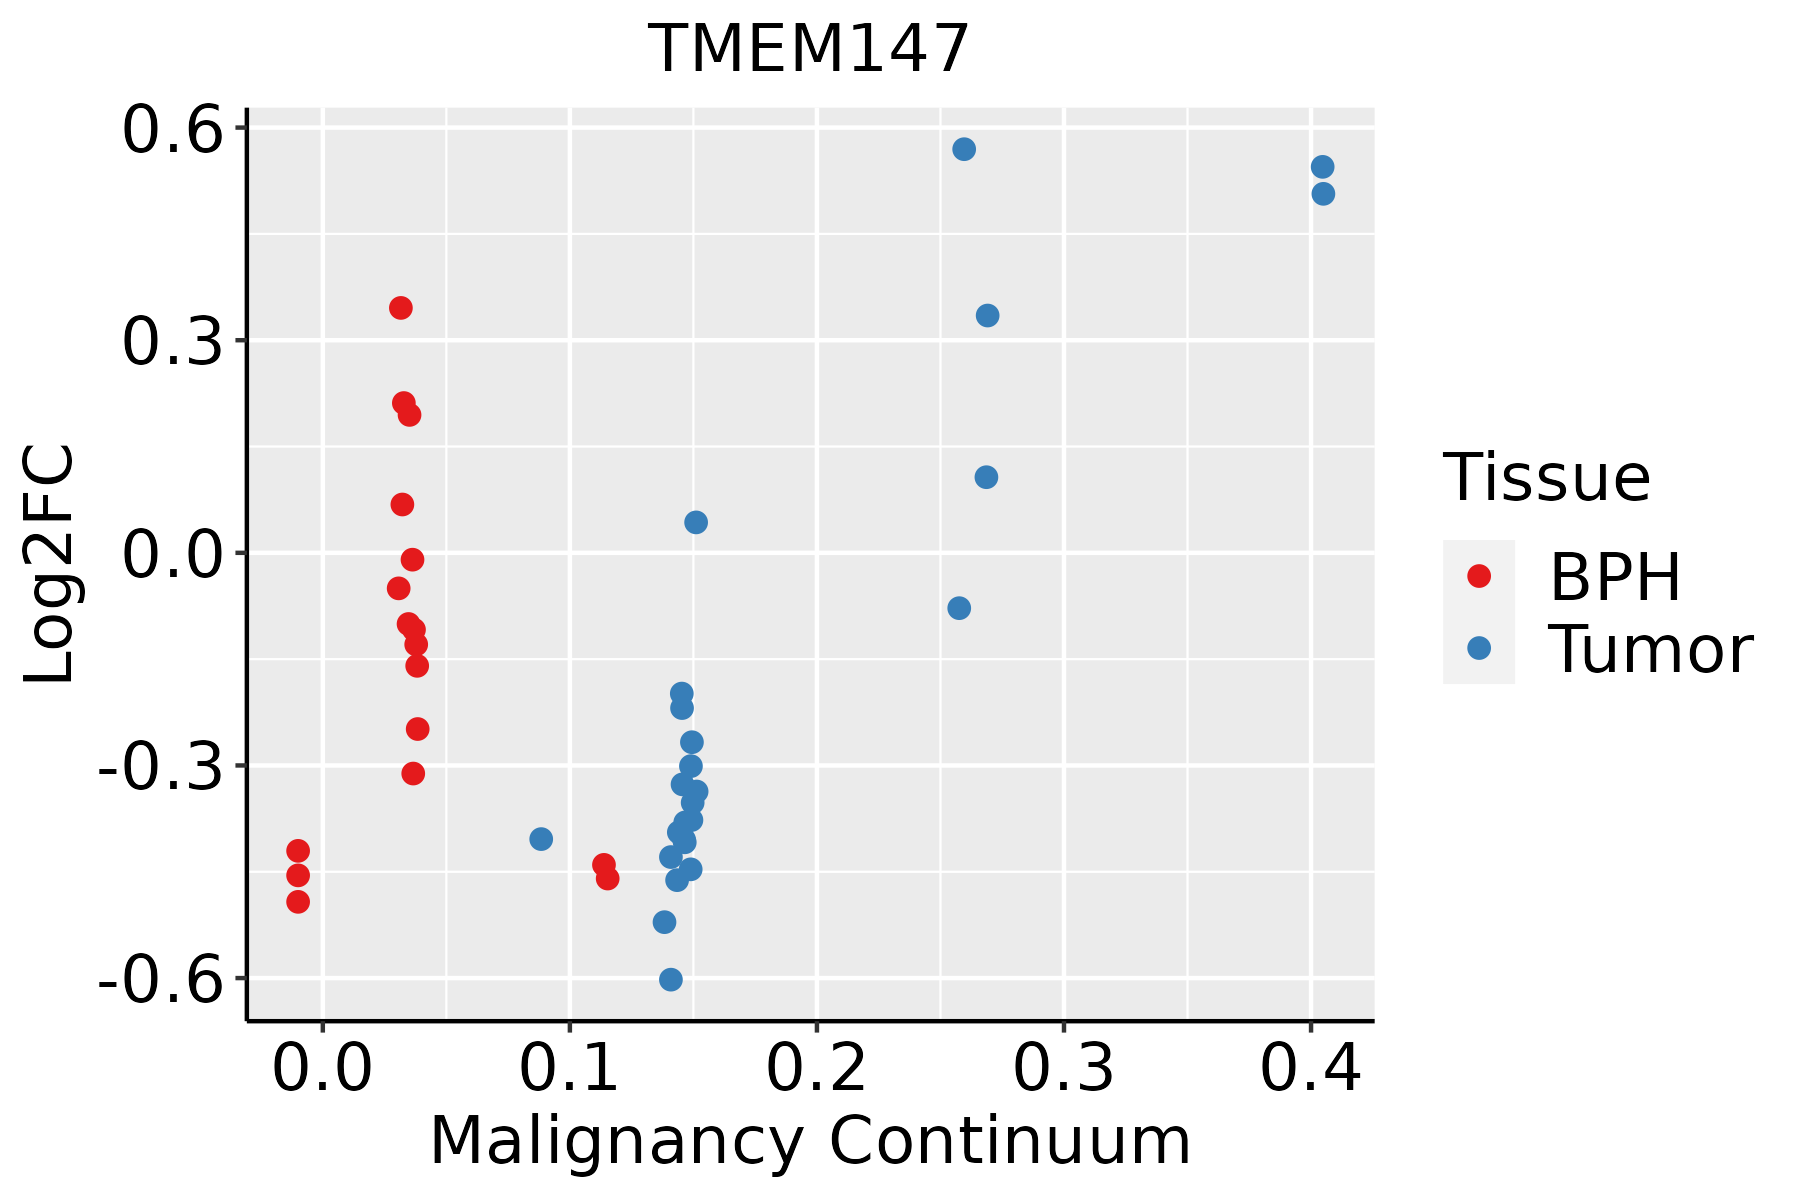 | BPH: Benign Prostatic Hyperplasia |
| Skin | 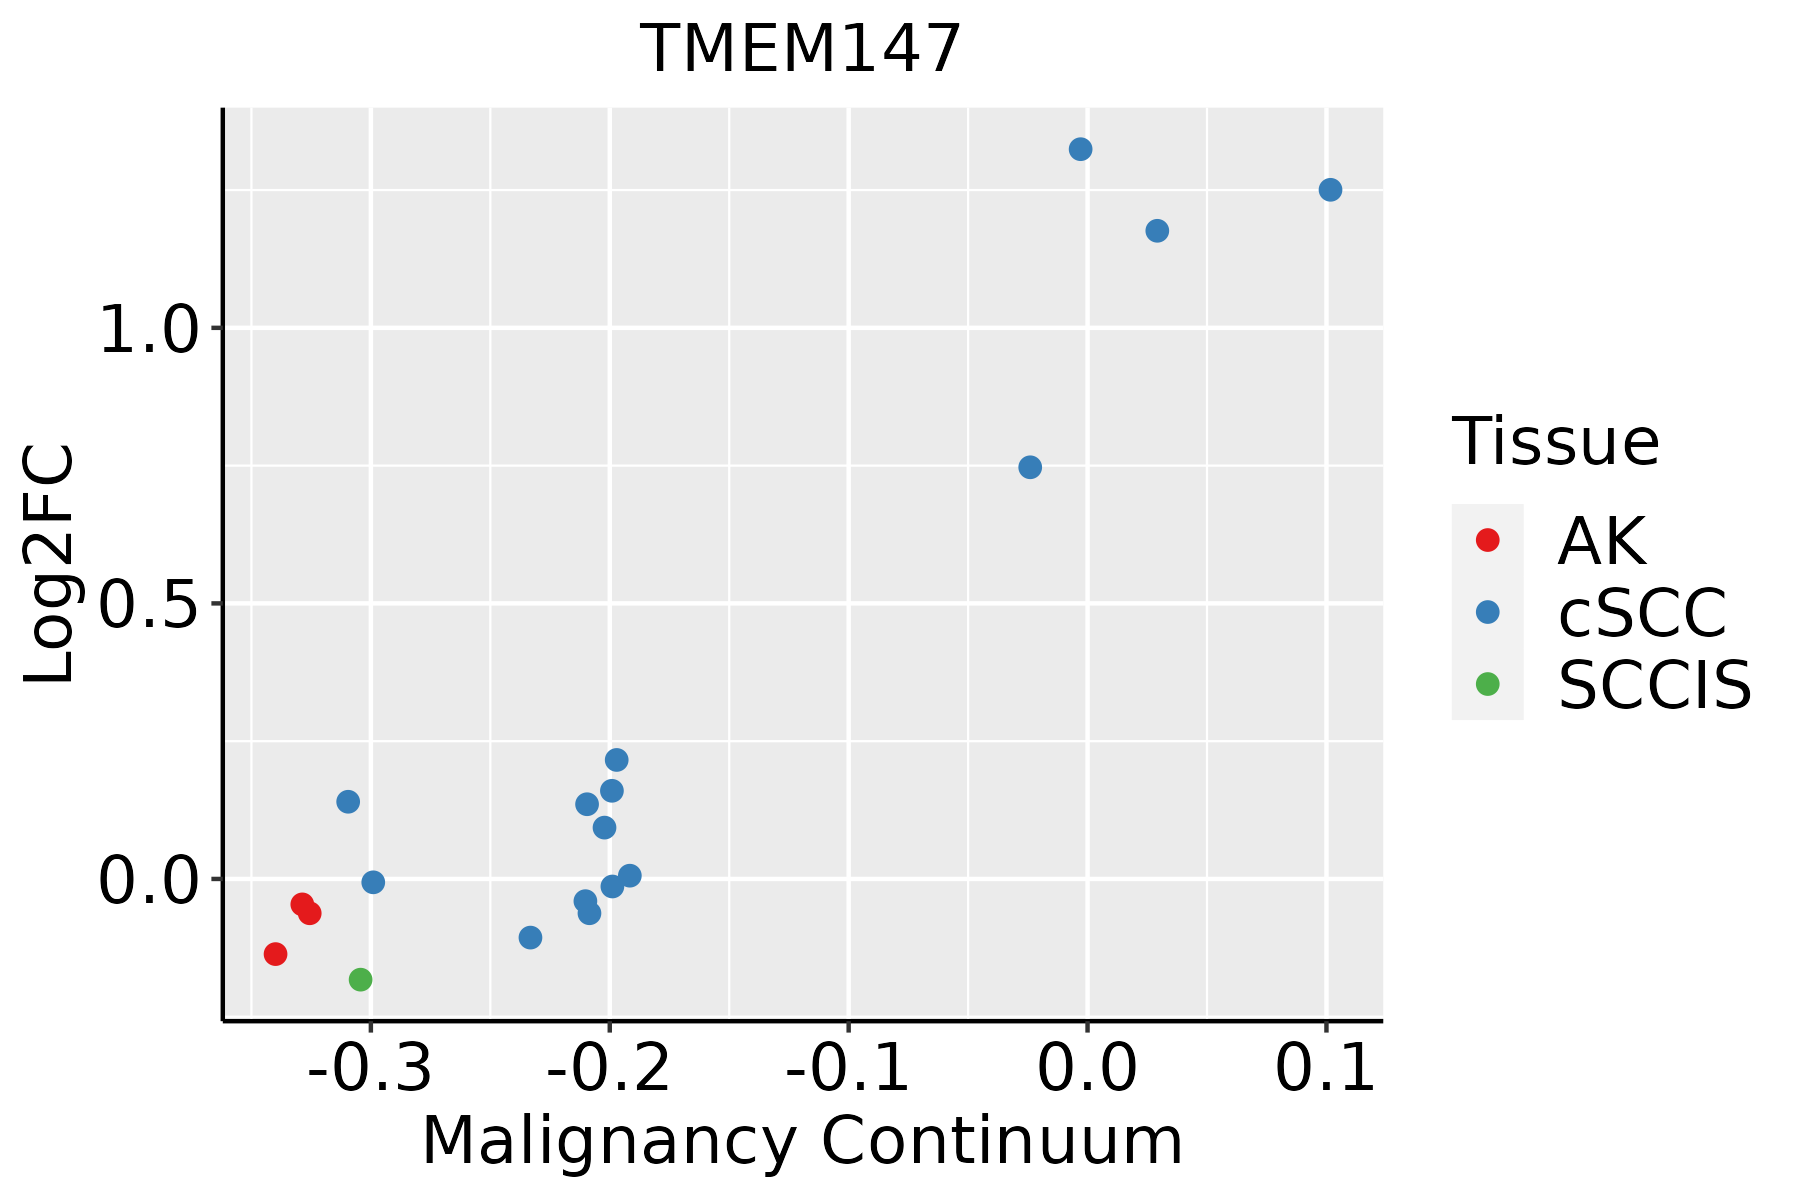 | AK: Actinic keratosis |
| cSCC: Cutaneous squamous cell carcinoma | ||
| SCCIS:squamous cell carcinoma in situ | ||
| Thyroid | 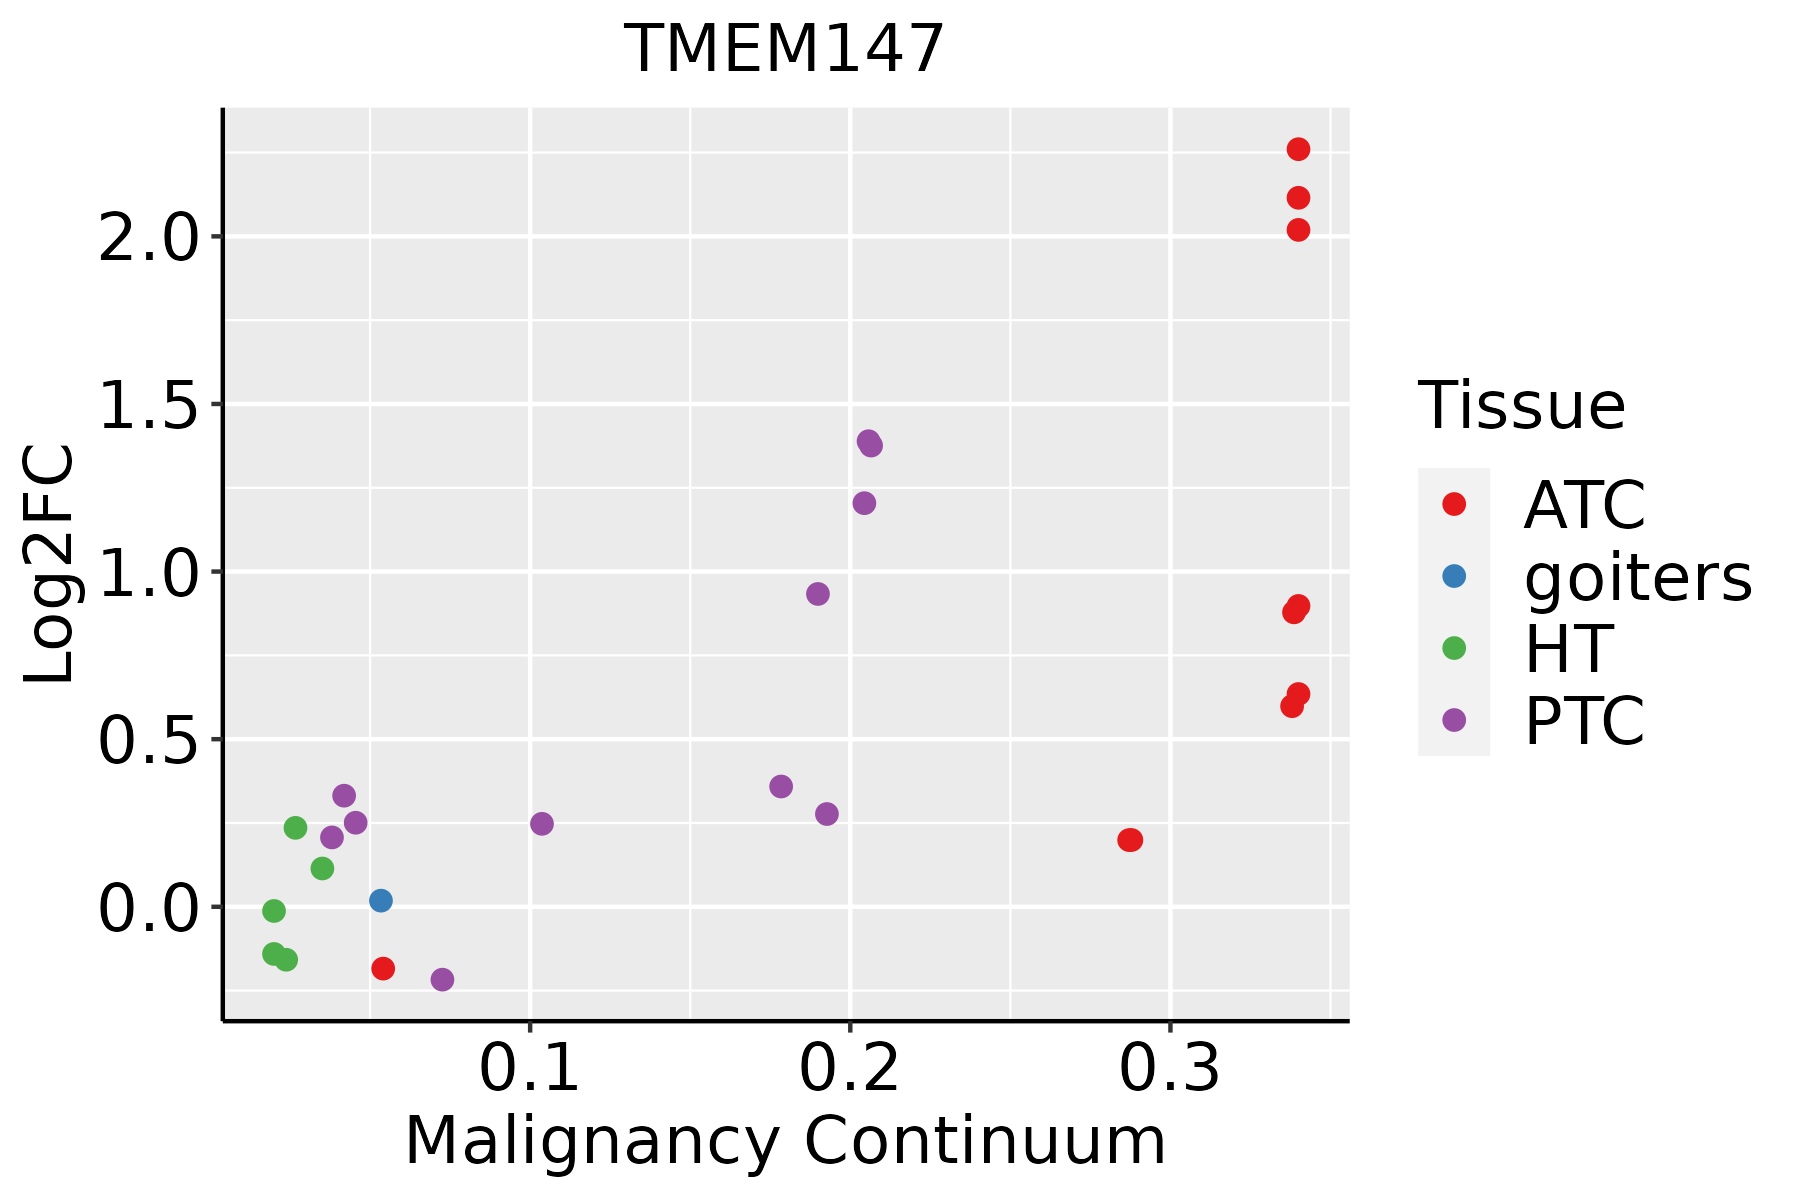 | ATC: Anaplastic thyroid cancer |
| HT: Hashimoto's thyroiditis | ||
| PTC: Papillary thyroid cancer |
| ∗log2FC in expression of this searched gene in stem-like cells from each diseased tissue sample relative to stem-like cells in normal samples in each tissue plotted against the malignancy continuum. Samples are colored based on if they are from different disease stage. |
Top |
Malignant transformation related pathway analysis |
| Find out the enriched GO biological processes and KEGG pathways involved in transition from healthy to precancer to cancer |
| Tissue | Disease Stage | Enriched GO biological Processes |
| Colorectum | AD |  |
| Colorectum | SER |  |
| Colorectum | MSS |  |
| Colorectum | MSI-H |  |
| Colorectum | FAP |  |
| ∗Top 15 enriched GO BP terms are showed in the bar plot of each disease state in each tissue. Each row represents a significant GO biological process which is colored according to the -log10(p.adjust). |
| Page: 1 2 3 4 5 6 7 8 9 |
| GO ID | Tissue | Disease Stage | Description | Gene Ratio | Bg Ratio | pvalue | p.adjust | Count |
| Page: 1 |
| Pathway ID | Tissue | Disease Stage | Description | Gene Ratio | Bg Ratio | pvalue | p.adjust | qvalue | Count |
| Page: 1 |
Top |
Cell-cell communication analysis |
| Identification of potential cell-cell interactions between two cell types and their ligand-receptor pairs for different disease states |
| Ligand | Receptor | LRpair | Pathway | Tissue | Disease Stage |
| Page: 1 |
Top |
Single-cell gene regulatory network inference analysis |
| Find out the significant the regulons (TFs) and the target genes of each regulon across cell types for different disease states |
| TF | Cell Type | Tissue | Disease Stage | Target Gene | RSS | Regulon Activity |
| ∗The dot plots of a searched regulon are shown for all cell subpopulations in each disease state of each tissue based on the regulon specific score inferred using pySCENIC and by calculating the average expression. |
| Page: 1 |
Top |
Somatic mutation of malignant transformation related genes |
| Annotation of somatic variants for genes involved in malignant transformation |
| Hugo Symbol | Variant Class | Variant Classification | dbSNP RS | HGVSc | HGVSp | HGVSp Short | SWISSPROT | BIOTYPE | SIFT | PolyPhen | Tumor Sample Barcode | Tissue | Histology | Sex | Age | Stage | Therapy Types | Drugs | Outcome |
| TMEM147 | SNV | Missense_Mutation | rs748318840 | c.473N>A | p.Arg158His | p.R158H | Q9BVK8 | protein_coding | deleterious(0) | probably_damaging(0.999) | TCGA-AN-A0AK-01 | Breast | breast invasive carcinoma | Female | >=65 | I/II | Unknown | Unknown | SD |
| TMEM147 | insertion | In_Frame_Ins | novel | c.72_73insTTACTC | p.Ser24_Gly25insLeuLeu | p.S24_G25insLL | Q9BVK8 | protein_coding | TCGA-AN-A0FS-01 | Breast | breast invasive carcinoma | Female | <65 | I/II | Unknown | Unknown | SD | ||
| TMEM147 | insertion | In_Frame_Ins | novel | c.73_74insATC | p.Gly25delinsAspArg | p.G25delinsDR | Q9BVK8 | protein_coding | TCGA-AN-A0FS-01 | Breast | breast invasive carcinoma | Female | <65 | I/II | Unknown | Unknown | SD | ||
| TMEM147 | insertion | Frame_Shift_Ins | novel | c.441_442insCCTCACCTTGAAGTGACCTCTTTCTGCTTTCT | p.Val148ProfsTer19 | p.V148Pfs*19 | Q9BVK8 | protein_coding | TCGA-AO-A0JB-01 | Breast | breast invasive carcinoma | Female | <65 | III/IV | Chemotherapy | cyclophosphamide | SD | ||
| TMEM147 | SNV | Missense_Mutation | c.156N>A | p.Phe52Leu | p.F52L | Q9BVK8 | protein_coding | tolerated(0.68) | benign(0.063) | TCGA-FU-A3HZ-01 | Cervix | cervical & endocervical cancer | Female | <65 | I/II | Chemotherapy | cisplatin | CR | |
| TMEM147 | insertion | Frame_Shift_Ins | novel | c.119_120insGCAGTGG | p.Thr41GlnfsTer28 | p.T41Qfs*28 | Q9BVK8 | protein_coding | TCGA-DS-A1OD-01 | Cervix | cervical & endocervical cancer | Female | <65 | I/II | Chemotherapy | cisplatin | SD | ||
| TMEM147 | SNV | Missense_Mutation | rs760506450 | c.572N>T | p.Ser191Leu | p.S191L | Q9BVK8 | protein_coding | tolerated(0.41) | benign(0) | TCGA-A6-2686-01 | Colorectum | colon adenocarcinoma | Female | >=65 | I/II | Unknown | Unknown | SD |
| TMEM147 | SNV | Missense_Mutation | c.446N>T | p.Ala149Val | p.A149V | Q9BVK8 | protein_coding | tolerated(0.56) | benign(0.007) | TCGA-AA-3680-01 | Colorectum | colon adenocarcinoma | Female | >=65 | III/IV | Chemotherapy | folinic | PD | |
| TMEM147 | SNV | Missense_Mutation | c.599N>T | p.Ala200Val | p.A200V | Q9BVK8 | protein_coding | tolerated(0.89) | benign(0) | TCGA-CK-4951-01 | Colorectum | colon adenocarcinoma | Female | >=65 | I/II | Unknown | Unknown | PD | |
| TMEM147 | SNV | Missense_Mutation | c.446N>T | p.Ala149Val | p.A149V | Q9BVK8 | protein_coding | tolerated(0.56) | benign(0.007) | TCGA-CM-4743-01 | Colorectum | colon adenocarcinoma | Male | >=65 | I/II | Chemotherapy | capecitabine | SD |
| Page: 1 2 3 |
Top |
Related drugs of malignant transformation related genes |
| Identification of chemicals and drugs interact with genes involved in malignant transfromation |
| (DGIdb 4.0) |
| Entrez ID | Symbol | Category | Interaction Types | Drug Claim Name | Drug Name | PMIDs |
| Page: 1 |

Copyright 2023-Present -The University of Texas Health Science Center at Houston |