
|
|||||
|
 | |
| |
| |
| |
| |
| |
|
Gene: TMEM132D |
Gene summary for TMEM132D |
| Gene information | Species | Human | Gene symbol | TMEM132D | Gene ID | 121256 |
| Gene name | transmembrane protein 132D | |
| Gene Alias | MOLT | |
| Cytomap | 12q24.33 | |
| Gene Type | protein-coding | GO ID | GO:0005575 | UniProtAcc | Q14C87 |
Top |
Malignant transformation analysis |
| Identification of the aberrant gene expression in precancerous and cancerous lesions by comparing the gene expression of stem-like cells in diseased tissues with normal stem cells |
| Entrez ID | Symbol | Replicates | Species | Organ | Tissue | Adj P-value | Log2FC | Malignancy |
| 121256 | TMEM132D | RNA-P23T2-P23T2-4 | Human | Lung | MIAC | 4.84e-05 | 1.34e+00 | -0.0272 |
| 121256 | TMEM132D | RNA-P24T2-P24T2-2 | Human | Lung | IAC | 4.72e-06 | 1.42e+00 | 0.0057 |
| 121256 | TMEM132D | RNA-P5T2-P5T2-1 | Human | Lung | MIAC | 2.56e-04 | 1.44e+00 | -0.0135 |
| 121256 | TMEM132D | RNA-P6T1-P6T1-1 | Human | Lung | MIAC | 6.72e-03 | 9.50e-01 | -0.0238 |
| 121256 | TMEM132D | RNA-P6T1-P6T1-4 | Human | Lung | MIAC | 1.36e-02 | 8.16e-01 | -0.0263 |
| 121256 | TMEM132D | RNA-P7T1-P7T1-1 | Human | Lung | AIS | 1.69e-05 | 7.75e-01 | -0.0961 |
| 121256 | TMEM132D | RNA-P7T1-P7T1-2 | Human | Lung | AIS | 5.59e-06 | 7.83e-01 | -0.0876 |
| 121256 | TMEM132D | RNA-P7T1-P7T1-3 | Human | Lung | AIS | 2.32e-05 | 7.21e-01 | -0.0822 |
| 121256 | TMEM132D | RNA-P7T1-P7T1-4 | Human | Lung | AIS | 1.09e-06 | 7.42e-01 | -0.0809 |
| 121256 | TMEM132D | HTA12-15-2 | Human | Pancreas | PDAC | 1.28e-15 | 1.01e+00 | 0.2315 |
| 121256 | TMEM132D | HTA12-16-2 | Human | Pancreas | PDAC | 1.71e-02 | 7.57e-01 | 0.0535 |
| 121256 | TMEM132D | HTA12-23-1 | Human | Pancreas | PDAC | 7.33e-25 | 1.57e+00 | 0.3405 |
| 121256 | TMEM132D | HTA12-25-1 | Human | Pancreas | PDAC | 9.43e-22 | 1.40e+00 | 0.313 |
| 121256 | TMEM132D | HTA12-26-1 | Human | Pancreas | PDAC | 2.17e-46 | 1.74e+00 | 0.3728 |
| 121256 | TMEM132D | HTA12-29-1 | Human | Pancreas | PDAC | 5.10e-104 | 1.69e+00 | 0.3722 |
| 121256 | TMEM132D | HTA12-30-1 | Human | Pancreas | PDAC | 6.56e-10 | 1.55e+00 | 0.3671 |
| 121256 | TMEM132D | HTA12-32-1 | Human | Pancreas | PDAC | 1.44e-13 | 1.70e+00 | 0.3624 |
| 121256 | TMEM132D | HTA12-9-1 | Human | Pancreas | PDAC | 3.82e-02 | 2.81e-01 | 0.1532 |
| 121256 | TMEM132D | HTA12-9-2 | Human | Pancreas | PDAC | 1.65e-02 | 2.37e-01 | 0.0835 |
| 121256 | TMEM132D | HTA12-9-3 | Human | Pancreas | PDAC | 1.07e-02 | 5.51e-01 | 0.2045 |
| Page: 1 |
| Tissue | Expression Dynamics | Abbreviation |
| Lung | 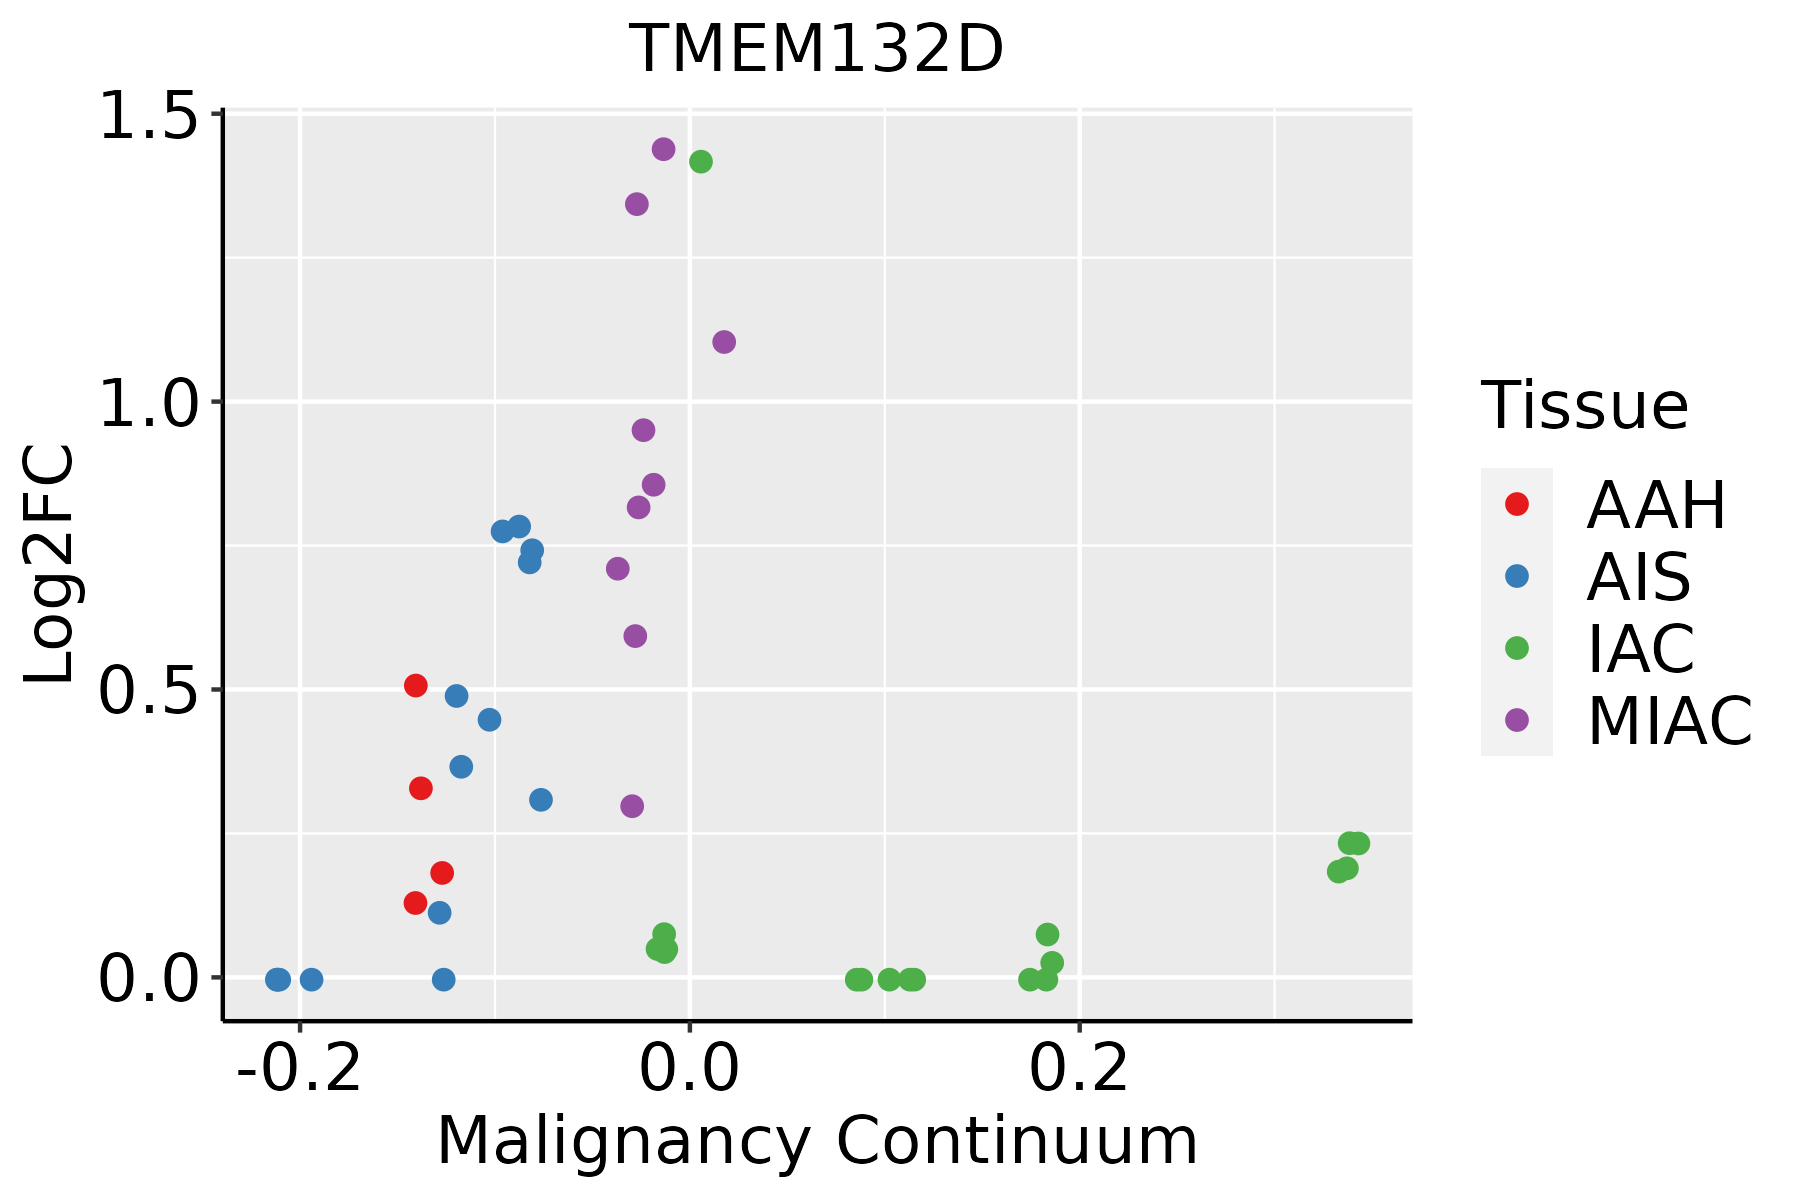 | AAH: Atypical adenomatous hyperplasia |
| AIS: Adenocarcinoma in situ | ||
| IAC: Invasive lung adenocarcinoma | ||
| MIA: Minimally invasive adenocarcinoma |
| ∗log2FC in expression of this searched gene in stem-like cells from each diseased tissue sample relative to stem-like cells in normal samples in each tissue plotted against the malignancy continuum. Samples are colored based on if they are from different disease stage. |
Top |
Malignant transformation related pathway analysis |
| Find out the enriched GO biological processes and KEGG pathways involved in transition from healthy to precancer to cancer |
| Tissue | Disease Stage | Enriched GO biological Processes |
| Colorectum | AD |  |
| Colorectum | SER |  |
| Colorectum | MSS |  |
| Colorectum | MSI-H |  |
| Colorectum | FAP |  |
| ∗Top 15 enriched GO BP terms are showed in the bar plot of each disease state in each tissue. Each row represents a significant GO biological process which is colored according to the -log10(p.adjust). |
| Page: 1 2 3 4 5 6 7 8 9 |
| GO ID | Tissue | Disease Stage | Description | Gene Ratio | Bg Ratio | pvalue | p.adjust | Count |
| Page: 1 |
| Pathway ID | Tissue | Disease Stage | Description | Gene Ratio | Bg Ratio | pvalue | p.adjust | qvalue | Count |
| Page: 1 |
Top |
Cell-cell communication analysis |
| Identification of potential cell-cell interactions between two cell types and their ligand-receptor pairs for different disease states |
| Ligand | Receptor | LRpair | Pathway | Tissue | Disease Stage |
| Page: 1 |
Top |
Single-cell gene regulatory network inference analysis |
| Find out the significant the regulons (TFs) and the target genes of each regulon across cell types for different disease states |
| TF | Cell Type | Tissue | Disease Stage | Target Gene | RSS | Regulon Activity |
| ∗The dot plots of a searched regulon are shown for all cell subpopulations in each disease state of each tissue based on the regulon specific score inferred using pySCENIC and by calculating the average expression. |
| Page: 1 |
Top |
Somatic mutation of malignant transformation related genes |
| Annotation of somatic variants for genes involved in malignant transformation |
| Hugo Symbol | Variant Class | Variant Classification | dbSNP RS | HGVSc | HGVSp | HGVSp Short | SWISSPROT | BIOTYPE | SIFT | PolyPhen | Tumor Sample Barcode | Tissue | Histology | Sex | Age | Stage | Therapy Types | Drugs | Outcome |
| TMEM132D | SNV | Missense_Mutation | rs759991422 | c.425N>A | p.Arg142Gln | p.R142Q | Q14C87 | protein_coding | deleterious(0.04) | benign(0.057) | TCGA-A2-A04Y-01 | Breast | breast invasive carcinoma | Female | <65 | I/II | Chemotherapy | cytoxan | SD |
| TMEM132D | SNV | Missense_Mutation | novel | c.2410N>T | p.Pro804Ser | p.P804S | Q14C87 | protein_coding | tolerated(0.41) | benign(0.218) | TCGA-A2-A0CP-01 | Breast | breast invasive carcinoma | Female | <65 | I/II | Chemotherapy | cytoxan | SD |
| TMEM132D | SNV | Missense_Mutation | novel | c.1534N>G | p.Ser512Gly | p.S512G | Q14C87 | protein_coding | deleterious(0.04) | benign(0.036) | TCGA-A2-A4S1-01 | Breast | breast invasive carcinoma | Female | >=65 | I/II | Unknown | Unknown | SD |
| TMEM132D | SNV | Missense_Mutation | c.2639N>A | p.Thr880Asn | p.T880N | Q14C87 | protein_coding | tolerated(1) | benign(0.003) | TCGA-A8-A09Z-01 | Breast | breast invasive carcinoma | Female | >=65 | I/II | Unknown | Unknown | SD | |
| TMEM132D | SNV | Missense_Mutation | novel | c.3259N>A | p.Glu1087Lys | p.E1087K | Q14C87 | protein_coding | deleterious(0) | benign(0.23) | TCGA-AN-A046-01 | Breast | breast invasive carcinoma | Female | >=65 | I/II | Unknown | Unknown | SD |
| TMEM132D | SNV | Missense_Mutation | c.1671N>T | p.Glu557Asp | p.E557D | Q14C87 | protein_coding | tolerated(1) | benign(0.003) | TCGA-AN-A046-01 | Breast | breast invasive carcinoma | Female | >=65 | I/II | Unknown | Unknown | SD | |
| TMEM132D | SNV | Missense_Mutation | c.2407A>T | p.Asn803Tyr | p.N803Y | Q14C87 | protein_coding | deleterious(0) | possibly_damaging(0.628) | TCGA-AN-A0FW-01 | Breast | breast invasive carcinoma | Female | >=65 | III/IV | Unknown | Unknown | SD | |
| TMEM132D | SNV | Missense_Mutation | rs553796623 | c.910N>A | p.Val304Met | p.V304M | Q14C87 | protein_coding | deleterious(0.02) | possibly_damaging(0.681) | TCGA-AO-A03O-01 | Breast | breast invasive carcinoma | Female | >=65 | I/II | Chemotherapy | doxorubicin | SD |
| TMEM132D | SNV | Missense_Mutation | c.2496N>T | p.Gln832His | p.Q832H | Q14C87 | protein_coding | tolerated(0.07) | benign(0.003) | TCGA-AO-A0J5-01 | Breast | breast invasive carcinoma | Female | <65 | III/IV | Other, specify in notesBisphosphonate | zoledronic | PD | |
| TMEM132D | SNV | Missense_Mutation | novel | c.741N>G | p.Ser247Arg | p.S247R | Q14C87 | protein_coding | tolerated(0.28) | benign(0.048) | TCGA-AQ-A7U7-01 | Breast | breast invasive carcinoma | Female | <65 | III/IV | Targeted Molecular therapy | rituximab | CR |
| Page: 1 2 3 4 5 6 7 8 9 10 11 12 13 14 15 16 17 18 19 20 21 22 23 24 25 26 27 28 29 30 31 32 33 |
Top |
Related drugs of malignant transformation related genes |
| Identification of chemicals and drugs interact with genes involved in malignant transfromation |
| (DGIdb 4.0) |
| Entrez ID | Symbol | Category | Interaction Types | Drug Claim Name | Drug Name | PMIDs |
| Page: 1 |

Copyright 2023-Present -The University of Texas Health Science Center at Houston |