
|
|||||
|
 | |
| |
| |
| |
| |
| |
|
Gene: TMEM131L |
Gene summary for TMEM131L |
| Gene information | Species | Human | Gene symbol | TMEM131L | Gene ID | 23240 |
| Gene name | transmembrane 131 like | |
| Gene Alias | KIAA0922 | |
| Cytomap | 4q31.3 | |
| Gene Type | protein-coding | GO ID | GO:0001775 | UniProtAcc | A2VDJ0 |
Top |
Malignant transformation analysis |
| Identification of the aberrant gene expression in precancerous and cancerous lesions by comparing the gene expression of stem-like cells in diseased tissues with normal stem cells |
| Entrez ID | Symbol | Replicates | Species | Organ | Tissue | Adj P-value | Log2FC | Malignancy |
| 23240 | TMEM131L | CCI_2 | Human | Cervix | CC | 5.43e-04 | 7.67e-01 | 0.5249 |
| 23240 | TMEM131L | CCI_3 | Human | Cervix | CC | 6.83e-16 | 8.11e-01 | 0.516 |
| 23240 | TMEM131L | RNA-P25T1-P25T1-1 | Human | Lung | AIS | 1.35e-14 | 6.17e-01 | -0.2116 |
| 23240 | TMEM131L | RNA-P25T1-P25T1-2 | Human | Lung | AIS | 1.36e-03 | 5.31e-01 | -0.1941 |
| 23240 | TMEM131L | RNA-P25T1-P25T1-3 | Human | Lung | AIS | 4.20e-06 | 5.58e-01 | -0.2107 |
| 23240 | TMEM131L | RNA-P25T1-P25T1-4 | Human | Lung | AIS | 1.11e-12 | 6.15e-01 | -0.2119 |
| 23240 | TMEM131L | RNA-P6T2-P6T2-1 | Human | Lung | IAC | 3.04e-13 | 4.55e-01 | -0.0166 |
| 23240 | TMEM131L | RNA-P6T2-P6T2-2 | Human | Lung | IAC | 2.85e-14 | 4.55e-01 | -0.0132 |
| 23240 | TMEM131L | RNA-P6T2-P6T2-3 | Human | Lung | IAC | 1.93e-14 | 4.70e-01 | -0.013 |
| 23240 | TMEM131L | RNA-P6T2-P6T2-4 | Human | Lung | IAC | 1.23e-15 | 5.00e-01 | -0.0121 |
| 23240 | TMEM131L | RNA-P7T1-P7T1-2 | Human | Lung | AIS | 2.28e-04 | 4.11e-01 | -0.0876 |
| 23240 | TMEM131L | RNA-P7T1-P7T1-4 | Human | Lung | AIS | 6.30e-03 | 3.48e-01 | -0.0809 |
| Page: 1 |
| Tissue | Expression Dynamics | Abbreviation |
| Cervix | 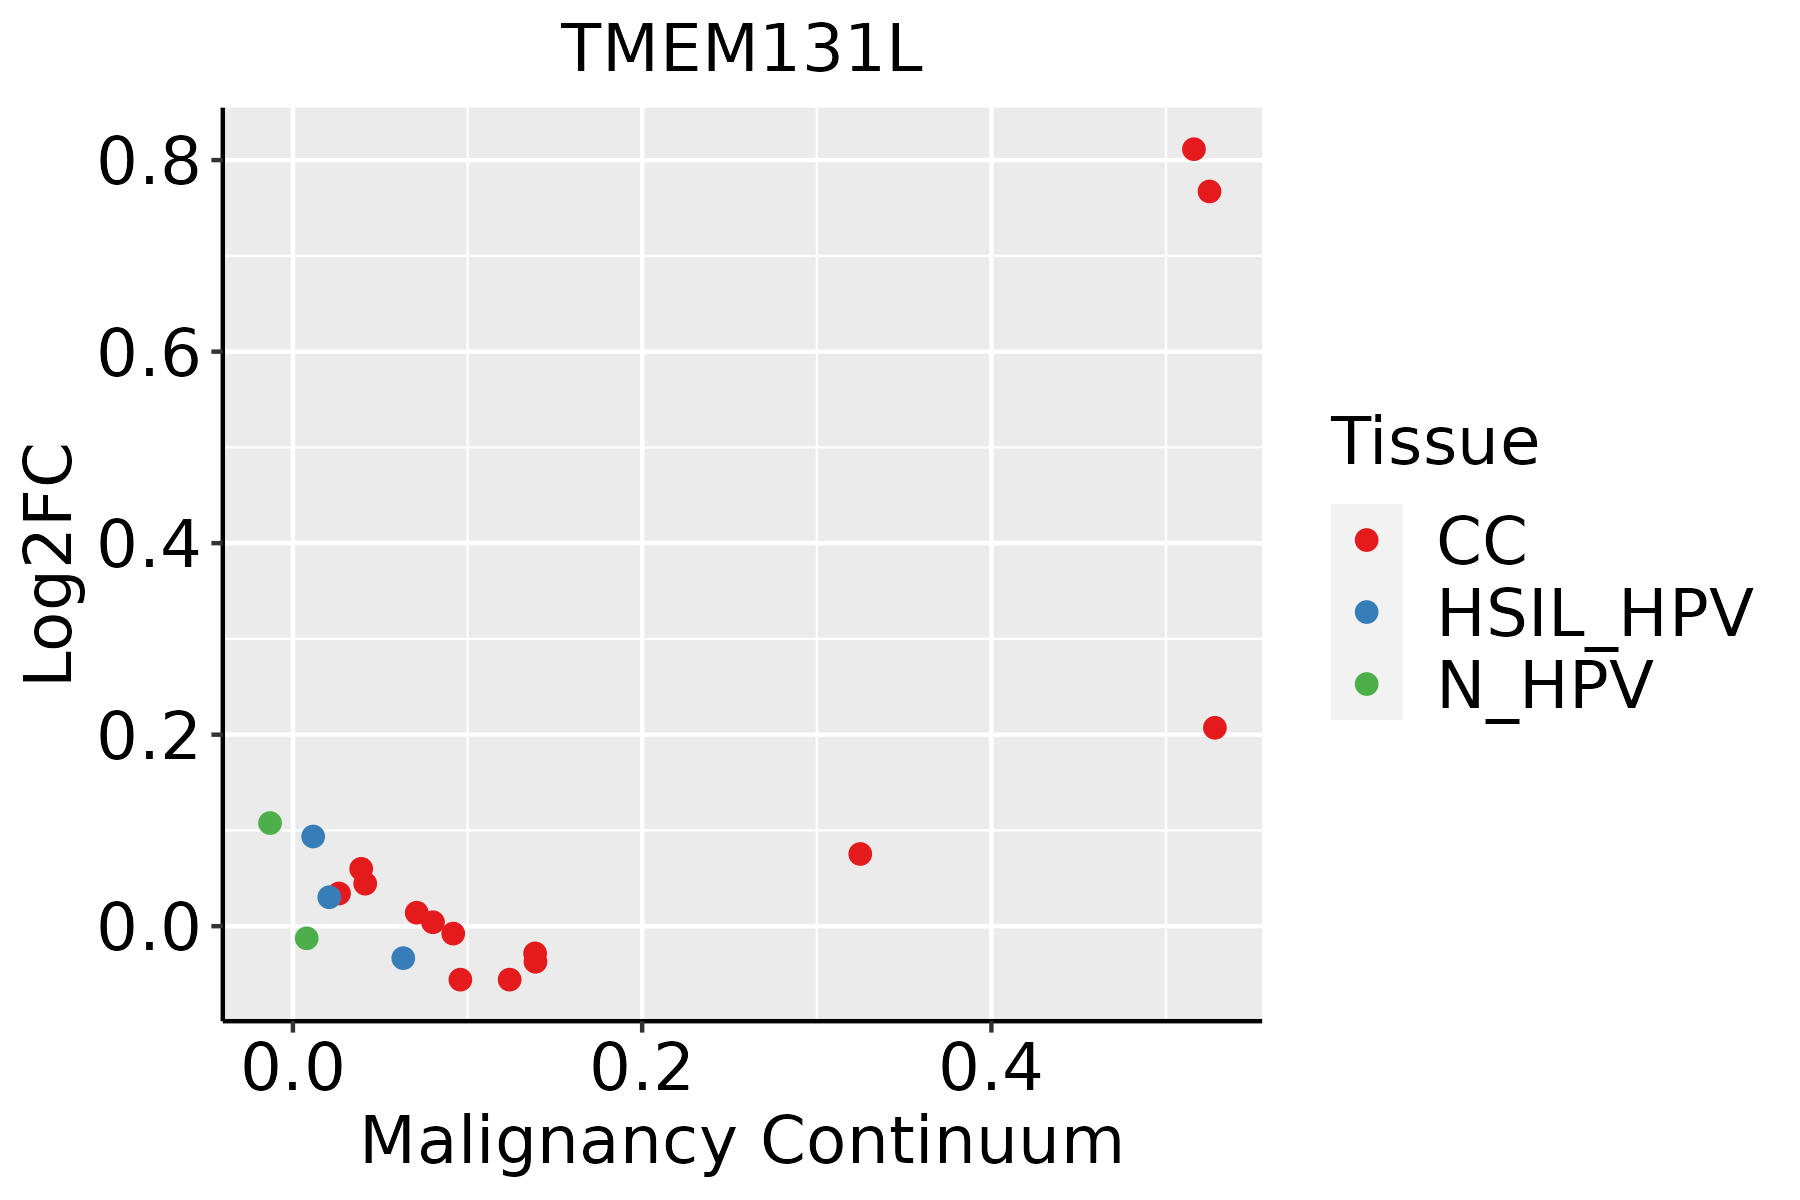 | CC: Cervix cancer |
| HSIL_HPV: HPV-infected high-grade squamous intraepithelial lesions | ||
| N_HPV: HPV-infected normal cervix | ||
| Lung |  | AAH: Atypical adenomatous hyperplasia |
| AIS: Adenocarcinoma in situ | ||
| IAC: Invasive lung adenocarcinoma | ||
| MIA: Minimally invasive adenocarcinoma |
| ∗log2FC in expression of this searched gene in stem-like cells from each diseased tissue sample relative to stem-like cells in normal samples in each tissue plotted against the malignancy continuum. Samples are colored based on if they are from different disease stage. |
Top |
Malignant transformation related pathway analysis |
| Find out the enriched GO biological processes and KEGG pathways involved in transition from healthy to precancer to cancer |
| Tissue | Disease Stage | Enriched GO biological Processes |
| Colorectum | AD |  |
| Colorectum | SER |  |
| Colorectum | MSS |  |
| Colorectum | MSI-H |  |
| Colorectum | FAP |  |
| ∗Top 15 enriched GO BP terms are showed in the bar plot of each disease state in each tissue. Each row represents a significant GO biological process which is colored according to the -log10(p.adjust). |
| Page: 1 2 3 4 5 6 7 8 9 |
| GO ID | Tissue | Disease Stage | Description | Gene Ratio | Bg Ratio | pvalue | p.adjust | Count |
| GO:002240710 | Cervix | CC | regulation of cell-cell adhesion | 103/2311 | 448/18723 | 1.78e-10 | 2.87e-08 | 103 |
| GO:00421108 | Cervix | CC | T cell activation | 107/2311 | 487/18723 | 1.24e-09 | 1.46e-07 | 107 |
| GO:00508638 | Cervix | CC | regulation of T cell activation | 80/2311 | 329/18723 | 1.28e-09 | 1.47e-07 | 80 |
| GO:00160557 | Cervix | CC | Wnt signaling pathway | 98/2311 | 444/18723 | 4.82e-09 | 4.65e-07 | 98 |
| GO:01987387 | Cervix | CC | cell-cell signaling by wnt | 98/2311 | 446/18723 | 6.16e-09 | 5.58e-07 | 98 |
| GO:00071598 | Cervix | CC | leukocyte cell-cell adhesion | 85/2311 | 371/18723 | 8.27e-09 | 7.07e-07 | 85 |
| GO:00071626 | Cervix | CC | negative regulation of cell adhesion | 72/2311 | 303/18723 | 2.36e-08 | 1.70e-06 | 72 |
| GO:00026837 | Cervix | CC | negative regulation of immune system process | 94/2311 | 434/18723 | 2.63e-08 | 1.87e-06 | 94 |
| GO:00301117 | Cervix | CC | regulation of Wnt signaling pathway | 76/2311 | 328/18723 | 3.05e-08 | 2.08e-06 | 76 |
| GO:19030378 | Cervix | CC | regulation of leukocyte cell-cell adhesion | 77/2311 | 336/18723 | 4.08e-08 | 2.54e-06 | 77 |
| GO:190370610 | Cervix | CC | regulation of hemopoiesis | 80/2311 | 367/18723 | 2.14e-07 | 9.55e-06 | 80 |
| GO:00420988 | Cervix | CC | T cell proliferation | 49/2311 | 199/18723 | 1.32e-06 | 4.49e-05 | 49 |
| GO:00608287 | Cervix | CC | regulation of canonical Wnt signaling pathway | 58/2311 | 253/18723 | 1.83e-06 | 5.89e-05 | 58 |
| GO:00224084 | Cervix | CC | negative regulation of cell-cell adhesion | 48/2311 | 196/18723 | 1.99e-06 | 6.18e-05 | 48 |
| GO:00600707 | Cervix | CC | canonical Wnt signaling pathway | 66/2311 | 303/18723 | 2.47e-06 | 7.35e-05 | 66 |
| GO:00421297 | Cervix | CC | regulation of T cell proliferation | 43/2311 | 171/18723 | 3.21e-06 | 8.77e-05 | 43 |
| GO:19021056 | Cervix | CC | regulation of leukocyte differentiation | 61/2311 | 279/18723 | 5.16e-06 | 1.29e-04 | 61 |
| GO:00706637 | Cervix | CC | regulation of leukocyte proliferation | 55/2311 | 245/18723 | 6.51e-06 | 1.56e-04 | 55 |
| GO:19021064 | Cervix | CC | negative regulation of leukocyte differentiation | 29/2311 | 102/18723 | 1.02e-05 | 2.29e-04 | 29 |
| GO:00506705 | Cervix | CC | regulation of lymphocyte proliferation | 51/2311 | 225/18723 | 1.05e-05 | 2.32e-04 | 51 |
| Page: 1 2 3 4 |
| Pathway ID | Tissue | Disease Stage | Description | Gene Ratio | Bg Ratio | pvalue | p.adjust | qvalue | Count |
| Page: 1 |
Top |
Cell-cell communication analysis |
| Identification of potential cell-cell interactions between two cell types and their ligand-receptor pairs for different disease states |
| Ligand | Receptor | LRpair | Pathway | Tissue | Disease Stage |
| Page: 1 |
Top |
Single-cell gene regulatory network inference analysis |
| Find out the significant the regulons (TFs) and the target genes of each regulon across cell types for different disease states |
| TF | Cell Type | Tissue | Disease Stage | Target Gene | RSS | Regulon Activity |
| ∗The dot plots of a searched regulon are shown for all cell subpopulations in each disease state of each tissue based on the regulon specific score inferred using pySCENIC and by calculating the average expression. |
| Page: 1 |
Top |
Somatic mutation of malignant transformation related genes |
| Annotation of somatic variants for genes involved in malignant transformation |
| Hugo Symbol | Variant Class | Variant Classification | dbSNP RS | HGVSc | HGVSp | HGVSp Short | SWISSPROT | BIOTYPE | SIFT | PolyPhen | Tumor Sample Barcode | Tissue | Histology | Sex | Age | Stage | Therapy Types | Drugs | Outcome |
| Page: 1 |
Top |
Related drugs of malignant transformation related genes |
| Identification of chemicals and drugs interact with genes involved in malignant transfromation |
| (DGIdb 4.0) |
| Entrez ID | Symbol | Category | Interaction Types | Drug Claim Name | Drug Name | PMIDs |
| Page: 1 |

Copyright 2023-Present -The University of Texas Health Science Center at Houston |