Schematic overview of the cellular and molecular mechanisms involved in the cancer progression, including the proposed cellular and molecular mechanisms in cancer cells trajectory. AT1: alveolar type 1 cells; AT2: alveolar type 2 cells; AAH: atypical adenomatous hyperplasia; AIS: adenocarcinoma in situ; MIA: minimally invasive adenocarcinoma; IA: invasive adenocarcinoma; EMT: epithelial-mesenchymal transition

Home

Download

Statistics

Help

Contact

Center for Computational Systems Medicine
leaf

Gene summary

leaf

Malignant transformation analysis

leaf

Malignant transformation related pathway analysis

leaf

Cell-cell communication analysis

leaf

Single-cell gene regulatory network inference analysis

leaf

Somatic mutation of malignant transformation related genes

leaf

Related drugs of malignant transformation related genes

Gene: TMEM126A

Gene summary for TMEM126A

check button Gene summary.

Gene informationSpeciesHuman
Gene symbol

TMEM126A

Gene ID

84233

Gene nametransmembrane protein 126A
Gene AliasOPA7
Cytomap11q14.1
Gene Typeprotein-coding
GO ID

GO:0006996

UniProtAcc

Q9H061


Top

Malignant transformation analysis

check button Identification of the aberrant gene expression in precancerous and cancerous lesions by comparing the gene expression of stem-like cells in diseased tissues with normal stem cells
check button Malignant transformation involving gene list.
Entrez IDSymbolReplicatesSpeciesOrganTissueAdj P-valueLog2FCMalignancy
84233TMEM126ALZE4THumanEsophagusESCC6.38e-182.97e-010.0811
84233TMEM126ALZE7THumanEsophagusESCC5.66e-051.66e-010.0667
84233TMEM126ALZE8THumanEsophagusESCC4.66e-071.26e-010.067
84233TMEM126ALZE24THumanEsophagusESCC8.12e-205.46e-010.0596
84233TMEM126ALZE6THumanEsophagusESCC2.12e-032.22e-010.0845
84233TMEM126AP1T-EHumanEsophagusESCC2.81e-032.47e-010.0875
84233TMEM126AP2T-EHumanEsophagusESCC8.07e-171.92e-010.1177
84233TMEM126AP4T-EHumanEsophagusESCC3.05e-561.29e+000.1323
84233TMEM126AP5T-EHumanEsophagusESCC7.66e-378.07e-010.1327
84233TMEM126AP8T-EHumanEsophagusESCC3.92e-046.31e-020.0889
84233TMEM126AP9T-EHumanEsophagusESCC1.70e-243.98e-010.1131
84233TMEM126AP10T-EHumanEsophagusESCC9.06e-233.85e-010.116
84233TMEM126AP11T-EHumanEsophagusESCC1.06e-217.47e-010.1426
84233TMEM126AP12T-EHumanEsophagusESCC1.96e-274.83e-010.1122
84233TMEM126AP15T-EHumanEsophagusESCC1.69e-091.29e-010.1149
84233TMEM126AP16T-EHumanEsophagusESCC2.26e-244.85e-010.1153
84233TMEM126AP17T-EHumanEsophagusESCC7.93e-115.39e-010.1278
84233TMEM126AP19T-EHumanEsophagusESCC5.19e-157.38e-010.1662
84233TMEM126AP20T-EHumanEsophagusESCC9.70e-132.34e-010.1124
84233TMEM126AP21T-EHumanEsophagusESCC3.90e-611.28e+000.1617
Page: 1 2 3 4 5 6 

check button Transcriptomic changes along malignancy continuum.
TissueExpression DynamicsAbbreviation
EsophagusThe image shows the transcriptomic changes along malignancy continuum.log2FC in expression of this searched gene in stem-like cells from each diseased tissue sample relative to stem-like cells in normal samples in each tissue plotted against the malignancy continuum. Samples are colored based on if they are from different disease stage.
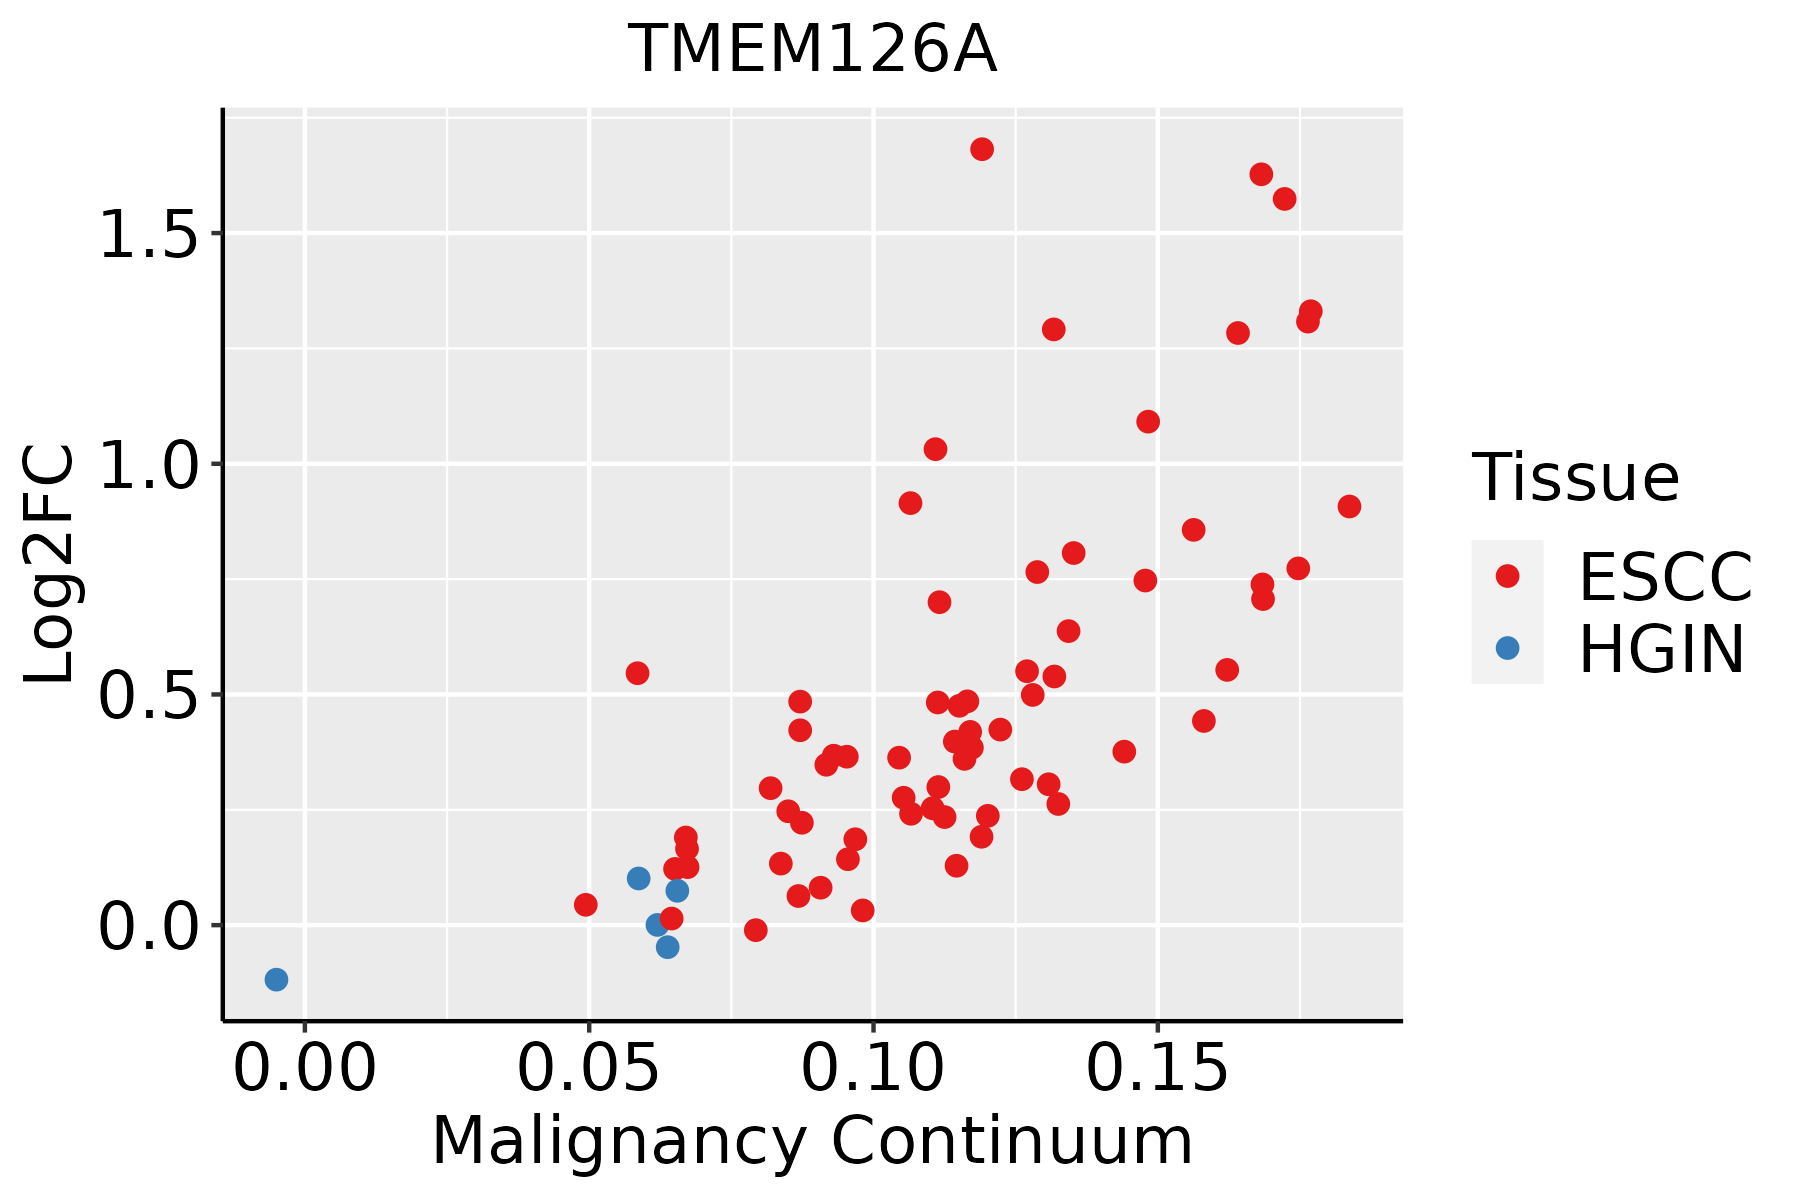
ESCC: Esophageal squamous cell carcinoma
HGIN: High-grade intraepithelial neoplasias
LGIN: Low-grade intraepithelial neoplasias
LiverThe image shows the transcriptomic changes along malignancy continuum.log2FC in expression of this searched gene in stem-like cells from each diseased tissue sample relative to stem-like cells in normal samples in each tissue plotted against the malignancy continuum. Samples are colored based on if they are from different disease stage.HCC: Hepatocellular carcinoma
NAFLD: Non-alcoholic fatty liver disease
Oral CavityThe image shows the transcriptomic changes along malignancy continuum.log2FC in expression of this searched gene in stem-like cells from each diseased tissue sample relative to stem-like cells in normal samples in each tissue plotted against the malignancy continuum. Samples are colored based on if they are from different disease stage.
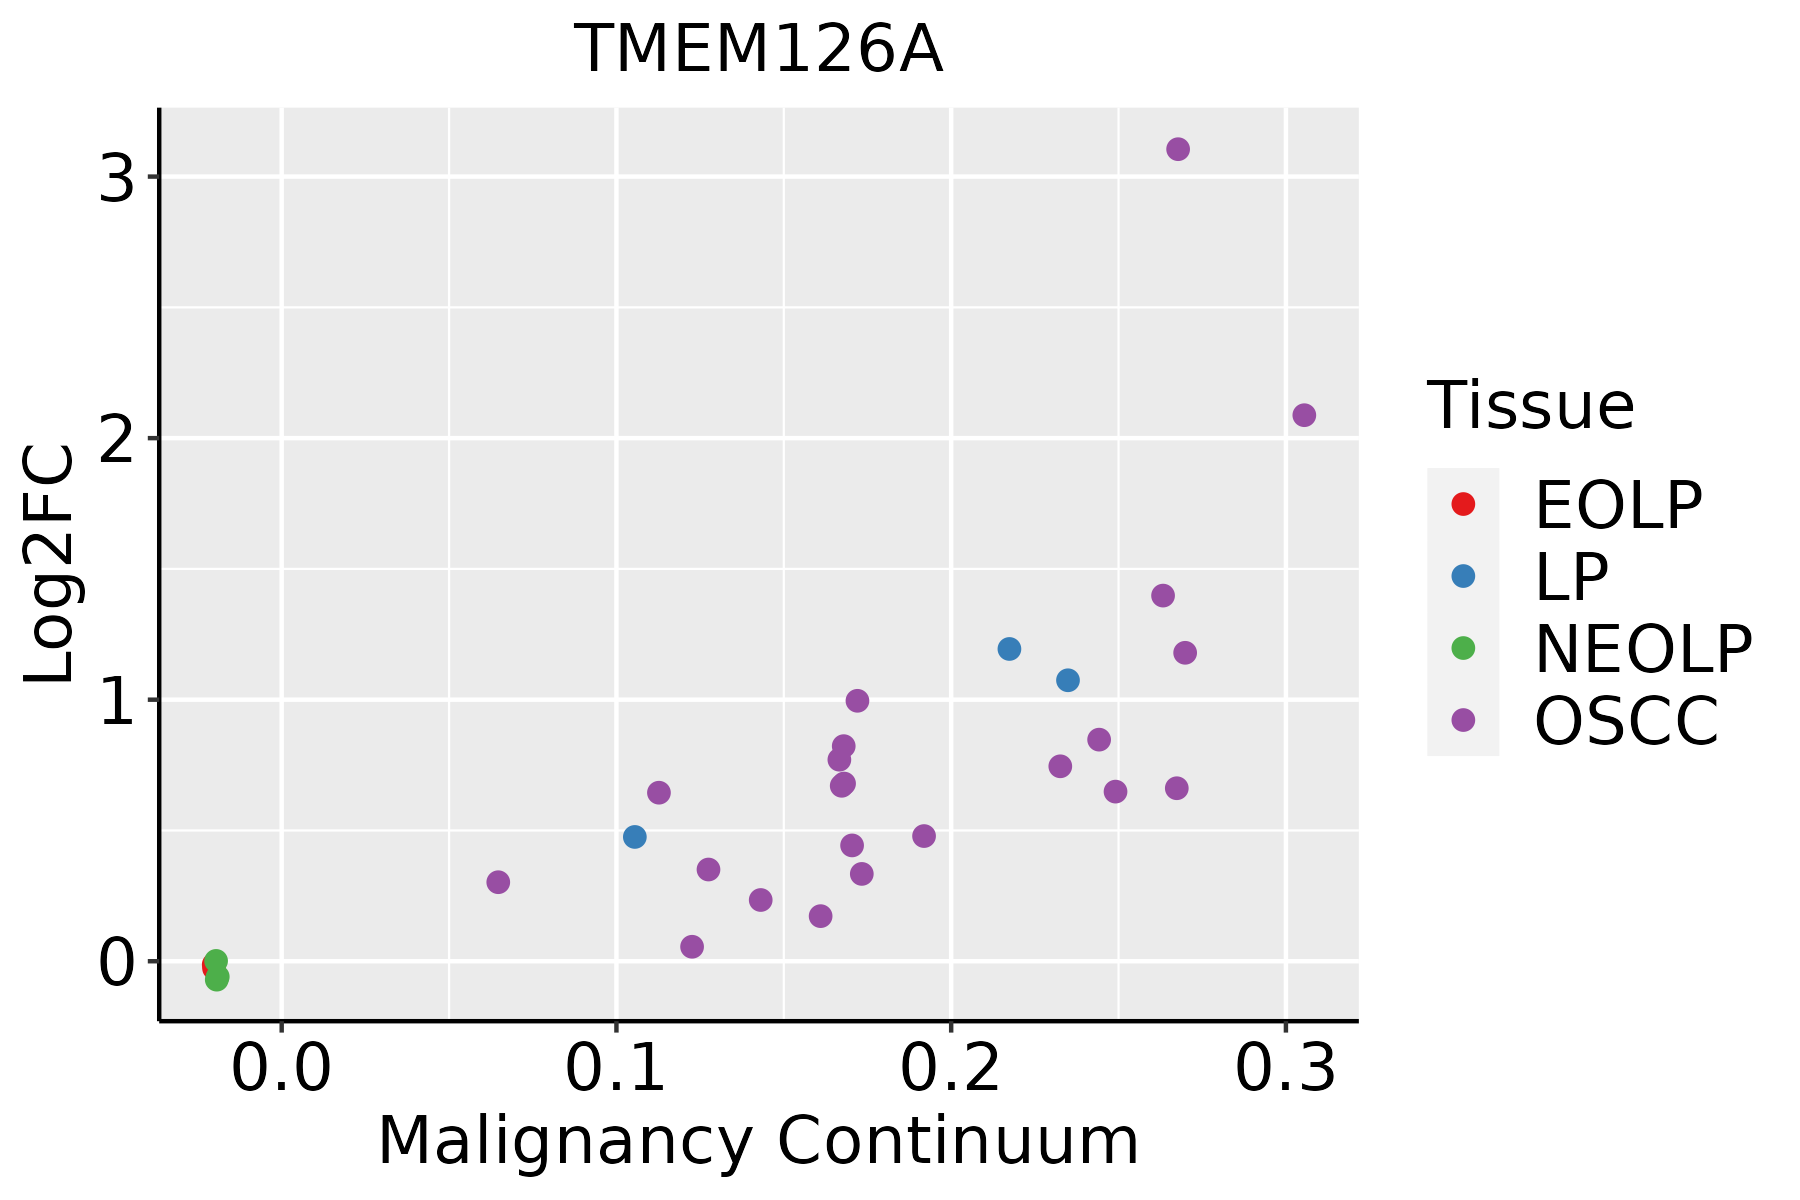
EOLP: Erosive Oral lichen planus
LP: leukoplakia
NEOLP: Non-erosive oral lichen planus
OSCC: Oral squamous cell carcinoma
SkinThe image shows the transcriptomic changes along malignancy continuum.log2FC in expression of this searched gene in stem-like cells from each diseased tissue sample relative to stem-like cells in normal samples in each tissue plotted against the malignancy continuum. Samples are colored based on if they are from different disease stage.
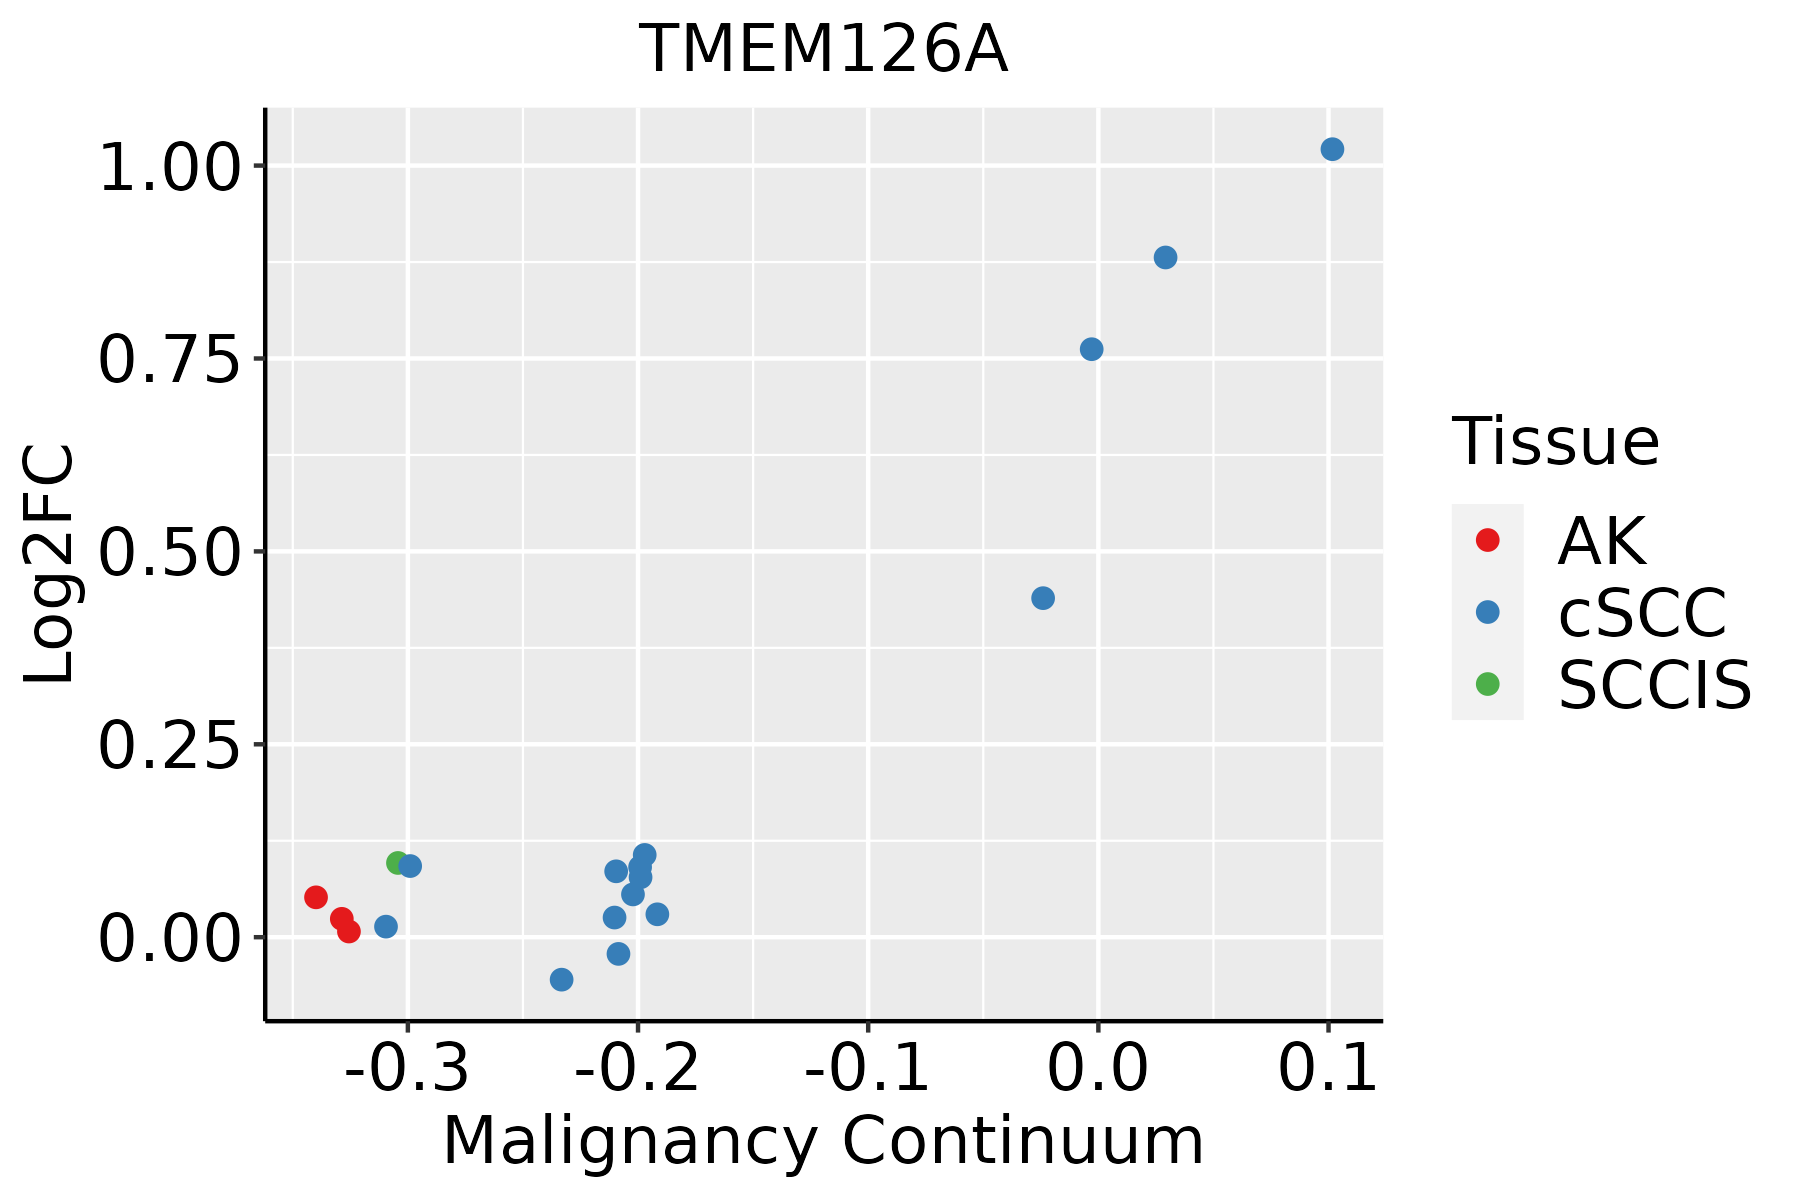
AK: Actinic keratosis
cSCC: Cutaneous squamous cell carcinoma
SCCIS:squamous cell carcinoma in situ
ThyroidThe image shows the transcriptomic changes along malignancy continuum.log2FC in expression of this searched gene in stem-like cells from each diseased tissue sample relative to stem-like cells in normal samples in each tissue plotted against the malignancy continuum. Samples are colored based on if they are from different disease stage.
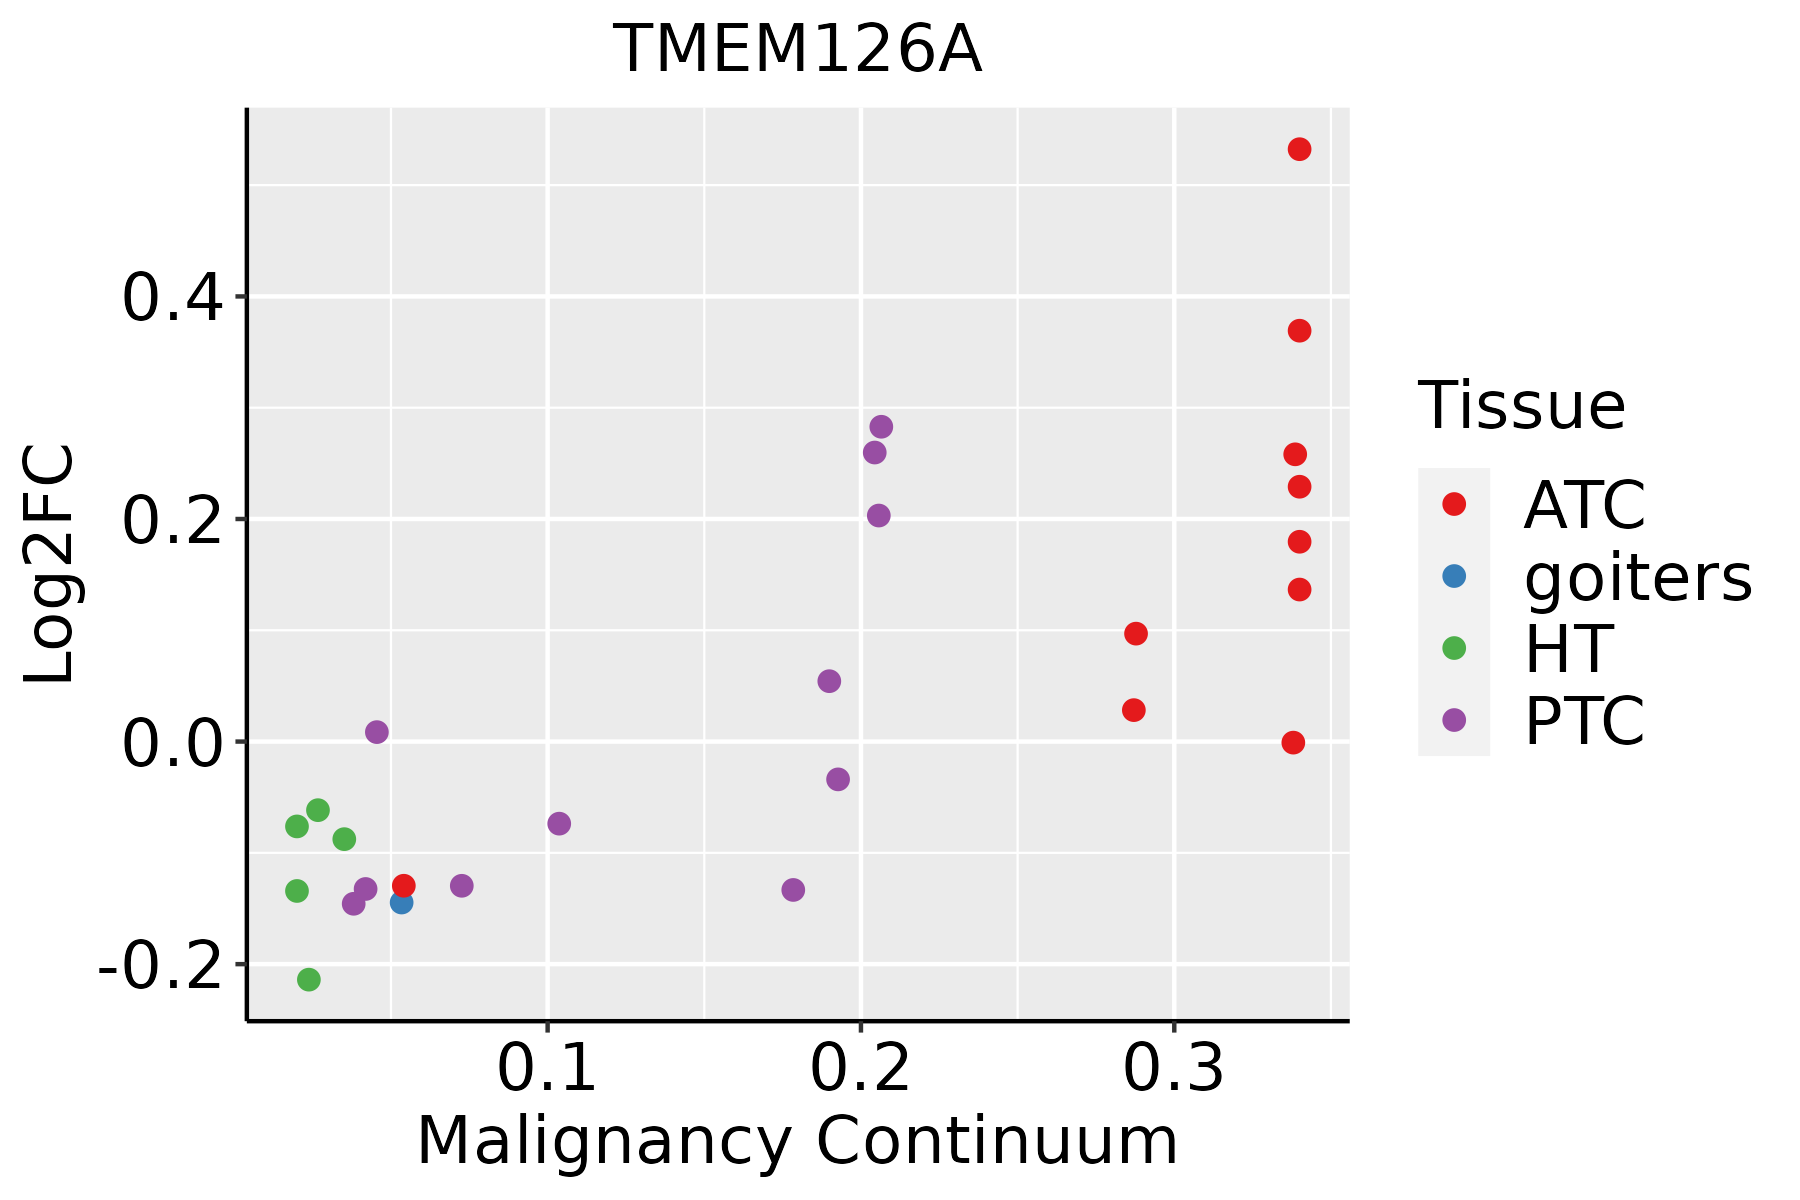
ATC: Anaplastic thyroid cancer
HT: Hashimoto's thyroiditis
PTC: Papillary thyroid cancer
∗log2FC in expression of this searched gene in stem-like cells from each diseased tissue sample relative to stem-like cells in normal samples in each tissue plotted against the malignancy continuum. Samples are colored based on if they are from different disease stage.

Top

Malignant transformation related pathway analysis

check buttonFind out the enriched GO biological processes and KEGG pathways involved in transition from healthy to precancer to cancer
check button Figure of enriched GO biological processes.
TissueDisease StageEnriched GO biological Processes
ColorectumADGO analysis - Figure of enriched GO biological processes: Top 15 enriched GO BP terms are showed in the bar plot of each disease state in each tissue. Each row represents a significant GO biological process which is colored according to the -log10(p.adjust).
ColorectumSERGO analysis - Figure of enriched GO biological processes: Top 15 enriched GO BP terms are showed in the bar plot of each disease state in each tissue. Each row represents a significant GO biological process which is colored according to the -log10(p.adjust).
ColorectumMSSGO analysis - Figure of enriched GO biological processes: Top 15 enriched GO BP terms are showed in the bar plot of each disease state in each tissue. Each row represents a significant GO biological process which is colored according to the -log10(p.adjust).
ColorectumMSI-HGO analysis - Figure of enriched GO biological processes: Top 15 enriched GO BP terms are showed in the bar plot of each disease state in each tissue. Each row represents a significant GO biological process which is colored according to the -log10(p.adjust).
ColorectumFAPGO analysis - Figure of enriched GO biological processes: Top 15 enriched GO BP terms are showed in the bar plot of each disease state in each tissue. Each row represents a significant GO biological process which is colored according to the -log10(p.adjust).
∗Top 15 enriched GO BP terms are showed in the bar plot of each disease state in each tissue. Each row represents a significant GO biological process which is colored according to the -log10(p.adjust).
Page: 1 2 3 4 5 6 7 8 9 

check button Enriched GO biological processes.
GO IDTissueDisease StageDescriptionGene RatioBg Ratiopvaluep.adjustCount
GO:0033108110EsophagusESCCmitochondrial respiratory chain complex assembly83/855293/187239.56e-191.05e-1683
GO:0010257110EsophagusESCCNADH dehydrogenase complex assembly50/855257/187233.78e-111.24e-0950
GO:0032981110EsophagusESCCmitochondrial respiratory chain complex I assembly50/855257/187233.78e-111.24e-0950
GO:00331087LiverCirrhoticmitochondrial respiratory chain complex assembly64/463493/187233.85e-197.79e-1764
GO:00102577LiverCirrhoticNADH dehydrogenase complex assembly42/463457/187231.06e-141.06e-1242
GO:00329817LiverCirrhoticmitochondrial respiratory chain complex I assembly42/463457/187231.06e-141.06e-1242
GO:003310812LiverHCCmitochondrial respiratory chain complex assembly80/795893/187233.47e-184.15e-1680
GO:001025712LiverHCCNADH dehydrogenase complex assembly50/795857/187231.50e-127.20e-1150
GO:003298112LiverHCCmitochondrial respiratory chain complex I assembly50/795857/187231.50e-127.20e-1150
GO:003310818Oral cavityOSCCmitochondrial respiratory chain complex assembly75/730593/187232.17e-161.68e-1475
GO:001025718Oral cavityOSCCNADH dehydrogenase complex assembly45/730557/187238.53e-102.13e-0845
GO:003298118Oral cavityOSCCmitochondrial respiratory chain complex I assembly45/730557/187238.53e-102.13e-0845
GO:003310819Oral cavityLPmitochondrial respiratory chain complex assembly63/462393/187232.24e-184.13e-1663
GO:001025719Oral cavityLPNADH dehydrogenase complex assembly41/462357/187237.93e-147.89e-1241
GO:003298119Oral cavityLPmitochondrial respiratory chain complex I assembly41/462357/187237.93e-147.89e-1241
GO:003310824SkincSCCmitochondrial respiratory chain complex assembly64/486493/187235.48e-186.58e-1664
GO:001025724SkincSCCNADH dehydrogenase complex assembly42/486457/187236.46e-144.09e-1242
GO:003298124SkincSCCmitochondrial respiratory chain complex I assembly42/486457/187236.46e-144.09e-1242
GO:0033108111ThyroidPTCmitochondrial respiratory chain complex assembly65/596893/187235.60e-143.21e-1265
GO:0010257111ThyroidPTCNADH dehydrogenase complex assembly43/596857/187231.73e-116.81e-1043
Page: 1 2 

check button Enriched KEGG pathways.
Pathway IDTissueDisease StageDescriptionGene RatioBg Ratiopvaluep.adjustqvalueCount
Page: 1 

Top

Cell-cell communication analysis

check buttonIdentification of potential cell-cell interactions between two cell types and their ligand-receptor pairs for different disease states
LigandReceptorLRpairPathwayTissueDisease Stage
Page: 1 

Top

Single-cell gene regulatory network inference analysis

check buttonFind out the significant the regulons (TFs) and the target genes of each regulon across cell types for different disease states
TFCell TypeTissueDisease StageTarget GeneRSSRegulon Activity
∗The dot plots of a searched regulon are shown for all cell subpopulations in each disease state of each tissue based on the regulon specific score inferred using pySCENIC and by calculating the average expression.
Page: 1 

Top

Somatic mutation of malignant transformation related genes

check buttonAnnotation of somatic variants for genes involved in malignant transformation
Hugo SymbolVariant ClassVariant ClassificationdbSNP RSHGVScHGVSpHGVSp ShortSWISSPROTBIOTYPESIFTPolyPhenTumor Sample BarcodeTissueHistologySexAgeStageTherapy TypesDrugsOutcome
TMEM126ASNVMissense_Mutationc.151N>Cp.Asn51Hisp.N51HQ9H061protein_codingdeleterious(0)probably_damaging(1)TCGA-A1-A0SO-01Breastbreast invasive carcinomaFemale>=65I/IIChemotherapySD
TMEM126ASNVMissense_Mutationnovelc.273N>Tp.Leu91Phep.L91FQ9H061protein_codingdeleterious(0)probably_damaging(0.99)TCGA-C8-A26Y-01Breastbreast invasive carcinomaFemale>=65I/IIUnknownUnknownSD
TMEM126ASNVMissense_Mutationrs765038408c.409N>Gp.Leu137Valp.L137VQ9H061protein_codingtolerated(0.62)benign(0.007)TCGA-C5-A905-01Cervixcervical & endocervical cancerFemale<65I/IIUnknownUnknownSD
TMEM126ASNVMissense_Mutationc.9N>Gp.Asn3Lysp.N3KQ9H061protein_codingdeleterious(0.01)benign(0.11)TCGA-FU-A3HZ-01Cervixcervical & endocervical cancerFemale<65I/IIChemotherapycisplatinCR
TMEM126ASNVMissense_Mutationc.218N>Tp.Gly73Valp.G73VQ9H061protein_codingtolerated(1)benign(0)TCGA-AD-A5EJ-01Colorectumcolon adenocarcinomaFemale>=65I/IIUnknownUnknownSD
TMEM126AinsertionNonsense_Mutationnovelc.390_391insAACATGATTTAAAGAATp.Ala131AsnfsTer4p.A131Nfs*4Q9H061protein_codingTCGA-AM-5820-01Colorectumcolon adenocarcinomaFemale<65I/IIUnknownUnknownSD
TMEM126ASNVMissense_Mutationnovelc.514N>Cp.Tyr172Hisp.Y172HQ9H061protein_codingdeleterious(0)probably_damaging(0.99)TCGA-A5-A0GR-01Endometriumuterine corpus endometrioid carcinomaFemale>=65I/IIUnknownUnknownSD
TMEM126ASNVMissense_Mutationnovelc.188N>Ap.Ala63Aspp.A63DQ9H061protein_codingdeleterious(0)probably_damaging(0.939)TCGA-A5-A1OF-01Endometriumuterine corpus endometrioid carcinomaFemale<65I/IIUnknownUnknownSD
TMEM126ASNVMissense_Mutationrs377476349c.190N>Tp.Arg64Cysp.R64CQ9H061protein_codingtolerated(0.11)possibly_damaging(0.828)TCGA-AP-A1DV-01Endometriumuterine corpus endometrioid carcinomaFemale<65I/IIUnknownUnknownSD
TMEM126ASNVMissense_Mutationnovelc.514T>Cp.Tyr172Hisp.Y172HQ9H061protein_codingdeleterious(0)probably_damaging(0.99)TCGA-AX-A0IZ-01Endometriumuterine corpus endometrioid carcinomaFemale<65I/IIUnknownUnknownSD
Page: 1 2 

Top

Related drugs of malignant transformation related genes

check buttonIdentification of chemicals and drugs interact with genes involved in malignant transfromation
(DGIdb 4.0)
Entrez IDSymbolCategoryInteraction TypesDrug Claim NameDrug NamePMIDs
Page: 1