
|
|||||
|
 | |
| |
| |
| |
| |
| |
|
Gene: TMEM125 |
Gene summary for TMEM125 |
| Gene information | Species | Human | Gene symbol | TMEM125 | Gene ID | 128218 |
| Gene name | transmembrane protein 125 | |
| Gene Alias | TMEM125 | |
| Cytomap | 1p34.2 | |
| Gene Type | protein-coding | GO ID | GO:0008150 | UniProtAcc | Q96AQ2 |
Top |
Malignant transformation analysis |
| Identification of the aberrant gene expression in precancerous and cancerous lesions by comparing the gene expression of stem-like cells in diseased tissues with normal stem cells |
| Entrez ID | Symbol | Replicates | Species | Organ | Tissue | Adj P-value | Log2FC | Malignancy |
| 128218 | TMEM125 | HTA11_3410_2000001011 | Human | Colorectum | AD | 4.26e-05 | 1.80e-01 | 0.0155 |
| 128218 | TMEM125 | HTA11_2487_2000001011 | Human | Colorectum | SER | 4.40e-11 | 4.49e-01 | -0.1808 |
| 128218 | TMEM125 | HTA11_1938_2000001011 | Human | Colorectum | AD | 1.40e-08 | 5.62e-01 | -0.0811 |
| 128218 | TMEM125 | HTA11_78_2000001011 | Human | Colorectum | AD | 3.45e-04 | 3.15e-01 | -0.1088 |
| 128218 | TMEM125 | HTA11_347_2000001011 | Human | Colorectum | AD | 4.42e-21 | 5.84e-01 | -0.1954 |
| 128218 | TMEM125 | HTA11_411_2000001011 | Human | Colorectum | SER | 5.75e-03 | 7.03e-01 | -0.2602 |
| 128218 | TMEM125 | HTA11_2112_2000001011 | Human | Colorectum | SER | 1.32e-02 | 6.59e-01 | -0.2196 |
| 128218 | TMEM125 | HTA11_3361_2000001011 | Human | Colorectum | AD | 1.65e-02 | 3.19e-01 | -0.1207 |
| 128218 | TMEM125 | HTA11_83_2000001011 | Human | Colorectum | SER | 2.73e-07 | 5.56e-01 | -0.1526 |
| 128218 | TMEM125 | HTA11_696_2000001011 | Human | Colorectum | AD | 6.09e-26 | 6.61e-01 | -0.1464 |
| 128218 | TMEM125 | HTA11_866_2000001011 | Human | Colorectum | AD | 9.02e-15 | 3.41e-01 | -0.1001 |
| 128218 | TMEM125 | HTA11_1391_2000001011 | Human | Colorectum | AD | 1.87e-09 | 4.73e-01 | -0.059 |
| 128218 | TMEM125 | HTA11_2992_2000001011 | Human | Colorectum | SER | 1.98e-05 | 6.08e-01 | -0.1706 |
| 128218 | TMEM125 | HTA11_866_3004761011 | Human | Colorectum | AD | 2.84e-07 | 2.85e-01 | 0.096 |
| 128218 | TMEM125 | HTA11_10711_2000001011 | Human | Colorectum | AD | 9.89e-04 | 2.84e-01 | 0.0338 |
| 128218 | TMEM125 | HTA11_7696_3000711011 | Human | Colorectum | AD | 6.28e-16 | 3.40e-01 | 0.0674 |
| 128218 | TMEM125 | HTA11_7469_2000001011 | Human | Colorectum | AD | 1.20e-02 | 4.97e-01 | -0.0124 |
| 128218 | TMEM125 | HTA11_6818_2000001021 | Human | Colorectum | AD | 6.74e-06 | 4.77e-01 | 0.0588 |
| 128218 | TMEM125 | HTA11_99999970781_79442 | Human | Colorectum | MSS | 2.34e-17 | 4.26e-01 | 0.294 |
| 128218 | TMEM125 | HTA11_99999971662_82457 | Human | Colorectum | MSS | 1.55e-14 | 4.00e-01 | 0.3859 |
| Page: 1 2 3 |
| Tissue | Expression Dynamics | Abbreviation |
| Colorectum (GSE201348) |  | FAP: Familial adenomatous polyposis |
| CRC: Colorectal cancer | ||
| Colorectum (HTA11) |  | AD: Adenomas |
| SER: Sessile serrated lesions | ||
| MSI-H: Microsatellite-high colorectal cancer | ||
| MSS: Microsatellite stable colorectal cancer | ||
| Esophagus |  | ESCC: Esophageal squamous cell carcinoma |
| HGIN: High-grade intraepithelial neoplasias | ||
| LGIN: Low-grade intraepithelial neoplasias | ||
| Thyroid | 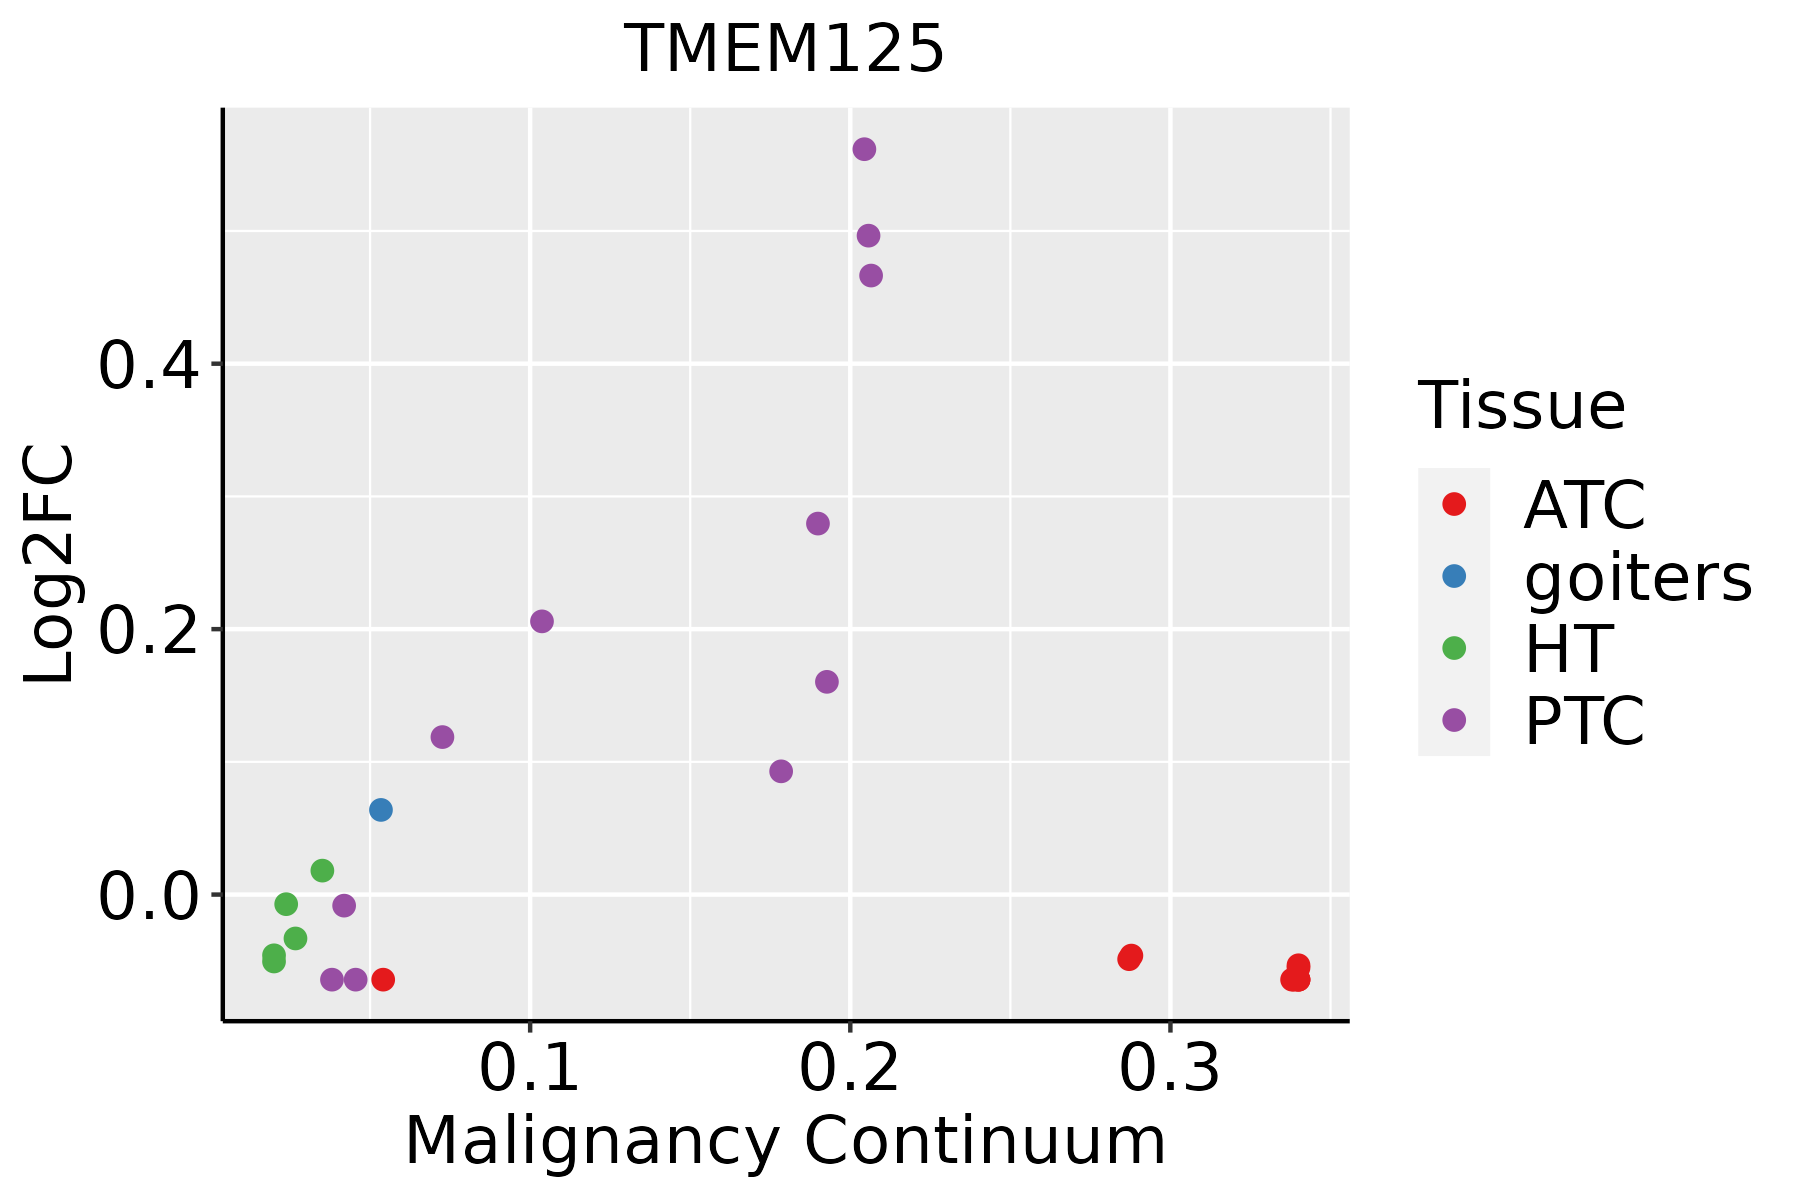 | ATC: Anaplastic thyroid cancer |
| HT: Hashimoto's thyroiditis | ||
| PTC: Papillary thyroid cancer |
| ∗log2FC in expression of this searched gene in stem-like cells from each diseased tissue sample relative to stem-like cells in normal samples in each tissue plotted against the malignancy continuum. Samples are colored based on if they are from different disease stage. |
Top |
Malignant transformation related pathway analysis |
| Find out the enriched GO biological processes and KEGG pathways involved in transition from healthy to precancer to cancer |
| Tissue | Disease Stage | Enriched GO biological Processes |
| Colorectum | AD |  |
| Colorectum | SER |  |
| Colorectum | MSS |  |
| Colorectum | MSI-H |  |
| Colorectum | FAP |  |
| ∗Top 15 enriched GO BP terms are showed in the bar plot of each disease state in each tissue. Each row represents a significant GO biological process which is colored according to the -log10(p.adjust). |
| Page: 1 2 3 4 5 6 7 8 9 |
| GO ID | Tissue | Disease Stage | Description | Gene Ratio | Bg Ratio | pvalue | p.adjust | Count |
| Page: 1 |
| Pathway ID | Tissue | Disease Stage | Description | Gene Ratio | Bg Ratio | pvalue | p.adjust | qvalue | Count |
| Page: 1 |
Top |
Cell-cell communication analysis |
| Identification of potential cell-cell interactions between two cell types and their ligand-receptor pairs for different disease states |
| Ligand | Receptor | LRpair | Pathway | Tissue | Disease Stage |
| Page: 1 |
Top |
Single-cell gene regulatory network inference analysis |
| Find out the significant the regulons (TFs) and the target genes of each regulon across cell types for different disease states |
| TF | Cell Type | Tissue | Disease Stage | Target Gene | RSS | Regulon Activity |
| ∗The dot plots of a searched regulon are shown for all cell subpopulations in each disease state of each tissue based on the regulon specific score inferred using pySCENIC and by calculating the average expression. |
| Page: 1 |
Top |
Somatic mutation of malignant transformation related genes |
| Annotation of somatic variants for genes involved in malignant transformation |
| Hugo Symbol | Variant Class | Variant Classification | dbSNP RS | HGVSc | HGVSp | HGVSp Short | SWISSPROT | BIOTYPE | SIFT | PolyPhen | Tumor Sample Barcode | Tissue | Histology | Sex | Age | Stage | Therapy Types | Drugs | Outcome |
| TMEM125 | SNV | Missense_Mutation | novel | c.133G>T | p.Val45Leu | p.V45L | Q96AQ2 | protein_coding | deleterious(0.01) | possibly_damaging(0.51) | TCGA-C5-A7X8-01 | Cervix | cervical & endocervical cancer | Female | <65 | I/II | Chemotherapy | cisplatin | SD |
| TMEM125 | SNV | Missense_Mutation | c.572G>A | p.Gly191Asp | p.G191D | Q96AQ2 | protein_coding | tolerated(0.63) | benign(0.003) | TCGA-AA-3864-01 | Colorectum | colon adenocarcinoma | Male | >=65 | I/II | Unknown | Unknown | SD | |
| TMEM125 | SNV | Missense_Mutation | c.613G>A | p.Ala205Thr | p.A205T | Q96AQ2 | protein_coding | tolerated(0.52) | benign(0.079) | TCGA-AZ-6601-01 | Colorectum | colon adenocarcinoma | Male | >=65 | I/II | Unknown | Unknown | PD | |
| TMEM125 | SNV | Missense_Mutation | rs758054349 | c.34C>T | p.Arg12Trp | p.R12W | Q96AQ2 | protein_coding | deleterious(0.05) | benign(0.003) | TCGA-AJ-A3BH-01 | Endometrium | uterine corpus endometrioid carcinoma | Female | Unknown | I/II | Unknown | Unknown | SD |
| TMEM125 | SNV | Missense_Mutation | rs761737616 | c.199N>T | p.Arg67Trp | p.R67W | Q96AQ2 | protein_coding | deleterious(0) | benign(0.097) | TCGA-AP-A1DV-01 | Endometrium | uterine corpus endometrioid carcinoma | Female | <65 | I/II | Unknown | Unknown | SD |
| TMEM125 | SNV | Missense_Mutation | novel | c.446N>A | p.Ser149Tyr | p.S149Y | Q96AQ2 | protein_coding | tolerated(0.1) | benign(0.116) | TCGA-AP-A1DV-01 | Endometrium | uterine corpus endometrioid carcinoma | Female | <65 | I/II | Unknown | Unknown | SD |
| TMEM125 | SNV | Missense_Mutation | rs756819583 | c.340N>A | p.Ala114Thr | p.A114T | Q96AQ2 | protein_coding | tolerated(0.4) | benign(0.014) | TCGA-B5-A1MW-01 | Endometrium | uterine corpus endometrioid carcinoma | Female | <65 | I/II | Unknown | Unknown | PD |
| TMEM125 | SNV | Missense_Mutation | rs373224157 | c.476C>T | p.Ser159Leu | p.S159L | Q96AQ2 | protein_coding | tolerated(0.24) | benign(0) | TCGA-D1-A17Q-01 | Endometrium | uterine corpus endometrioid carcinoma | Female | <65 | I/II | Unknown | Unknown | SD |
| TMEM125 | SNV | Missense_Mutation | rs779719920 | c.97N>T | p.Arg33Cys | p.R33C | Q96AQ2 | protein_coding | deleterious(0) | probably_damaging(0.931) | TCGA-DF-A2KU-01 | Endometrium | uterine corpus endometrioid carcinoma | Female | Unknown | I/II | Unknown | Unknown | SD |
| TMEM125 | SNV | Missense_Mutation | novel | c.611N>A | p.Ser204Tyr | p.S204Y | Q96AQ2 | protein_coding | deleterious(0.01) | possibly_damaging(0.729) | TCGA-EY-A215-01 | Endometrium | uterine corpus endometrioid carcinoma | Female | <65 | I/II | Unknown | Unknown | SD |
| Page: 1 2 |
Top |
Related drugs of malignant transformation related genes |
| Identification of chemicals and drugs interact with genes involved in malignant transfromation |
| (DGIdb 4.0) |
| Entrez ID | Symbol | Category | Interaction Types | Drug Claim Name | Drug Name | PMIDs |
| Page: 1 |

Copyright 2023-Present -The University of Texas Health Science Center at Houston |