
|
|||||
|
 | |
| |
| |
| |
| |
| |
|
Gene: TMEM120A |
Gene summary for TMEM120A |
| Gene information | Species | Human | Gene symbol | TMEM120A | Gene ID | 83862 |
| Gene name | transmembrane protein 120A | |
| Gene Alias | NET29 | |
| Cytomap | 7q11.23 | |
| Gene Type | protein-coding | GO ID | GO:0003008 | UniProtAcc | A0A087X266 |
Top |
Malignant transformation analysis |
| Identification of the aberrant gene expression in precancerous and cancerous lesions by comparing the gene expression of stem-like cells in diseased tissues with normal stem cells |
| Entrez ID | Symbol | Replicates | Species | Organ | Tissue | Adj P-value | Log2FC | Malignancy |
| 83862 | TMEM120A | HTA11_2487_2000001011 | Human | Colorectum | SER | 2.36e-11 | 5.45e-01 | -0.1808 |
| 83862 | TMEM120A | HTA11_347_2000001011 | Human | Colorectum | AD | 2.87e-18 | 4.66e-01 | -0.1954 |
| 83862 | TMEM120A | HTA11_411_2000001011 | Human | Colorectum | SER | 2.23e-05 | 1.13e+00 | -0.2602 |
| 83862 | TMEM120A | HTA11_2112_2000001011 | Human | Colorectum | SER | 2.30e-05 | 6.66e-01 | -0.2196 |
| 83862 | TMEM120A | HTA11_3361_2000001011 | Human | Colorectum | AD | 3.18e-06 | 3.55e-01 | -0.1207 |
| 83862 | TMEM120A | HTA11_83_2000001011 | Human | Colorectum | SER | 1.01e-05 | 4.58e-01 | -0.1526 |
| 83862 | TMEM120A | HTA11_696_2000001011 | Human | Colorectum | AD | 1.59e-15 | 4.51e-01 | -0.1464 |
| 83862 | TMEM120A | HTA11_866_2000001011 | Human | Colorectum | AD | 2.86e-03 | 1.84e-01 | -0.1001 |
| 83862 | TMEM120A | HTA11_1391_2000001011 | Human | Colorectum | AD | 1.06e-09 | 3.73e-01 | -0.059 |
| 83862 | TMEM120A | HTA11_2992_2000001011 | Human | Colorectum | SER | 4.18e-04 | 4.63e-01 | -0.1706 |
| 83862 | TMEM120A | HTA11_5212_2000001011 | Human | Colorectum | AD | 2.35e-06 | 4.87e-01 | -0.2061 |
| 83862 | TMEM120A | HTA11_5216_2000001011 | Human | Colorectum | SER | 2.52e-07 | 7.73e-01 | -0.1462 |
| 83862 | TMEM120A | HTA11_6818_2000001011 | Human | Colorectum | AD | 3.25e-02 | 3.30e-01 | 0.0112 |
| 83862 | TMEM120A | HTA11_7469_2000001011 | Human | Colorectum | AD | 2.87e-03 | 5.04e-01 | -0.0124 |
| 83862 | TMEM120A | HTA11_99999971662_82457 | Human | Colorectum | MSS | 7.81e-13 | 4.10e-01 | 0.3859 |
| 83862 | TMEM120A | HTA11_99999974143_84620 | Human | Colorectum | MSS | 3.71e-06 | 2.73e-01 | 0.3005 |
| 83862 | TMEM120A | LZE4T | Human | Esophagus | ESCC | 7.14e-07 | 1.76e-01 | 0.0811 |
| 83862 | TMEM120A | LZE7T | Human | Esophagus | ESCC | 6.07e-03 | 1.09e-01 | 0.0667 |
| 83862 | TMEM120A | LZE8T | Human | Esophagus | ESCC | 3.36e-04 | 9.65e-02 | 0.067 |
| 83862 | TMEM120A | LZE20T | Human | Esophagus | ESCC | 9.10e-06 | 2.08e-01 | 0.0662 |
| Page: 1 2 3 4 5 6 |
| Tissue | Expression Dynamics | Abbreviation |
| Colorectum (GSE201348) |  | FAP: Familial adenomatous polyposis |
| CRC: Colorectal cancer | ||
| Colorectum (HTA11) | 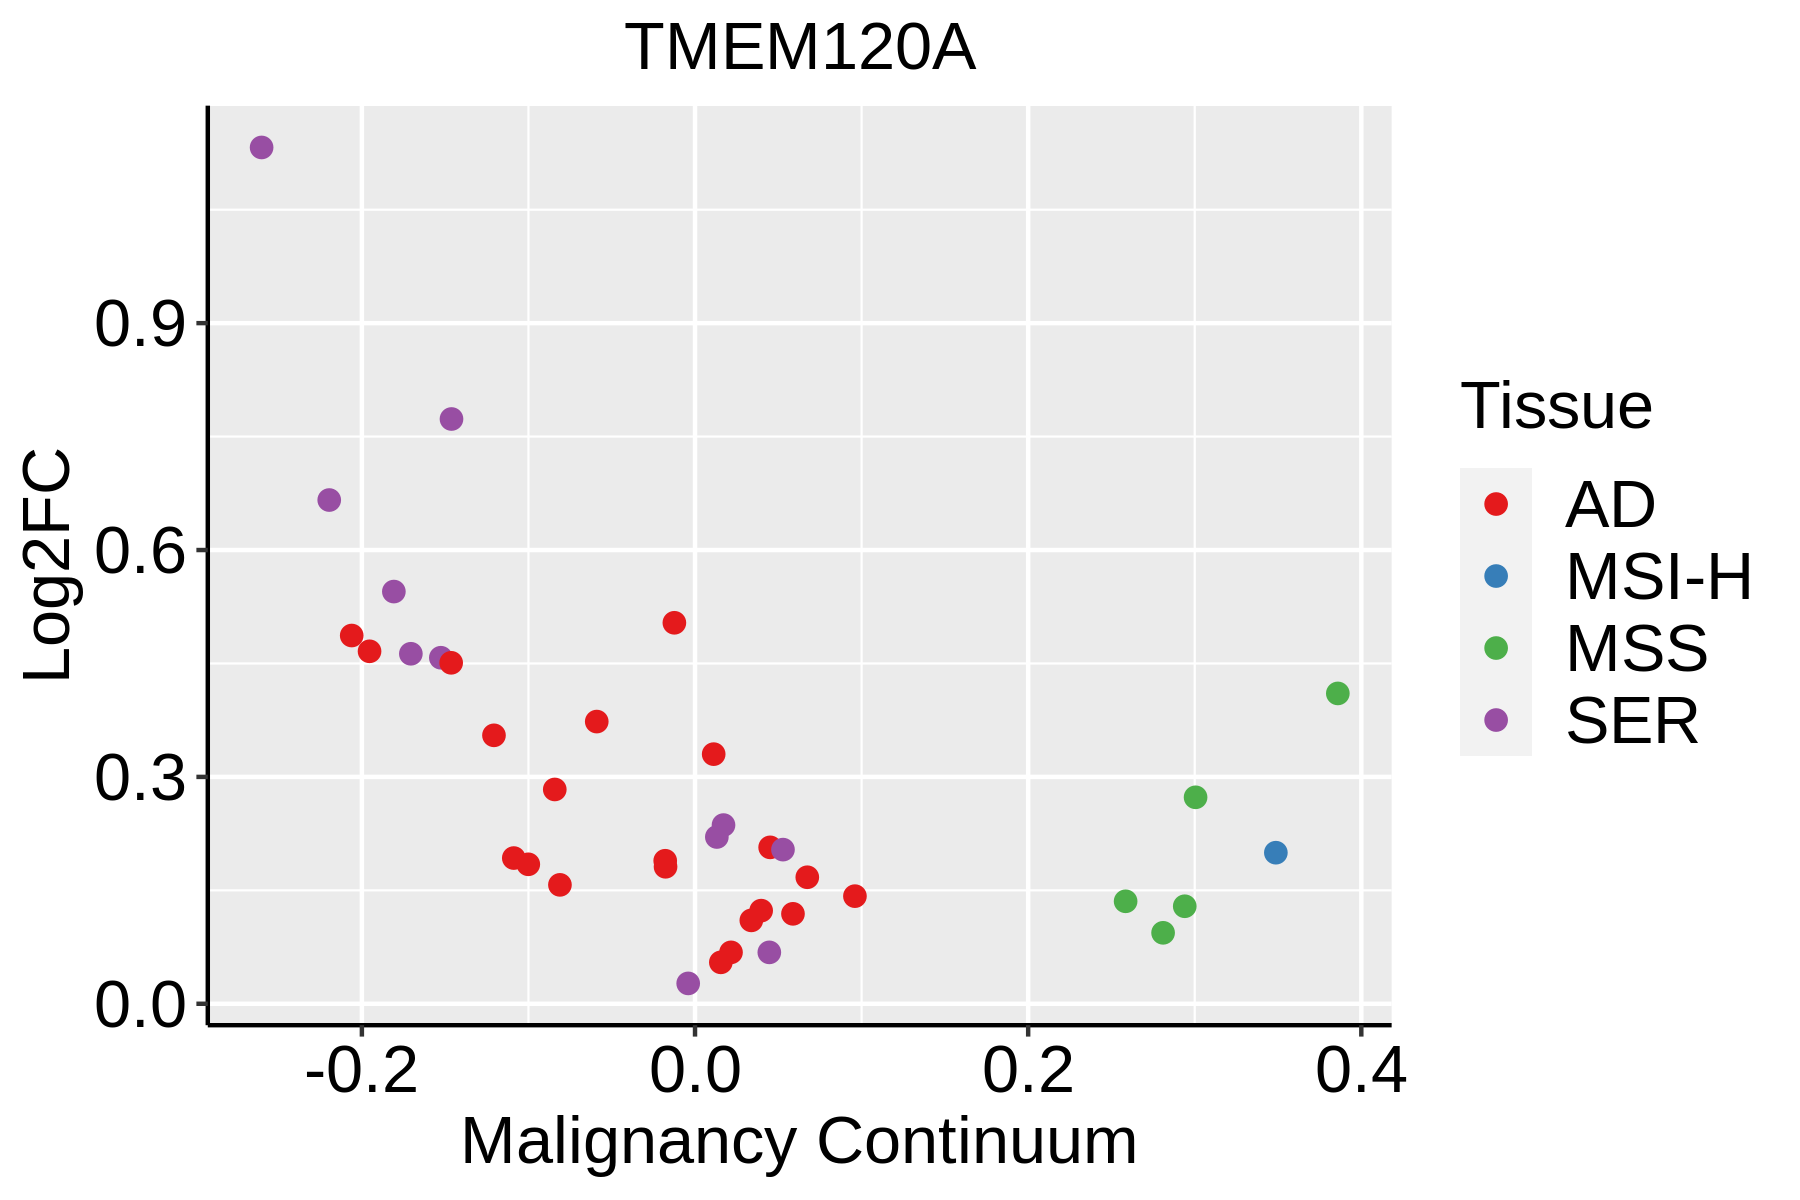 | AD: Adenomas |
| SER: Sessile serrated lesions | ||
| MSI-H: Microsatellite-high colorectal cancer | ||
| MSS: Microsatellite stable colorectal cancer | ||
| Esophagus | 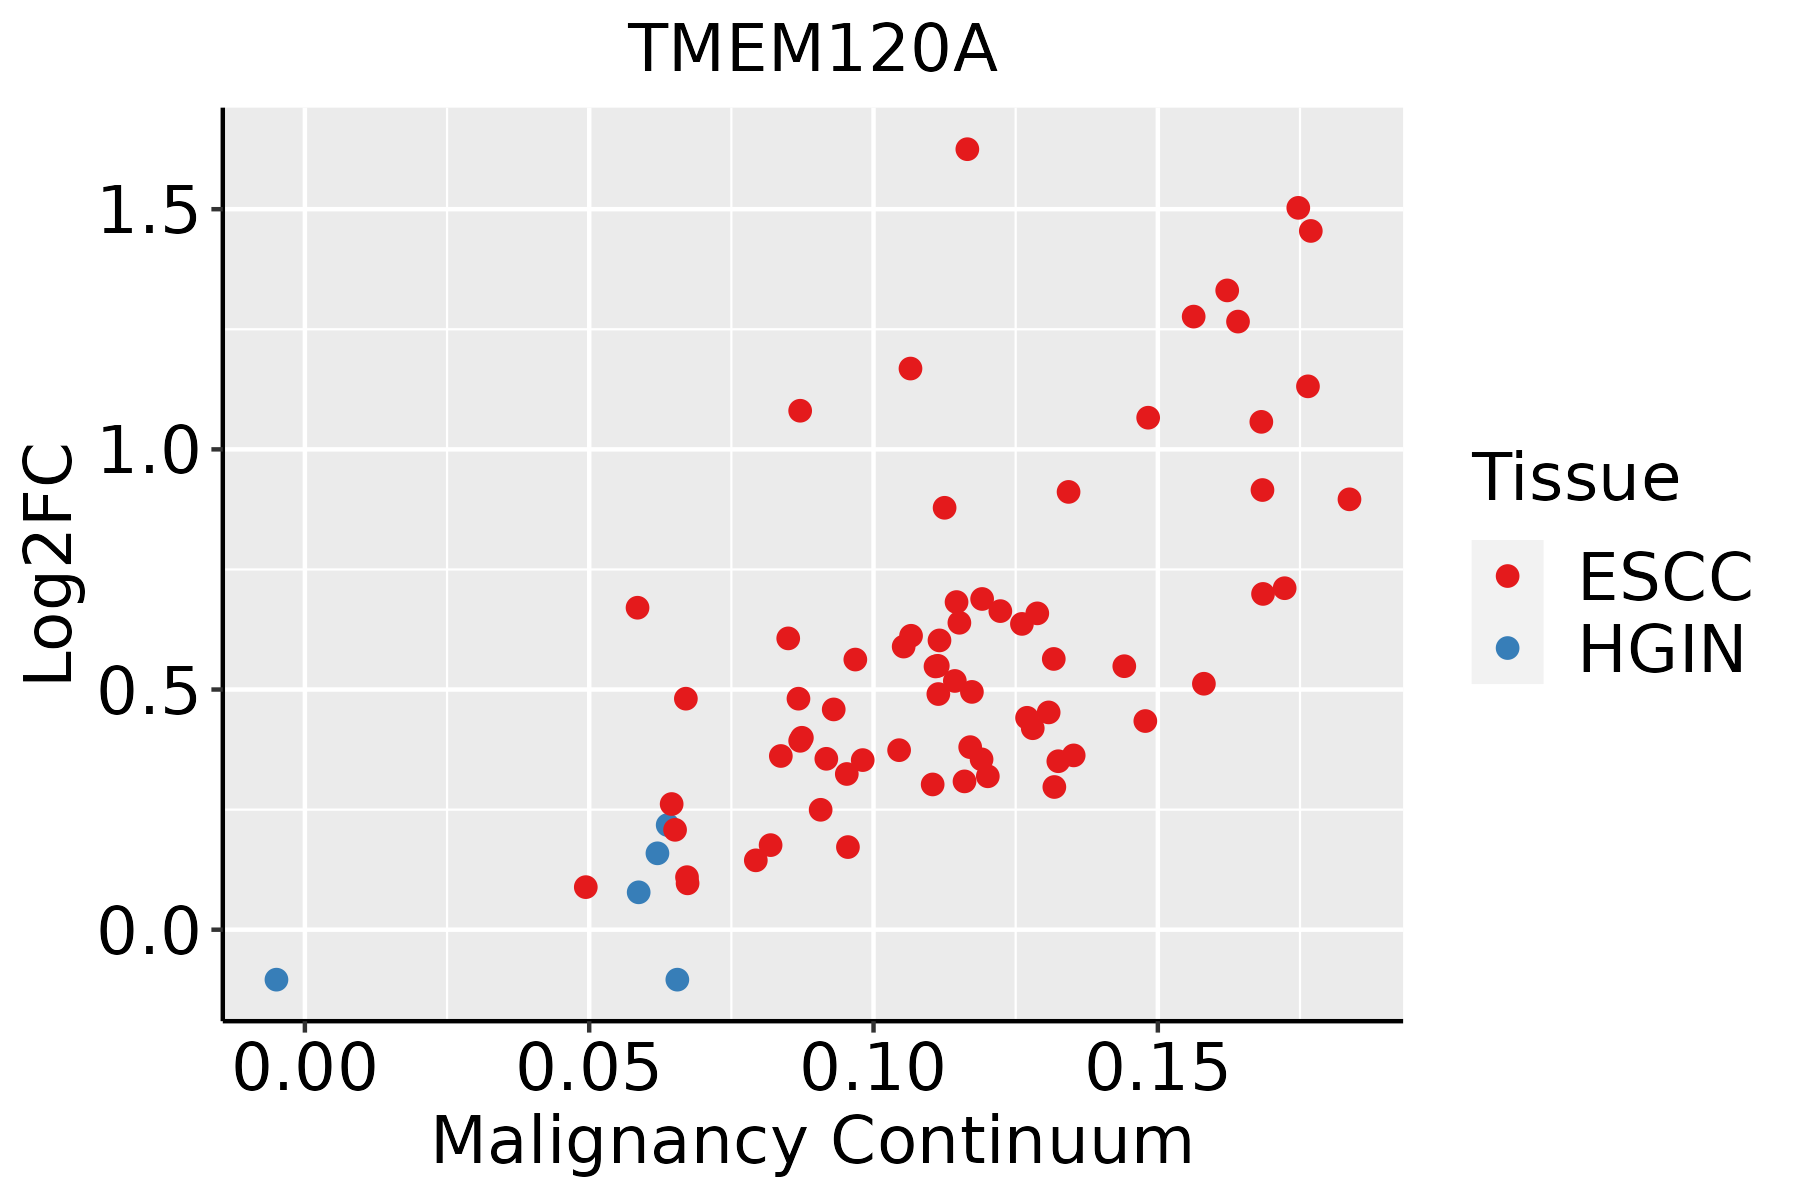 | ESCC: Esophageal squamous cell carcinoma |
| HGIN: High-grade intraepithelial neoplasias | ||
| LGIN: Low-grade intraepithelial neoplasias | ||
| Liver |  | HCC: Hepatocellular carcinoma |
| NAFLD: Non-alcoholic fatty liver disease | ||
| Oral Cavity | 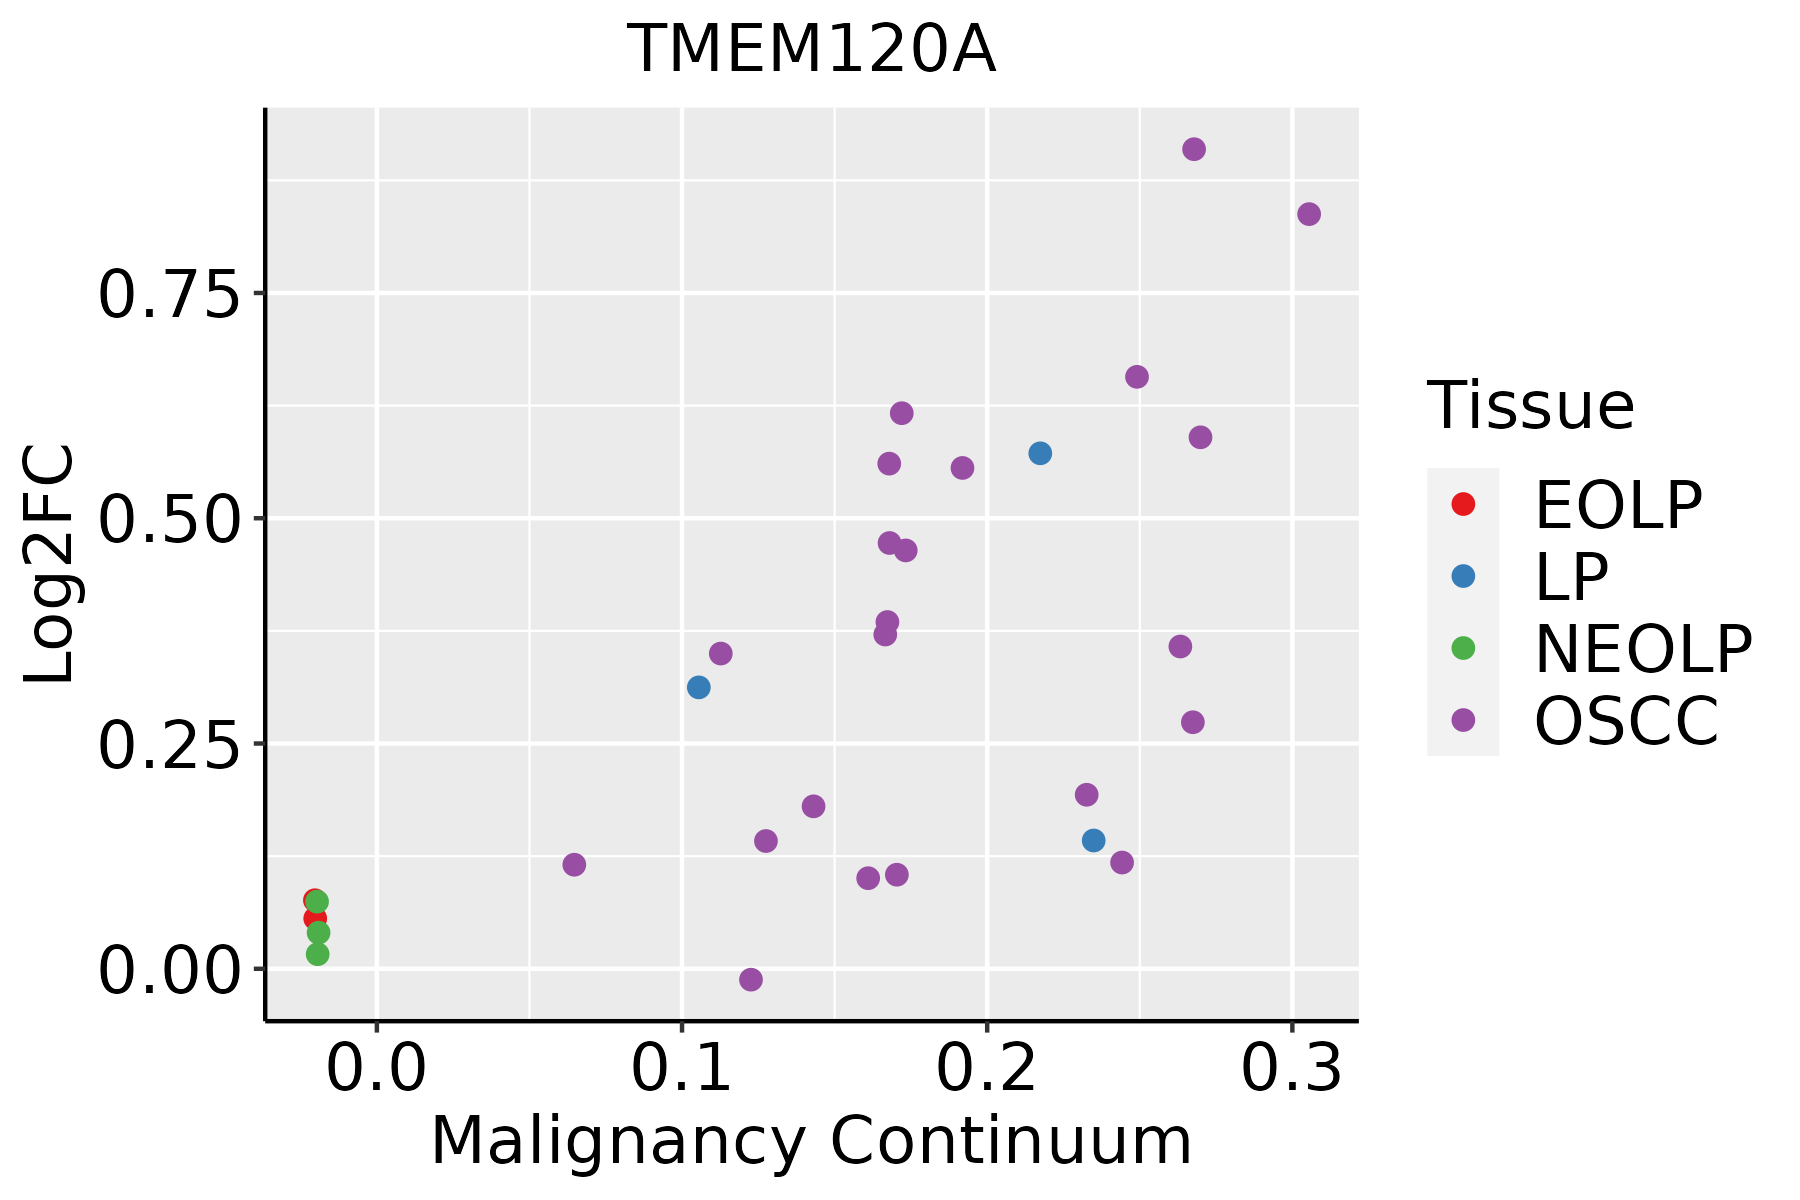 | EOLP: Erosive Oral lichen planus |
| LP: leukoplakia | ||
| NEOLP: Non-erosive oral lichen planus | ||
| OSCC: Oral squamous cell carcinoma |
| ∗log2FC in expression of this searched gene in stem-like cells from each diseased tissue sample relative to stem-like cells in normal samples in each tissue plotted against the malignancy continuum. Samples are colored based on if they are from different disease stage. |
Top |
Malignant transformation related pathway analysis |
| Find out the enriched GO biological processes and KEGG pathways involved in transition from healthy to precancer to cancer |
| Tissue | Disease Stage | Enriched GO biological Processes |
| Colorectum | AD |  |
| Colorectum | SER |  |
| Colorectum | MSS |  |
| Colorectum | MSI-H |  |
| Colorectum | FAP |  |
| ∗Top 15 enriched GO BP terms are showed in the bar plot of each disease state in each tissue. Each row represents a significant GO biological process which is colored according to the -log10(p.adjust). |
| Page: 1 2 3 4 5 6 7 8 9 |
| GO ID | Tissue | Disease Stage | Description | Gene Ratio | Bg Ratio | pvalue | p.adjust | Count |
| GO:0045444 | Colorectum | SER | fat cell differentiation | 51/2897 | 229/18723 | 3.96e-03 | 3.26e-02 | 51 |
| GO:00454449 | Esophagus | ESCC | fat cell differentiation | 135/8552 | 229/18723 | 3.38e-05 | 2.78e-04 | 135 |
| GO:000961216 | Esophagus | ESCC | response to mechanical stimulus | 124/8552 | 216/18723 | 3.30e-04 | 1.94e-03 | 124 |
| GO:00512592 | Esophagus | ESCC | protein complex oligomerization | 130/8552 | 238/18723 | 3.29e-03 | 1.36e-02 | 130 |
| GO:00454442 | Liver | Cirrhotic | fat cell differentiation | 73/4634 | 229/18723 | 8.57e-03 | 3.97e-02 | 73 |
| GO:00454441 | Liver | HCC | fat cell differentiation | 120/7958 | 229/18723 | 1.52e-03 | 8.05e-03 | 120 |
| GO:00096124 | Liver | HCC | response to mechanical stimulus | 113/7958 | 216/18723 | 2.20e-03 | 1.10e-02 | 113 |
| GO:0051291 | Liver | HCC | protein heterooligomerization | 17/7958 | 25/18723 | 8.94e-03 | 3.45e-02 | 17 |
| GO:000961210 | Oral cavity | OSCC | response to mechanical stimulus | 115/7305 | 216/18723 | 1.43e-05 | 1.44e-04 | 115 |
| GO:00454448 | Oral cavity | OSCC | fat cell differentiation | 120/7305 | 229/18723 | 2.48e-05 | 2.32e-04 | 120 |
| GO:0051259 | Oral cavity | OSCC | protein complex oligomerization | 121/7305 | 238/18723 | 1.29e-04 | 9.21e-04 | 121 |
| Page: 1 |
| Pathway ID | Tissue | Disease Stage | Description | Gene Ratio | Bg Ratio | pvalue | p.adjust | qvalue | Count |
| Page: 1 |
Top |
Cell-cell communication analysis |
| Identification of potential cell-cell interactions between two cell types and their ligand-receptor pairs for different disease states |
| Ligand | Receptor | LRpair | Pathway | Tissue | Disease Stage |
| Page: 1 |
Top |
Single-cell gene regulatory network inference analysis |
| Find out the significant the regulons (TFs) and the target genes of each regulon across cell types for different disease states |
| TF | Cell Type | Tissue | Disease Stage | Target Gene | RSS | Regulon Activity |
| ∗The dot plots of a searched regulon are shown for all cell subpopulations in each disease state of each tissue based on the regulon specific score inferred using pySCENIC and by calculating the average expression. |
| Page: 1 |
Top |
Somatic mutation of malignant transformation related genes |
| Annotation of somatic variants for genes involved in malignant transformation |
| Hugo Symbol | Variant Class | Variant Classification | dbSNP RS | HGVSc | HGVSp | HGVSp Short | SWISSPROT | BIOTYPE | SIFT | PolyPhen | Tumor Sample Barcode | Tissue | Histology | Sex | Age | Stage | Therapy Types | Drugs | Outcome |
| TMEM120A | SNV | Missense_Mutation | novel | c.408C>G | p.Phe136Leu | p.F136L | protein_coding | deleterious(0) | probably_damaging(0.991) | TCGA-A2-A0CL-01 | Breast | breast invasive carcinoma | Female | <65 | III/IV | Chemotherapy | cytoxan | SD | |
| TMEM120A | SNV | Missense_Mutation | rs782555331 | c.454C>T | p.Arg152Cys | p.R152C | protein_coding | tolerated(0.06) | probably_damaging(0.999) | TCGA-B6-A1KN-01 | Breast | breast invasive carcinoma | Female | <65 | III/IV | Unknown | Unknown | SD | |
| TMEM120A | SNV | Missense_Mutation | novel | c.484N>A | p.Ala162Thr | p.A162T | protein_coding | tolerated(0.22) | benign(0.06) | TCGA-GM-A2DB-01 | Breast | breast invasive carcinoma | Female | <65 | I/II | Chemotherapy | taxol | CR | |
| TMEM120A | deletion | Frame_Shift_Del | novel | c.960delA | p.Glu321LysfsTer3 | p.E321Kfs*3 | protein_coding | TCGA-EK-A2PI-01 | Cervix | cervical & endocervical cancer | Female | <65 | III/IV | Unknown | Unknown | SD | |||
| TMEM120A | SNV | Missense_Mutation | novel | c.566N>C | p.Ile189Thr | p.I189T | protein_coding | deleterious(0) | possibly_damaging(0.842) | TCGA-A6-3809-01 | Colorectum | colon adenocarcinoma | Female | >=65 | I/II | Unknown | Unknown | SD | |
| TMEM120A | SNV | Missense_Mutation | novel | c.554N>G | p.Asn185Ser | p.N185S | protein_coding | deleterious(0) | benign(0.041) | TCGA-AA-A022-01 | Colorectum | colon adenocarcinoma | Female | >=65 | I/II | Unknown | Unknown | SD | |
| TMEM120A | SNV | Missense_Mutation | novel | c.725N>A | p.Ser242Asn | p.S242N | protein_coding | tolerated(0.08) | possibly_damaging(0.886) | TCGA-AD-A5EJ-01 | Colorectum | colon adenocarcinoma | Female | >=65 | I/II | Unknown | Unknown | SD | |
| TMEM120A | SNV | Missense_Mutation | rs781856159 | c.1096N>T | p.Arg366Cys | p.R366C | protein_coding | deleterious_low_confidence(0.03) | unknown(0) | TCGA-AZ-4313-01 | Colorectum | colon adenocarcinoma | Female | <65 | I/II | Unknown | Unknown | SD | |
| TMEM120A | SNV | Missense_Mutation | rs782572304 | c.697G>A | p.Val233Met | p.V233M | protein_coding | deleterious(0) | probably_damaging(0.93) | TCGA-F4-6570-01 | Colorectum | colon adenocarcinoma | Female | >=65 | I/II | Unknown | Unknown | SD | |
| TMEM120A | SNV | Missense_Mutation | rs782444597 | c.947N>T | p.Ala316Val | p.A316V | protein_coding | deleterious_low_confidence(0.02) | benign(0.034) | TCGA-AJ-A8CT-01 | Endometrium | uterine corpus endometrioid carcinoma | Female | <65 | I/II | Unknown | Unknown | SD |
| Page: 1 2 3 4 |
Top |
Related drugs of malignant transformation related genes |
| Identification of chemicals and drugs interact with genes involved in malignant transfromation |
| (DGIdb 4.0) |
| Entrez ID | Symbol | Category | Interaction Types | Drug Claim Name | Drug Name | PMIDs |
| Page: 1 |

Copyright 2023-Present -The University of Texas Health Science Center at Houston |